Everolimus Plus Ku0063794 Regimen Promotes Anticancer Effects against Hepatocellular Carcinoma Cells through the Paradoxical Inhibition of Autophagy
- Affiliations
-
- 1Department of Surgery, Daejeon St. Mary’s Hospital, College of Medicine, The Catholic University of Korea, Daejeon, Korea.
- 2Department of Surgery, Uijeongbu St. Mary's Hospital, College of Medicine, The Catholic University of Korea, Uijeongbu, Korea.
- 3Department of Surgery, Seoul St. Mary's Hospital, College of Medicine, The Catholic University of Korea, Seoul, Korea. sayjunekim@gmail.com
- 4The Catholic Central Laboratory of Surgery, College of Medicine, The Catholic University of Korea, Seoul, Korea.
- KMID: 2417890
- DOI: http://doi.org/10.4143/crt.2017.085
Abstract
- PURPOSE
Everolimus only inhibits mammalian target of rapamycin complex 1 (mTORC1), whereas Ku0063794 inhibits both mTORC1 and mTORC2. Although they have similar anticancer effects, their combination has a synergistic effect against hepatocellular carcinoma (HCC) cells. We aimed to determine the mechanism underlying the synergistic effects of everolimus and Ku0063794 associated with autophagy in HCC cells.
MATERIALS AND METHODS
We compared the effects of everolimus and Ku0063794, individually or in combination, on both the in vitro and in vivo models of HCCs.
RESULTS
HepG2 cells treated with both agents had significantly lower rates of cell proliferation and higher apoptosis than the individual monotherapies (p < 0.05). Autophagic studies consistently indicated that, unlike the monotherapies, the combination therapy significantly reduced autophagy (p < 0.05). Autophagic blockage directly promoted the pro-apoptotic effects of combination therapy, suggesting autophagy as the survival mechanism of HCC cells. Unlike the monotherapies, combination therapy showed the potential to inhibit sirtuin 1 (SIRT1), the positive regulator of autophagy. SIRT1 overexpression abrogated the autophagy-inhibiting and pro-apoptotic effects of combination therapy. In a nude mouse xenograft model, the shrinkage of tumors was more prominent in mice treated with combination therapy than in mice treated with the respective monotherapies (p < 0.05). The immunohistochemical and immunofluorescence stains of the tumor obtained from the xenograft model showed that combination therapy had the potential of reducing autophagy and promoting apoptosis.
CONCLUSION
The combination of everolimus and Ku0063794 potentiates anticancer effects on HCCs through a decrease in autophagy, which is prompted by SIRT1 downregulation.
MeSH Terms
-
Animals
Apoptosis
Autophagy*
Carcinoma, Hepatocellular*
Cell Proliferation
Coloring Agents
Down-Regulation
Everolimus*
Fluorescent Antibody Technique
Hep G2 Cells
Heterografts
In Vitro Techniques
Mice
Mice, Nude
Sirolimus
Sirtuin 1
TOR Serine-Threonine Kinases
Coloring Agents
Everolimus
Sirolimus
Sirtuin 1
TOR Serine-Threonine Kinases
Figure
-
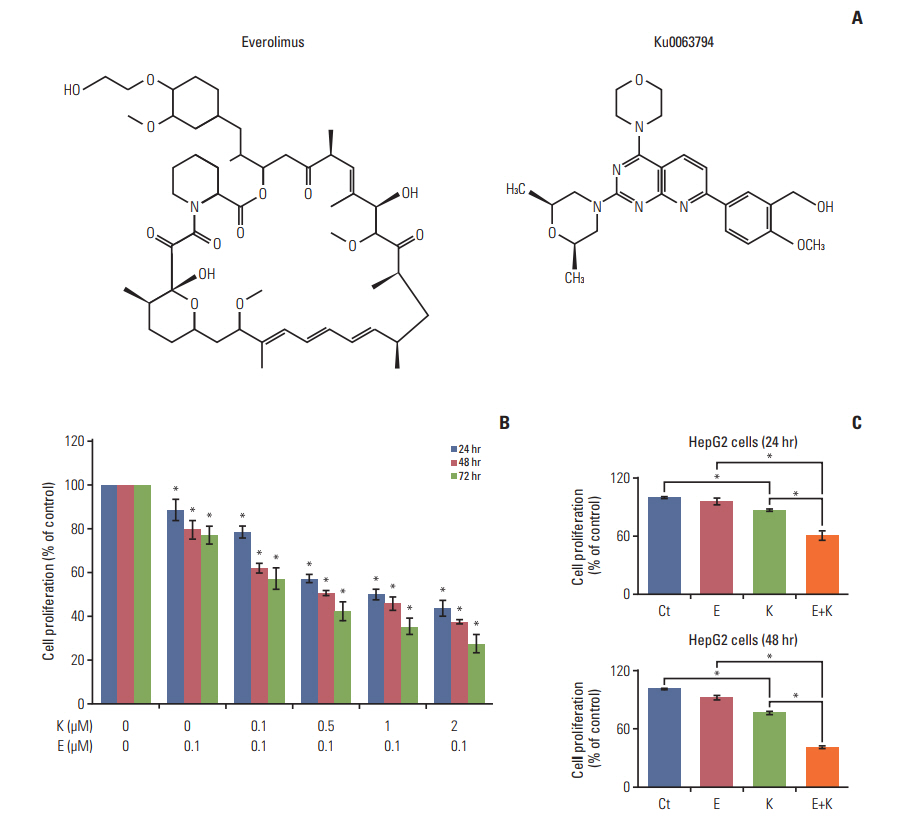
Fig. 1. Effects of everolimus and Ku0063794, either individually or in combination, on cell proliferation and on the expression of mTOR downstream molecules in HepG2 cells. (A) Chemical structures of everolimus and Ku0063794. (B) Combining everolimus with a graduated concentration of Ku0063794 resulted in a significant dose- and time-dependent decrease in HepG2 cell proliferation. (C) Comparison of HepG2 cell proliferation at the concentrations of everolimus (100 μM) and Ku0063794 (1 μM) used in this experiment after 24-hour (top) and 48-hour (bottom) treatments, respectively. Values represent mean±standard deviation of three independent experiments. *p < 0.05. mTOR, mammalian target of rapamycin; Ct, control; E, everolimus; K, Ku0063794.

Fig. 2. Effects of everolimus and Ku0063794, either individually or in combination, on the expression of mTOR downstream molecules in HepG2 cells. (A-C) Western blot analyses of the dose-dependent effects of everolimus (A) and Ku0063794 (B), and their combination (C) on the expression of mTOR downstream molecules. Higher concentrations of everolimus and Ku0063794 reduced the expression of p-mTOR and p-p70S6K. However, combining both agents resulted in a stronger dosedependent inhibition of p-mTOR and p-p70S6K. (D) Representative expression of mTOR downstream molecules at the concentrations of everolimus (100 nM) and Ku0063794 (1 μM) used in this experiment (left). Relative densities of these markers in each group (right). The Band Analysis tools of ImageLab software (Bio-Rad) were used to determine the density of the bands in all blots. β-Actin was used as a normalization control. Values represent mean±standard deviation of three independent experiments. *p < 0.05. mTOR, mammalian target of rapamycin.

Fig. 3. Effects of everolimus and Ku0063794, either individually or in combination, on apoptosis in HepG2 cells. (A) Western blot analyses showing the expression of markers reflecting apoptosis (c-PARP and c-Cas3) and anti-apoptosis (Mcl-1) depending on the treatment with everolimus (left) and Ku0063794 (middle), and their combination (right). Everolimus or Ku0063794 monotherapies increased the expression of c-PARP and c-Cas3, and reduced the expression of Mcl-1, mostly dose-dependently. The combination therapy appeared to potentiate the pro-apoptotic effects of individual monotherapies. ) (B) Representative expression of the markers related to pro-apoptosis (c-PARP, c-Cas9, c-Cas3, and Bim) and anti-apoptosis (Bcl-xL and Mcl-1) at the concentrations of everolimus (100 nM) and Ku0063794 (1 μM) used in this experiment. (C) Effects of everolimus and Ku0063794, either individually or in combination, on apoptosis using annexin V/PI staining and flow cytometry (top). Relative densities of these markers in each group (bottom). Apoptotic cells were expressed as the total percentage of annexin V–positive/PI-negative cells. The number of annexin V–positive cells (early and late apoptotic cells) was significantly higher in HepG2 cells treated with the combination compared to cells treated with the monotherapies. Band Analysis tools in ImageLab software (Bio-Rad) were used to determine the density of the bands in all blots. β-Actin was used as a normalization control. Values represent mean±standard deviation of three independent experiments. *p < 0.05. Bcl-xL, B-cell lymphoma-extra-large; Bim, Bcl-2-like protein 11; c-Cas, cleaved caspase; c-PARP, cleaved poly(ADP-ribose) polymerase; Ct, control; E, everolimus; K, Ku0063794; Mcl-1, myeloid cell leukemia-1; PI, propidium iodide.
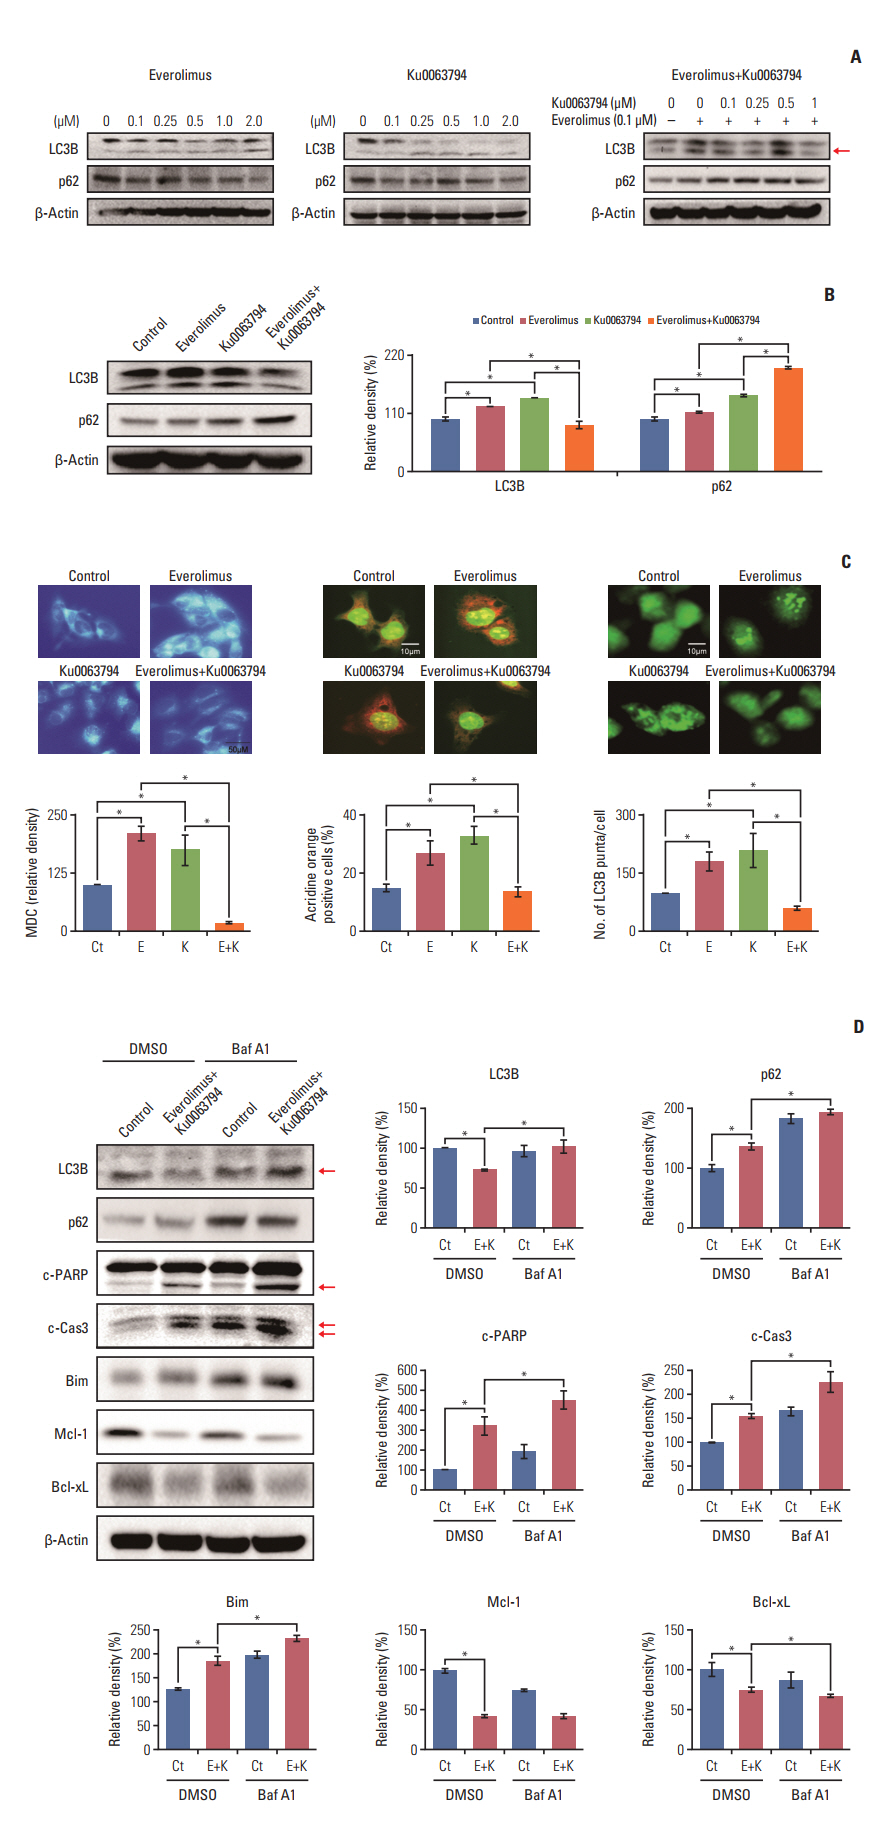
Fig. 4. Effects of everolimus and Ku0063794, either individually or in combination, on autophagy in HepG2 cells. (A) Western blot analyses of the dose-dependent effects of everolimus (left), Ku0063794 (middle), and their combination (right) on the expression of autophagy markers (LC3B and p62). Whereas the everolimus and Ku0063794 monotherapies increased autophagy (higher expression of LC3B and lower expression of p62), the combination of both agents paradoxically decreased autophagy (lower expression of LC3B and higher expression of p62). An arrow indicates the band for LC3B form-II, and autophagosome marker. (B) Representative expression of autophagy markers at the concentrations of everolimus (100 nM) and Ku0063794 (1 μM) used in this experiment. Note the paradoxical reduction in autophagy (lower expression of LC3B and higher expression of p62) in the combination group. (C) Autophagy studies demonstrating autophagy levels according to treatment with everolimus and Ku0063794, either individually or in combination. To precisely quantify the levels of autophagy in each group, we performed immunofluorescence combined with flow cytometry with MDC (left), quantitative analysis of autophagy using acridine orange staining and flow cytometry (middle), and GFP-LC3 puncta staining (right) of HepG2 cells in each group. The levels of autophagy correlate with numbers of MDC-positive cells, acridine orange-positive cells, and LC3B punta-positive cells. Relative densities of these markers in each group (bottom) (magnification, ×600). The autophagy studies consistently indicated that, unlike the individual monotherapies, combination therapy significantly decreased the levels of autophagy. (D) Western blot analysis showing the effects of autophagy suppression by bafilomycin A1 on the expression of autophagy (LC3B and p62), pro-apoptosis (c-PARP, c-Cas3, and Bim), and anti-apoptosis (Mcl-1 and Bcl-xL) markers (left). Relative densities of these markers in each group (right). Successful autophagy inhibition by Baf A1 was demonstrated by the higher expression of both LC3B and p63. Autophagy inhibition promoted the pro-apoptotic effects of combination therapy, as demonstrated by the higher expression of pro-apoptotic markers and by the lower expression of anti-apoptotic markers. Arrows indicate the bands for the cleaved forms of PARP and caspase 3, respectively. The Band Analysis tools of ImageLab software (Bio-Rad) were used to determine the density of the bands in all blots. β-Actin was used as normalization control. Values represent mean±standard deviation of three independent experiments. *p < 0.05. Baf A1, bafilomycin A1; Bcl-xL, B-cell lymphoma-extra-large; Bim, Bcl-2 like protein 11; c-Cas3, cleaved caspase 3; c-PARP, cleaved poly(ADP-ribose) polymerase; Ct, control group; DMSO, dimethyl sulfoxide; E, everolimus; K, Ku0063794; LC3B, LC3-phosphatidylethanolamine conjugate; Mcl-1, myeloid cell leukemia-1; MDC, monodansylcadaverine.
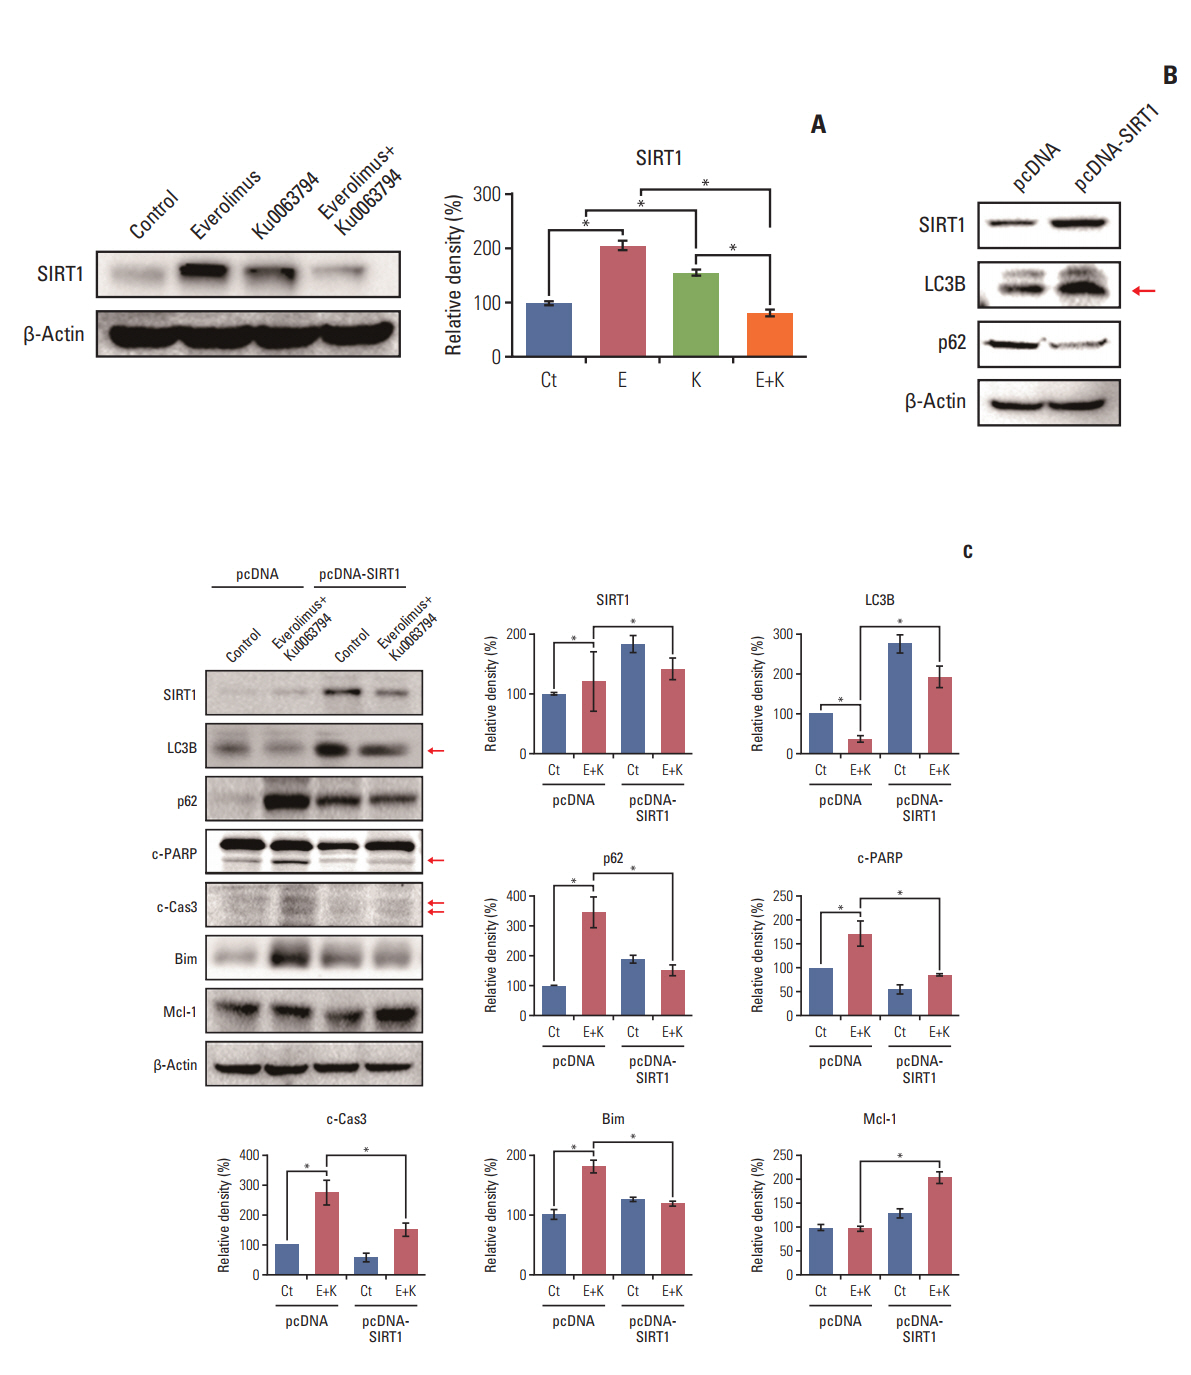
Fig. 5. Determination of the role of SIRT-1 during autophagy of HepG2 cells. (A) Western blot analyses showing the effects of everolimus and Ku0063794, either individually or in combination, on the expression of SIRT1 (left). Relative densities of these markers in each group (right). Unlike the monotherapies, combination therapy significantly inhibited the expression of SIRT1. (B) Identification of successful transfection of pcDNA-SIRT1 into HepG2 cells as detected by Western blot analysis. Successful integration was identified by the higher expression of SIRT1. Transfection with pcDNA-SIRT1 promoted autophagy, as demonstrated by higher expression of LC3B and lower expression of p62. (C) SIRT1 overexpression assay to evaluate whether combination therapy increases HCC cell apoptosis by decreasing SIRT1 (left). Relative densities of these markers in each group (right). Overexpression of SIRT1 abrogated both autophagy-inhibiting and pro-apoptotic effects of combination therapy, which was manifested by higher expression of LC3B and lower expression of p62, and lower expression of pro-apoptotic markers (c-PARP, c-Cas3, and Bim) and higher expression of Mcl-1. These data suggest that combination therapy promotes apoptosis of HepG2 cells by downregulating SIRT1 expression. The Band Analysis tools of ImageLab software (Bio-Rad) were used to determine the density of the bands in all blots. β-Actin was used as normalization control. Values represent mean±standard deviation of three independent experiments. *p < 0.05. Ct, control group; Bim, Bcl-2 like protein 11; c-Cas3, cleaved caspase 3; c-PARP, cleaved poly(ADP-ribose) polymerase; E, everolimus; K, Ku0063794; LC3B, LC3-phosphatidylethanolamine conjugate; Mcl1, myeloid cell leukemia-1; SIRT1, sirtuin 1.
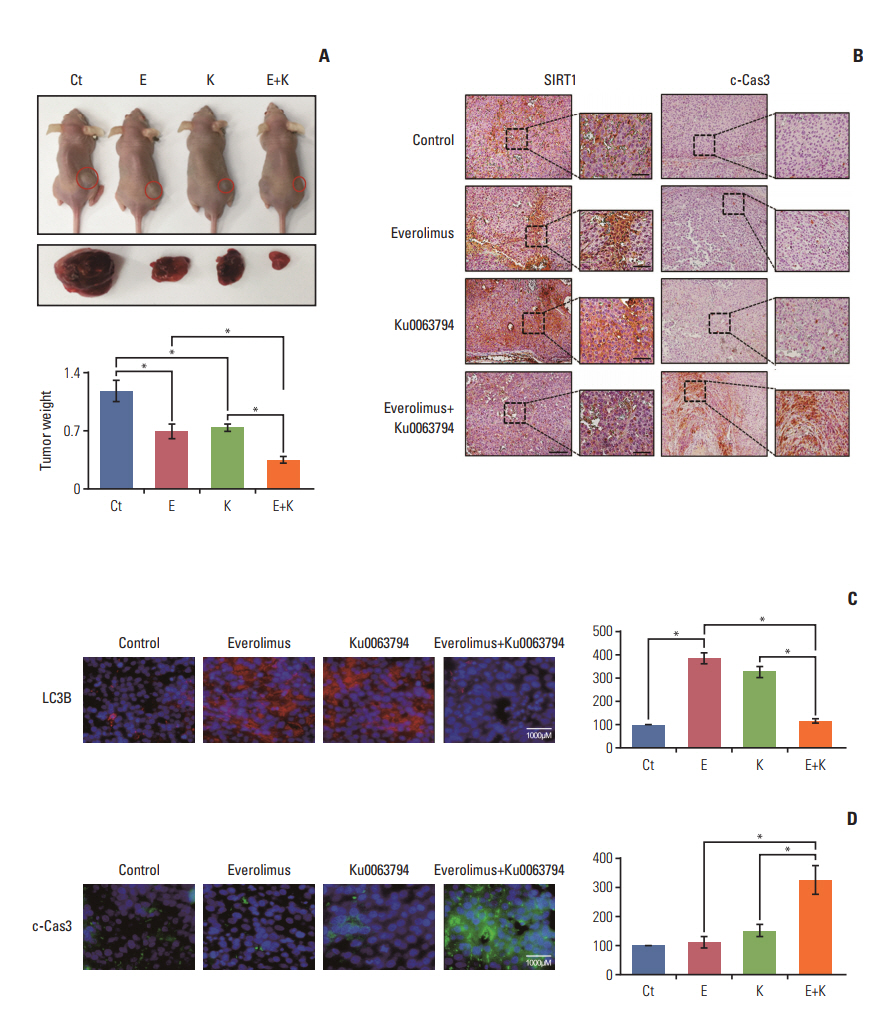
Fig. 6. Validation of everolimus and Ku0063794 anticancer effects, either individually or in combination, in a nude mouse xenograft model. After everolimus (0.5 mg/kg/day) and Ku0063794 (1 mg/kg/day) were administered orally every day for 3 weeks, mice were euthanized and tumors were collected. (A) Morphological images and final tumor weights in the xenograft tumor model using HepG2 cells according to treatment with everolimus and Ku0063794, either individually or in combination. Tumor reduction was more pronounced in mice treated with combination therapy than in mice treated with the respective monotherapies (top). Final tumor weight at 3 weeks (bottom). Tumor weight was markedly reduced in the mice treated with combination therapy compared with the mice treated with individual monotherapies (p < 0.05). (B) The representative SIRT1 and c-Cas3 immunohistochemical stains of the tumor cell mass obtained from the xenograft model at 3 weeks. The combination group exhibited lower expression of SIRT1 and higher expression of c-Cas3. (C, D) The representative LC3B and c-Cas3 immunofluorescences of the tumor cell mass obtained from the xenograft model at 3 weeks. The combination group resulted in the significant reduction of LC3B and the significant increase of c-Cas3. Values represent mean±standard deviation of three independent experiments. *p < 0.05. c-Cas3, cleaved caspase 3; Ct, control; E, everolimus; K, Ku0063794; LC3B, LC3-phosphatidylethanolamine conjugate; SIRT1, sirtuin 1.
Cited by 1 articles
-
Potentiation of the Anticancer Effects by Combining Docetaxel with Ku-0063794 against Triple-Negative Breast Cancer Cells
Ye-Won Jeon, Ok-Hee Kim, Jin Sun Shin, Ha Eun Hong, Cho Hee Kim, Say-June Kim
Cancer Res Treat. 2022;54(1):157-173. doi: 10.4143/crt.2020.1063.
Reference
-
References
1. Altekruse SF, McGlynn KA, Reichman ME. Hepatocellular carcinoma incidence, mortality, and survival trends in the United States from 1975 to 2005. J Clin Oncol. 2009; 27:1485–91.
Article2. El-Serag HB. Hepatocellular carcinoma. N Engl J Med. 2011; 365:1118–27.
Article3. Villanueva A, Chiang DY, Newell P, Peix J, Thung S, Alsinet C, et al. Pivotal role of mTOR signaling in hepatocellular carcinoma. Gastroenterology. 2008; 135:1972–83.
Article4. Laplante M, Sabatini DM. mTOR signaling in growth control and disease. Cell. 2012; 149:274–93.
Article5. Sparks CA, Guertin DA. Targeting mTOR: prospects for mTOR complex 2 inhibitors in cancer therapy. Oncogene. 2010; 29:3733–44.
Article6. Yamanaka K, Petrulionis M, Lin S, Gao C, Galli U, Richter S, et al. Therapeutic potential and adverse events of everolimus for treatment of hepatocellular carcinoma: systematic review and meta-analysis. Cancer Med. 2013; 2:862–71.7. Zhu AX, Abrams TA, Miksad R, Blaszkowsky LS, Meyerhardt JA, Zheng H, et al. Phase 1/2 study of everolimus in advanced hepatocellular carcinoma. Cancer. 2011; 117:5094–102.
Article8. Kim JO, Kim KH, Song IS, Cheon KS, Kim OH, Lee SC, et al. Potentiation of the anticancer effects of everolimus using a dual mTORC1/2 inhibitor in hepatocellular carcinoma cells. Oncotarget. 2017; 8:2936–48.
Article9. Hamacher-Brady A, Brady NR, Gottlieb RA. The interplay between pro-death and pro-survival signaling pathways in myocardial ischemia/reperfusion injury: apoptosis meets autophagy. Cardiovasc Drugs Ther. 2006; 20:445–62.
Article10. Ravikumar B, Sarkar S, Davies JE, Futter M, Garcia-Arencibia M, Green-Thompson ZW, et al. Regulation of mammalian autophagy in physiology and pathophysiology. Physiol Rev. 2010; 90:1383–435.
Article11. Codogno P, Mehrpour M, Proikas-Cezanne T. Canonical and non-canonical autophagy: variations on a common theme of self-eating? Nat Rev Mol Cell Biol. 2011; 13:7–12.
Article12. Kamada Y, Funakoshi T, Shintani T, Nagano K, Ohsumi M, Ohsumi Y. Tor-mediated induction of autophagy via an Apg1 protein kinase complex. J Cell Biol. 2000; 150:1507–13.
Article13. Mehrpour M, Esclatine A, Beau I, Codogno P. Autophagy in health and disease. 1. Regulation and significance of autophagy: an overview. Am J Physiol Cell Physiol. 2010; 298:C776–85.
Article14. Jeong JK, Moon MH, Lee YJ, Seol JW, Park SY. Autophagy induced by the class III histone deacetylase Sirt1 prevents prion peptide neurotoxicity. Neurobiol Aging. 2013; 34:146–56.
Article15. Lee JT, Gu W. SIRT1: regulator of p53 deacetylation. Genes Cancer. 2013; 4:112–7.
Article16. Baur JA. Biochemical effects of SIRT1 activators. Biochim Biophys Acta. 2010; 1804:1626–34.
Article17. Li X. SIRT1 and energy metabolism. Acta Biochim Biophys Sin (Shanghai). 2013; 45:51–60.
Article18. Fullgrabe J, Klionsky DJ, Joseph B. Histone post-translational modifications regulate autophagy flux and outcome. Autophagy. 2013; 9:1621–3.
Article19. Lee IH, Cao L, Mostoslavsky R, Lombard DB, Liu J, Bruns NE, et al. A role for the NAD-dependent deacetylase Sirt1 in the regulation of autophagy. Proc Natl Acad Sci U S A. 2008; 105:3374–9.
Article20. Bradshaw-Pierce EL, Pitts TM, Kulikowski G, Selby H, Merz AL, Gustafson DL, et al. Utilization of quantitative in vivo pharmacology approaches to assess combination effects of everolimus and irinotecan in mouse xenograft models of colorectal cancer. PLoS One. 2013; 8:e58089.
Article21. Baehrecke EH. Autophagy: dual roles in life and death? Nat Rev Mol Cell Biol. 2005; 6:505–10.
Article22. Tang B, Dong X, Wei Z, Qiao H, Jiang H, Liu B, et al. Enhanced autophagy by everolimus contributes to the antirestenotic mechanisms in vascular smooth muscle cells. J Vasc Res. 2014; 51:259–68.
Article23. Bordone L, Guarente L. Calorie restriction, SIRT1 and metabolism: understanding longevity. Nat Rev Mol Cell Biol. 2005; 6:298–305.
Article24. Ding ZB, Hui B, Shi YH, Zhou J, Peng YF, Gu CY, et al. Autophagy activation in hepatocellular carcinoma contributes to the tolerance of oxaliplatin via reactive oxygen species modulation. Clin Cancer Res. 2011; 17:6229–38.
Article25. Shimizu S, Takehara T, Hikita H, Kodama T, Tsunematsu H, Miyagi T, et al. Inhibition of autophagy potentiates the antitumor effect of the multikinase inhibitor sorafenib in hepatocellular carcinoma. Int J Cancer. 2012; 131:548–57.
Article26. Xie Z, Klionsky DJ. Autophagosome formation: core machinery and adaptations. Nat Cell Biol. 2007; 9:1102–9.
Article27. Ganley IG, Lam du H, Wang J, Ding X, Chen S, Jiang X. ULK1.ATG13.FIP200 complex mediates mTOR signaling and is essential for autophagy. J Biol Chem. 2009; 284:12297–305.
Article28. Hosokawa N, Hara T, Kaizuka T, Kishi C, Takamura A, Miura Y, et al. Nutrient-dependent mTORC1 association with the ULK1-Atg13-FIP200 complex required for autophagy. Mol Biol Cell. 2009; 20:1981–91.
Article29. Back JH, Rezvani HR, Zhu Y, Guyonnet-Duperat V, Athar M, Ratner D, et al. Cancer cell survival following DNA damagemediated premature senescence is regulated by mammalian target of rapamycin (mTOR)-dependent Inhibition of sirtuin 1. J Biol Chem. 2011; 286:19100–8.
Article30. Ma L, Dong W, Wang R, Li Y, Xu B, Zhang J, et al. Effect of caloric restriction on the SIRT1/mTOR signaling pathways in senile mice. Brain Res Bull. 2015; 116:67–72.
Article
- Full Text Links
-
- Actions
-
Cited
- CITED
-
- Close
- Share
-
- Similar articles
-
- Metformin Promotes Apoptosis but Suppresses Autophagy in Glucose-Deprived H4IIE Hepatocellular Carcinoma Cells
- Autophagy Inhibition Promotes Quercetin Induced Apoptosis in MG-63 Human Osteosarcoma cells
- Glutamine synthetase mediates sorafenib sensitivity in β-catenin-active hepatocellular carcinoma cells
- Transglutaminase 2 Promotes Autophagy by LC3 Induction through p53 Depletion in Cancer Cell
- Hepatitis B virus X Protein Promotes Liver Cancer Progression through Autophagy Induction in Response to TLR4 Stimulation
