Selection of Thymocytes Expressing Transgenic TCR Specific for a Minor Histocompatibility Antigen, H60
- Affiliations
-
- 1Department of Biomedical Sciences, Seoul National University College of Medicine, Seoul 03080, Korea. eycii@snu.ac.kr
- 2Division of Life and Pharmaceutical Sciences, Ewha Womans University, Seoul 03760, Korea.
- KMID: 2150851
- DOI: http://doi.org/10.4110/in.2015.15.5.222
Abstract
- Minor histocompatibility antigens are MHC-bound peptides and contribute to the generation of allo-responses after allogeneic transplantation. H60 is a dominant minor H antigen that induces a strong CD8 T-cell response in MHC-matched allogeneic transplantation settings. Here, we report establishment of a TCR transgenic mouse line named J15, wherein T cells express TCRs specific for H60 in complex with H-2K(b), and different fates of the thymocytes expressing J15 TCRs in various thymic antigenic environments. Thymocytes expressing the J15 TCRs were positively selected and differentiated into CD8+ single positive (SP) cells in the thymus of C57BL/6 mice, wherein the cognate antigen H60 is not expressed. However, thymocytes were negatively selected in thymus tissue where H60 was transgenically expressed under the control of the actin promoter, with double-positive stages of cells being deleted. Despite the ability of the H60H peptide (LTFHYRNL) variant to induce cytotoxic activity from H60-specific CTL lines at ~50% of the activity induced by normal H60 peptides (LTFNYRNL), J15-expressing thymocytes were positively selected in the thymus where the variant H60H was transgenically expressed. These results demonstrate that a single amino-acid change in the H60 epitope peptide influences the fate of thymocytes expressing the cognate TCR.
MeSH Terms
Figure
-
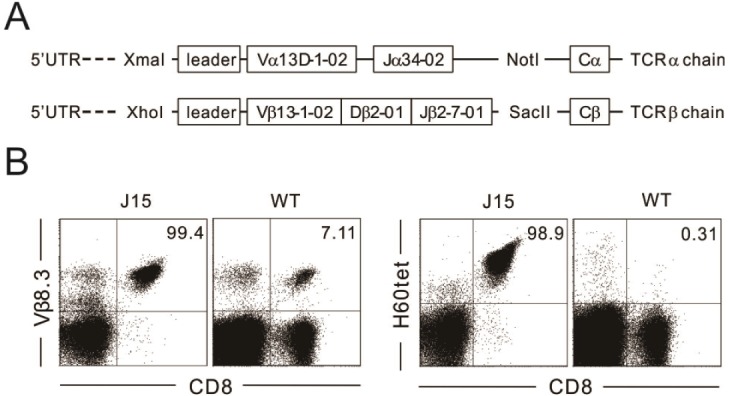
Figure 1 Generation and evaluation of J15 TCR transgenic mice. (A) Diagram depicting cassette vectors pTα and pTβ. Each vector has V-region (Vα and Vβ, respectively) promoter and the complete constant-region (Cα and Cβ, respectively) gene sequences and were subcloned with Vα13D-1 and Jα34-02 for the α chain (using XmaI and NotI), as well as Vβ13-1-02, Dβ2-01, and Jβ2-7-01 for the β chain (using XhoI and SacII). (B) J15 TCR transgenic mice were screened by staining the peripheral blood lymphocytes with anti-V β8.3 mAb, anti-CD8 mAb, and H60-tetramer, followed by flow-cytometric analysis. Vβ8.3 by CD8 and H60-tetramer by CD8 profiles of peripheral-blood lymphocytes from J15 and WT mice. Numbers in plots indicate the frequency of Vβ8.3 expression or H60-tetramer binding of CD8 T cells in the peripheral blood from J15 and WT mice.

Figure 2 Positive selection of J15 TCR transgenic T cells specific for H60. (A) CD4 by CD8 profiles (left) of thymocytes and numbers (right) of each thymic population from J15, OT-I, and WT mice on the B6 background. Numbers at the top of plots indicate total number of thymocytes. (B) Surface expression of Vβ8.3 and Vβ5.2, as well as (C) the binding of the H60- and OVA-tetramer of DN, DP, and CD8 SP thymocytes from J15, OT-I, and WT mice. (D) CD4 by CD8 profiles (left) of splenocytes and numbers (right) of CD4 and CD8 T cells in the spleen from J15, OT-I, and WT mice. (E) Surface expression of Vβ8.3 and Vβ5.2, as well as the binding of the H60- and OVA-tetramer of CD8 T cells in the spleen from J15, OT-I, and WT mice. Numbers in plots indicate the percentage of cells in each quadrant. ***p<0.001; **p<0.01; *p<0.05. Data are representative of three independent experiments and depict the mean±SD.
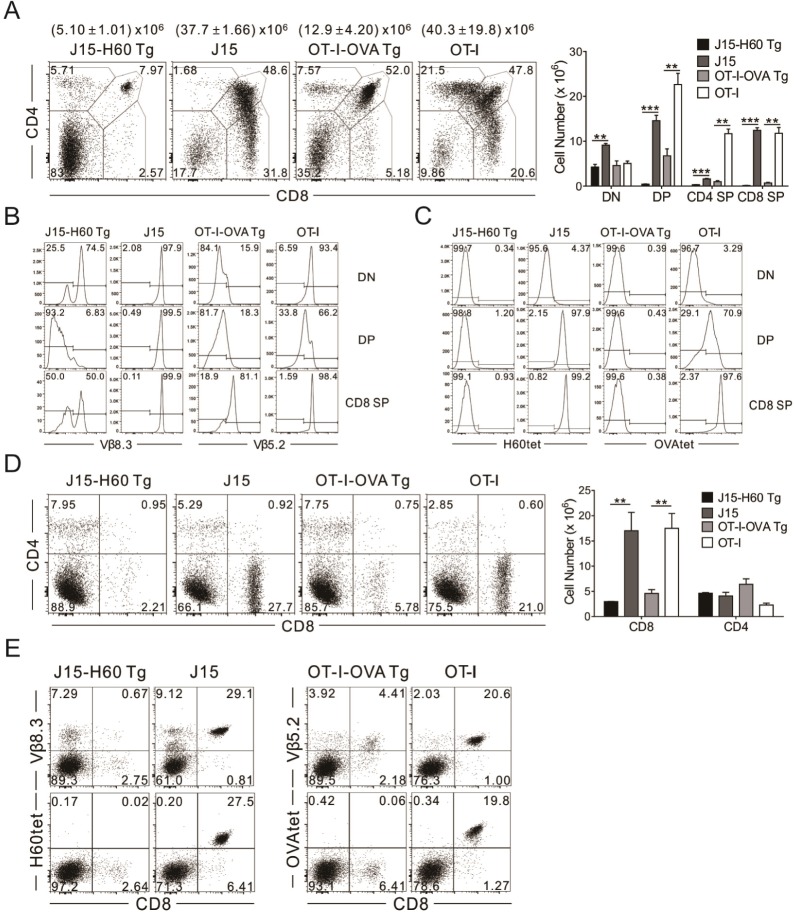
Figure 3 Negative selection of J15 TCR transgenic T cells specific for H60. (A) CD4 by CD8 profiles (left) of thymocytes and numbers (right) of each thymic population from J15-H60 Tg, J15, OT-I-OVA Tg, and OT-I mice on the B6 background. Numbers at the top of the plots indicate total number of thymocytes. (B) Surface expression of Vβ8.3 and Vβ5.2, as well as (C) the binding of the H60- and OVA-tetramer of DN, DP, and CD8 SP thymocytes from J15-H60 Tg, J15, OT-I-OVA Tg, and OT-I mice. (D) CD4 by CD8 profiles (left) of splenocytes and numbers (right) of CD4 and CD8 T cells in the spleen from J15-H60 Tg, J15, OT-I-OVA Tg, and OT-I mice. (E) Surface expression of Vβ8.3 and Vβ5.2, as well as the binding of the H60- and OVA-tetramer of CD8 T cells in the spleen from J15-H60 Tg, J15, OT-I-OVA Tg, and OT-I mice. Numbers in plots indicate the percentage of cells in each quadrant. ***p<0.001; **p<0.01. Data are representative of three independent experiments and depict the mean±SD.

Figure 4 Lack of negative selection of thymocytes expressing J15 TCR in the presence of H60H. (A) Cytotoxicity assays (left) tested affinities of several different single-amino-acid variants of the H60 epitope by changing the amino acid asparagine (N) residue at P4 of the H60 epitope to different amino acids. The amino acid sequences of the normal H60 and H60H epitope (right), LTFNYRNL and LTFHYRNL, respectively. (B) CD4 by CD8 profiles (left) of thymocytes and numbers (right) of each thymic population from J15-H60H Tg, J15, and H60HTg mice on the B6 background. Numbers at the top of plots indicate the total number of thymocytes. (C) H60-tetramer binding of DN, DP, and CD8 SP thymocytes from J15-H60H Tg, J15, and H60HTg mice. (D) CD4 by CD8 profiles (left) of splenocytes and numbers (right) of CD4 and CD8 T cells in the spleen from J15-H60H Tg, J15, and H60HTg mice. (E) Surface expression of Vβ8.3 and the binding of the H60-tetramer of CD8 T cells in the spleen from J15-H60H Tg, J15, and H60HTg mice. Numbers in plots indicate the percentage of cells in each quadrant. **p< 0.01; *p<0.05; ns, non-significant. Data are representative of two independent experiments and depict the mean±SD.
Cited by 1 articles
-
Skewed Dendritic Cell Differentiation of MyD88-Deficient Donor Bone Marrow Cells, Instead of Massive Expansion as Myeloid-Derived Suppressor Cells, Aggravates GVHD
Young-Kwan Lee, Ji-Min Ju, Woo-Jeong Shon, Sehwa Oh, Chang-Ki Min, Myung-Soo Kang, Dong-Mi Shin, Eun Young Choi
Immune Netw. 2018;18(6):. doi: 10.4110/in.2018.18.e44.
Reference
-
1. Roopenian D, Choi EY, Brown A. The immunogenomics of minor histocompatibility antigens. Immunol Rev. 2002; 190:86–94. PMID: 12493008.
Article2. Choi EY, Yoshimura Y, Christianson GJ, Sproule TJ, Malarkannan S, Shastri N, Joyce S, Roopenian DC. Quantitative analysis of the immune response to mouse non-MHC transplantation antigens in vivo: the H60 histocompatibility antigen dominates over all others. J Immunol. 2001; 166:4370–4379. PMID: 11254691.3. Choi EY, Christianson GJ, Yoshimura Y, Jung N, Sproule TJ, Malarkannan S, Joyce S, Roopenian DC. Real-time T-cell profiling identifies H60 as a major minor histocompatibility antigen in murine graft-versus-host disease. Blood. 2002; 100:4259–4265. PMID: 12393464.
Article4. Choi JH, Ryu SJ, Jung KM, Kim S, Chang J, Kim TW, Choi EY. TCR diversity of H60-specific CD8 T cells during the response evolution and influence of CD4 help. Transplantation. 2009; 87:1609–1616. PMID: 19502951.
Article5. Ryu SJ, Jung KM, Yoo HS, Kim TW, Kim S, Chang J, Choi EY. Cognate CD4 help is essential for the reactivation and expansion of CD8 memory T cells directed against the hematopoietic cell-specific dominant minor histocompatibility antigen, H60. Blood. 2009; 113:4273–4280. PMID: 19139082.
Article6. Choi EY, Christianson GJ, Yoshimura Y, Sproule TJ, Jung N, Joyce S, Roopenian DC. Immunodominance of H60 is caused by an abnormally high precursor T cell pool directed against its unique minor histocompatibility antigen peptide. Immunity. 2002; 17:593–603. PMID: 12433366.
Article7. Malarkannan S, Shih PP, Eden PA, Horng T, Zuberi AR, Christianson G, Roopenian D, Shastri N. The molecular and functional characterization of a dominant minor H antigen, H60. J Immunol. 1998; 161:3501–3509. PMID: 9759870.8. Malarkannan S, Horng T, Eden P, Gonzalez F, Shih P, Brouwenstijn N, Klinge H, Christianson G, Roopenian D, Shastri N. Differences that matter: major cytotoxic T cell-stimulating minor histocompatibility antigens. Immunity. 2000; 13:333–344. PMID: 11021531.9. Jeon JY, Jung KM, Chang J, Choi EY. Characterization of CTL Clones Specific for Single Antigen, H60 Minor Histocompatibility Antigen. Immune Netw. 2011; 11:100–106. PMID: 21637387.
Article10. Russell PS, Chase CM, Madsen JC, Hirohashi T, Cornell LD, Sproule TJ, Colvin RB, Roopenian DC. Coronary artery disease from isolated non-H2-determined incompatibilities in transplanted mouse hearts. Transplantation. 2011; 91:847–852. PMID: 21378606.
Article11. Ryu SJ, Jeon JY, Chang J, Sproule TJ, Roopenian DC, Choi EY. A single-amino-acid variant of the H60 CD8 epitope generates specific immunity with diverse TCR recruitment. Mol Cells. 2012; 33:393–399. PMID: 22441676.
Article12. Kouskoff V, Signorelli K, Benoist C, Mathis D. Cassette vectors directing expression of T cell receptor genes in transgenic mice. J Immunol Methods. 1995; 180:273–280. PMID: 7714342.
Article13. Kim J, Ryu SJ, Oh K, Ju JM, Jeon JY, Nam G, Lee DS, Kim HR, Young Kim J, Chang J, Sproule T, Choi K, Roopenian D, Young CE. Memory programming in CD8(+) T-cell differentiation is intrinsic and is not determined by CD4 help. Nat Commun. 2015; 6:7994. PMID: 26272364.
Article14. Ehst BD, Ingulli E, Jenkins MK. Development of a novel transgenic mouse for the study of interactions between CD4 and CD8 T cells during graft rejection. Am J Transplant. 2003; 3:1355–1362. PMID: 14525595.
Article15. Barthlott T, Stockinger B. Lineage fate alteration of thymocytes developing in an MHC environment containing MHC/peptide ligands with antagonist properties. Eur J Immunol. 2001; 31:3595–3601. PMID: 11745379.16. Williams O, Tarazona R, Wack A, Harker N, Roderick K, Kioussis D. Interactions with multiple peptide ligands determine the fate of developing thymocytes. Proc Natl Acad Sci U S A. 1998; 95:5706–5711. PMID: 9576948.
Article17. Speir JA, Stevens J, Joly E, Butcher GW, Wilson IA. Two different, highly exposed, bulged structures for an unusually long peptide bound to rat MHC class I RT1-Aa. Immunity. 2001; 14:81–92. PMID: 11163232.
Article18. Apostolopoulos V, Yuriev E, Ramsland PA, Halton J, Osinski C, Li W, Plebanski M, Paulsen H, McKenzie IF. A glycopeptide in complex with MHC class I uses the GalNAc residue as an anchor. Proc Natl Acad Sci U S A. 2003; 100:15029–15034. PMID: 14657390.
Article19. Boesteanu A, Brehm M, Mylin LM, Christianson GJ, Tevethia SS, Roopenian DC, Joyce S. A molecular basis for how a single TCR interfaces multiple ligands. J Immunol. 1998; 161:4719–4727. PMID: 9794402.20. Anderson AC, Nicholson LB, Legge KL, Turchin V, Zaghouani H, Kuchroo VK. High frequency of autoreactive myelin proteolipid protein-specific T cells in the periphery of naive mice: mechanisms of selection of the self-reactive repertoire. J Exp Med. 2000; 191:761–770. PMID: 10704458.21. Klein L, Kyewski B, Allen PM, Hogquist KA. Positive and negative selection of the T cell repertoire:what thymocytes see (and don't see). Nat Rev Immunol. 2014; 14:377–391. PMID: 24830344.22. Starr TK, Jameson SC, Hogquist KA. Positive and negative selection of T cells. Annu Rev Immunol. 2003; 21:139–176. PMID: 12414722.
Article23. Sprent J, Kishimoto H. The thymus and negative selection. Immunol Rev. 2002; 185:126–135. PMID: 12190927.
Article24. Modigliani Y, Thomas-Vaslin V, Bandeira A, Coltey M, Le Douarin NM, Coutinho A, Salaun J. Lymphocytes selected in allogeneic thymic epithelium mediate dominant tolerance toward tissue grafts of the thymic epithelium haplotype. Proc Natl Acad Sci USA. 1995; 92:7555–7559. PMID: 7638230.
Article25. Mayerova D, Hogquist KA. Central tolerance to self-antigen expressed by cortical epithelial cells. J Immunol. 2004; 172:851–856. PMID: 14707055.
Article26. Goldman KP, Park CS, Kim M, Matzinger P, Anderson CC. Thymic cortical epithelium induces self tolerance. Eur J Immunol. 2005; 35:709–717. PMID: 15719367.
Article27. McCaughtry TM, Baldwin TA, Wilken MS, Hogquist KA. Clonal deletion of thymocytes can occur in the cortex with no involvement of the medulla. J Exp Med. 2008; 205:2575–2584. PMID: 18936237.
Article28. Baldwin TA, Sandau MM, Jameson SC, Hogquist KA. The timing of TCR alpha expression critically influences T cell development and selection. J Exp Med. 2005; 20:111–121. PMID: 15998791.
- Full Text Links
-
- Actions
-
Cited
- CITED
-
- Close
- Share
-
- Similar articles
-
- Characterization of CTL Clones Specific for Single Antigen, H60 Minor Histocompatibility Antigen
- Role for CD40 and CD40L Expression in Generating CD8 T Cell Response to Minor Histcompatibility Antigen, H60
- Subdominant H60 antigen-specific CD8 T-cell response precedes dominant H4 antigen-specific response during the initial phase of allogenic skin graft rejection
- Requirement of CD4 Help for Induction of CD8 T Cell Response Specific for Virally Derived H60
- T Cell Receptor Signaling That Regulates the Development of Intrathymic Natural Regulatory T Cells
