Early Experience of Pre- and Post-Contrast 7.0T MRI in Brain Tumors
- Affiliations
-
- 1Department of Neurosurgery, Seoul National University Hospital, Seoul, Korea.
- 2Department of Neurosurgery, Physiology, and Biomedical Engineering, Mayo Clinic, Mineapolis, MN, USA.
- 3Cancer Research Institute, Seoul National University College of Medicine, Seoul, Korea.
- 4Ischemic/Hypoxic Disease Institute, Seoul National University College of Medicine, Seoul, Korea.
- 5Department of Radiology, Seoul National University Hospital, Seoul, Korea.
- 6Neuroscience Research Institute, Gachon University of Medicine and Science, Incheon, Korea. zcho@gachon.ac.kr
- KMID: 1793054
- DOI: http://doi.org/10.3346/jkms.2013.28.9.1362
Abstract
- We investigated the safety and clinical applicability of 7.0 Tesla (T) brain magnetic resonance imaging (MRI) in patients with brain tumors. Twenty-four patients with intraaxial or extraaxial brain tumors were enrolled in this study. 7.0T MRIs of T2*-weighted axial and T1-weighted coronal or sagittal images were obtained and compared with 1.5T brain MRIs. The T2*-weighted images from 7.0T brain MRI revealed detailed microvasculature and the internal contents of supratentorial brain tumors better than that of 1.5T brain MRI. For brain tumors located in parasellar areas or areas adjacent to major cerebral vessels, flow-related artifacts were exaggerated in the 7.0T brain MRIs. For brain tumors adjacent to the skull base, susceptibility artifacts in the interfacing areas of the paranasal sinus and skull base hampered the aquisition of detailed images and information on brain tumors in the 7.0T brain MRIs. This study shows that 7.0T brain MRI can provide detailed information on the intratumoral components and margins in supratentorial brain tumors. Further studies are needed to develop refined MRI protocols for better images of brain tumors located in the skull base, parasellar, and adjacent major cerebrovascular structures.
MeSH Terms
Figure
-
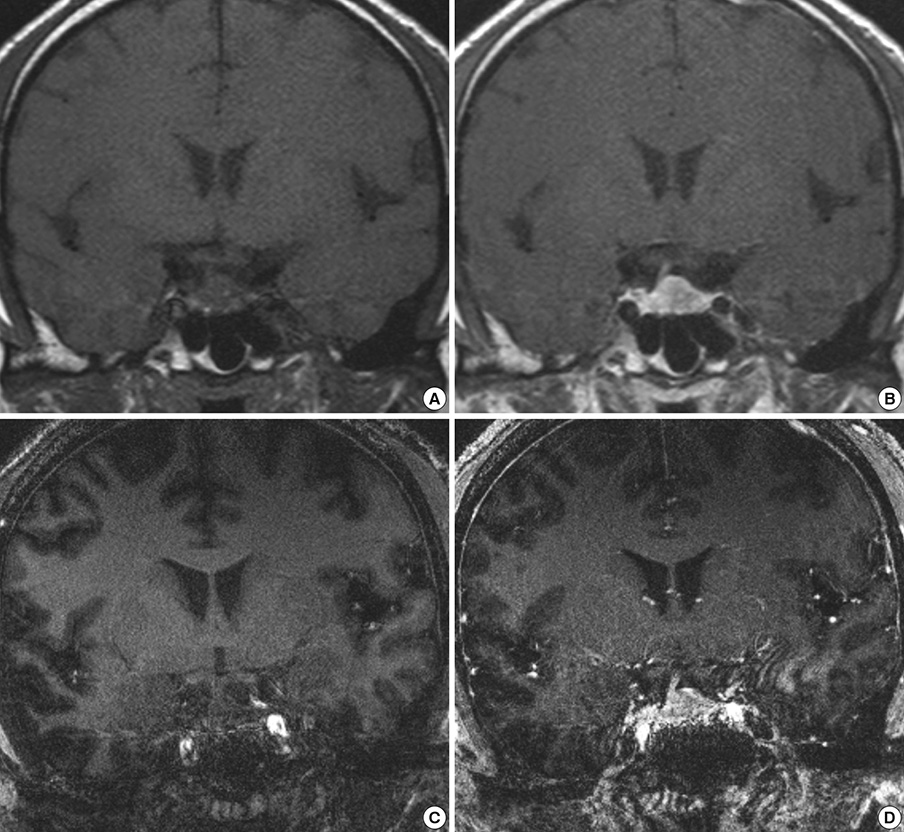
Fig. 1 1.5T and 7.0T MRI for pituitary adenoma. The pre- and post-contrast T1-weighted coronal images from 1.5T (A, B) and 7.0T brain MRI (C, D) in a patient with pituitary adenoma (Patient Number 3 in Table 2). Precontrast (A) and postcontrast (B) T1-weighted sellar images from 1.5T brain MRI show a well-enhancing intrasellar mass lesion located on the left side of the sellar turcica with a deviated pituitary stalk to the right side. In contrast, the precontrast (C) and postcontrast (D) T1-weighted sellar images from 7.0T brain MRI do not provide a clear margin of the sellar mass lesion and its margin with the adjacent neurovascular structures in the left cavernous sinus. The flow related artifacts of both internal carotid arteries (ICAs) in the cavernous sinus as well as the susceptibility artifacts coming from the interface of the air-density area of the paranasal sinus and bony structures of skull base are noticeable around the surrounding structures of the pituitary adenoma.
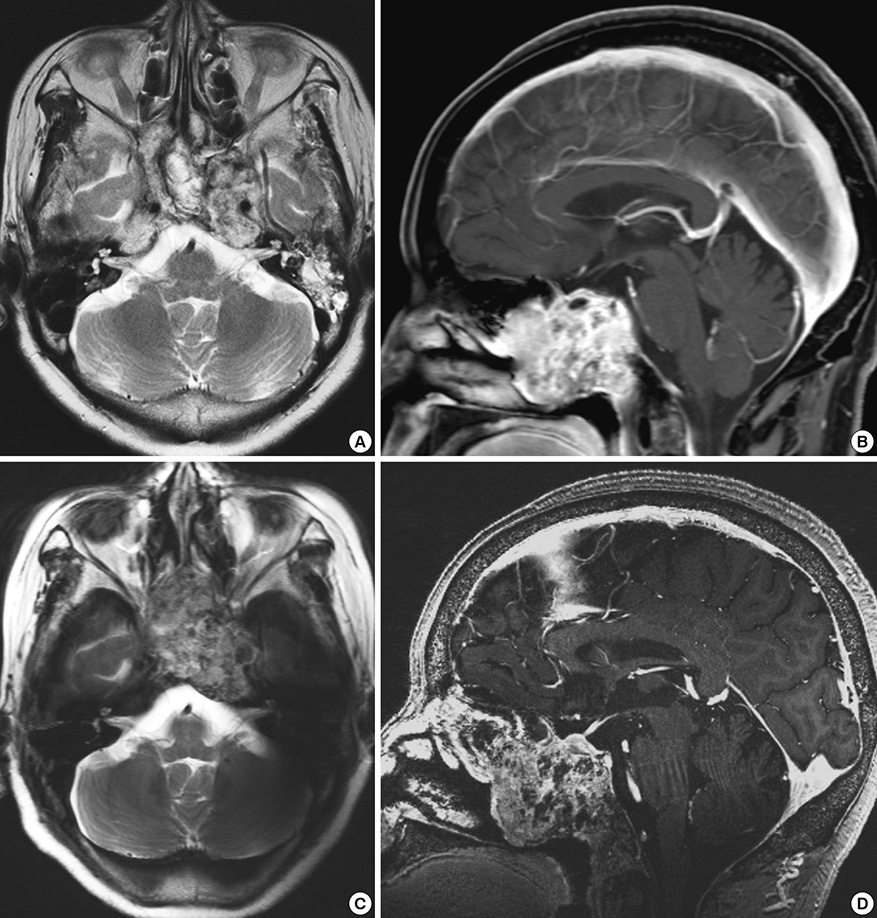
Fig. 2 1.5T and 7.0T MRI for chordoma. The T2-weighted axial and contrast-enhancing T1-weighted sagittal images from 1.5T (A, B) and 7T brain MRI (C, D) in a patient with a chordoma (Patient Number 22 in Table 2). T2-weighted axial (A) and postcontrast (B) T1-weighted sagittal images from 1.5T brain MRI show an irregularly enhancing multi-loculated mass lesion located in the clivus extending into the sphenoid sinus. In contrast, T2-weighted axial (C) and postcontrast (D) T1-weighted sagittal images from 7.0T brain MRI do not provide a clear margin between the sellar mass lesion and the adjacent neurovascular structures in the skull base area. The flow related artifacts of both ICAs in the cavernous sinus as well as the susceptibility artifacts coming from the interface of the air-density area of the paranasal sinus and bony structures of skull base are noticeable around the surrounding structures of the chordoma.
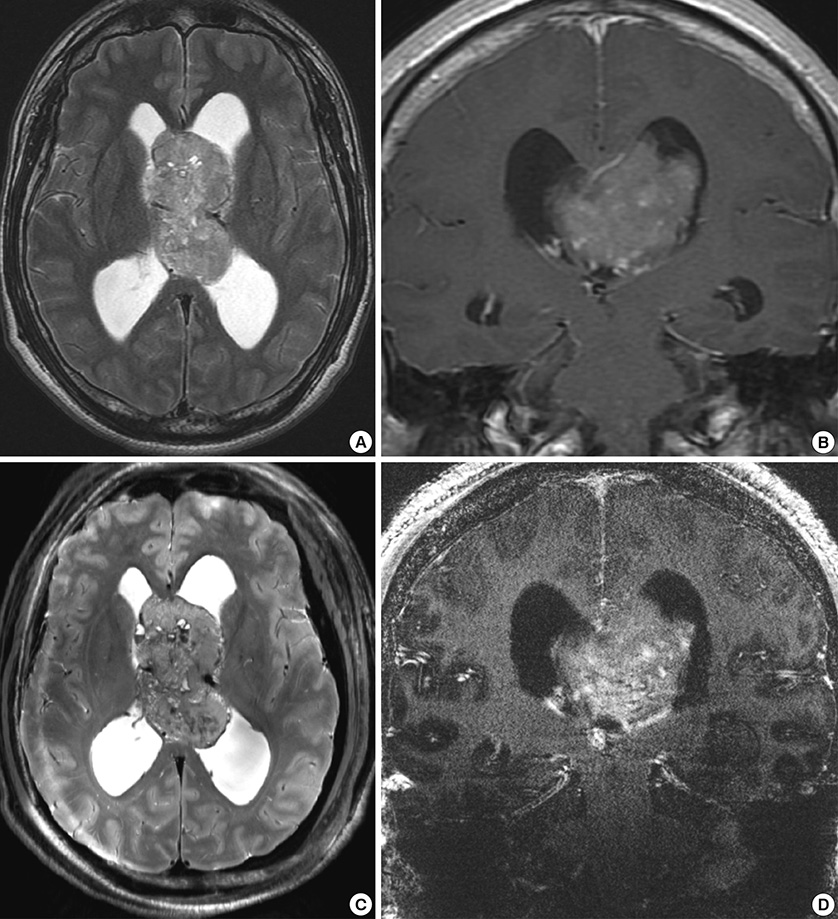
Fig. 3 1.5T and 7.0T MRI for central neurocytoma. T2-weighted axial and post-contrast T1-weighted coronal images from 1.5T brain MRI (A, B) and T2-weighted axial and post-contrast T1-weighted coronal images from 7.0T brain MRI (C, D) in a patient with a central neurocytoma (Patient Number 7 in Table 2). A T2-weighted image from 1.5T brain MRI (A) shows the vascularity of the brain tumor & draining veins on the surface of the tumor located in the central portion of the lateral ventricles. Post-contrast coronal images from 1.5T brain MRI (B) demonstrate an intraventricular enhancing mass lesion mainly located in the left lateral ventricle extending into the right lateral ventricle. In contrast to the 1.5T MRI, T2 axial images from 7.0T brain MRI (C) show a clearer image of the tumor margin between the tumor and its surrounding structures and the interface with the thalamo-caudate nucleus. A post-contrast T1-weighted coronal image from 7.0T brain MRI (D) shows better contrast between the white and gray matter in the cortical brain surface in contrast to the 1.5T brain MRI. However, the flow from the deep draining veins of the internal cerebral veins and both transverse sinuses results in linear artifacts crossing over the midline in the post-contrast T1-weighted coronal images from 7.0T brain MRI. In addition, chemical shift artifacts caused by the interface between the cerebellar hemisphere and petrous bone hampers the signal-to-noise ratio of the post-contrast T1-weighted coronal image from 7T brain MRI.
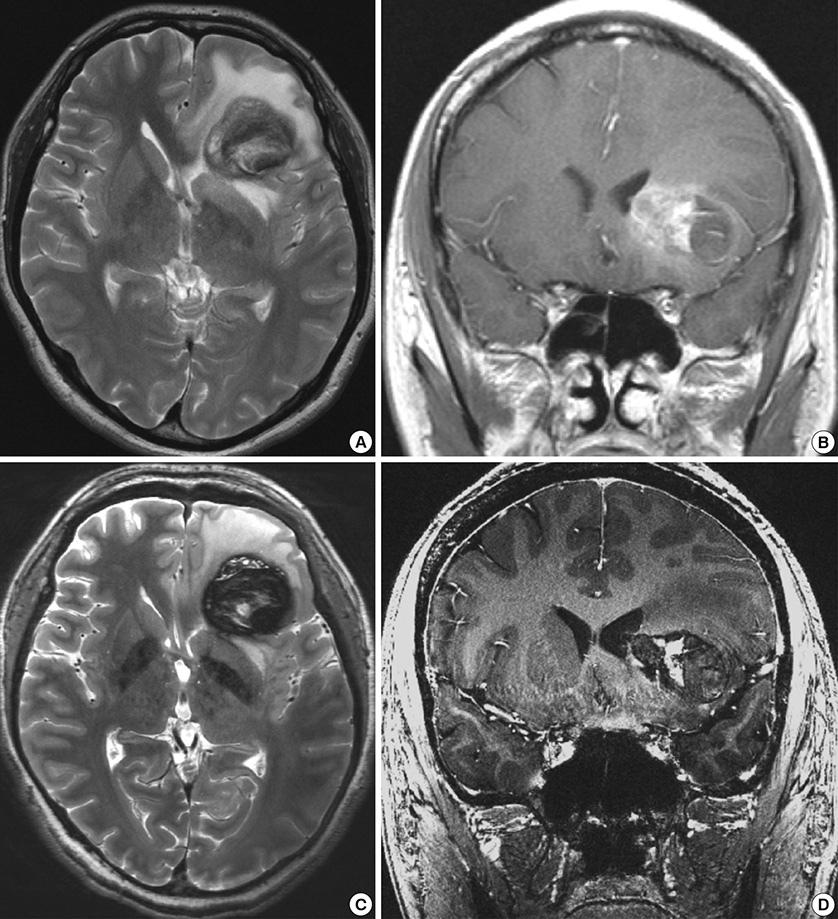
Fig. 4 1.5T and 7.0T MRI for cavernous hemangioma. T2-weighted axial and post-contrast T1-weighted coronal images from 1.5T brain MRI (A, B) and T2-weighted axial and post-contrast T1-weighted coronal images from 7.0T brain MRI (C, D) in a patient with a cavernous hemangioma (Patient Number 20 in Table 2). Compared to the T2-weighted axial image from 1.5T brain MRI (A), the hemorrhagic contents in different stages of the cavernous hemangioma are more clearly visualized in the T2-weighted axial images from the 7T brain MRI (C). Compared to the 1.5T brain MRI (B), the post-contrast T1-weighted coronal images from the 7.0T brain MRI (D) show a sharper margin between the white matter and cavernous hemangioma in the brain parenchyma. However, the flow from both the middle cerebral arteries causes flow-related linear artifact crossing over the midline in the post-contrast T1-weighted coronal images from the 7T brain MRI (D).
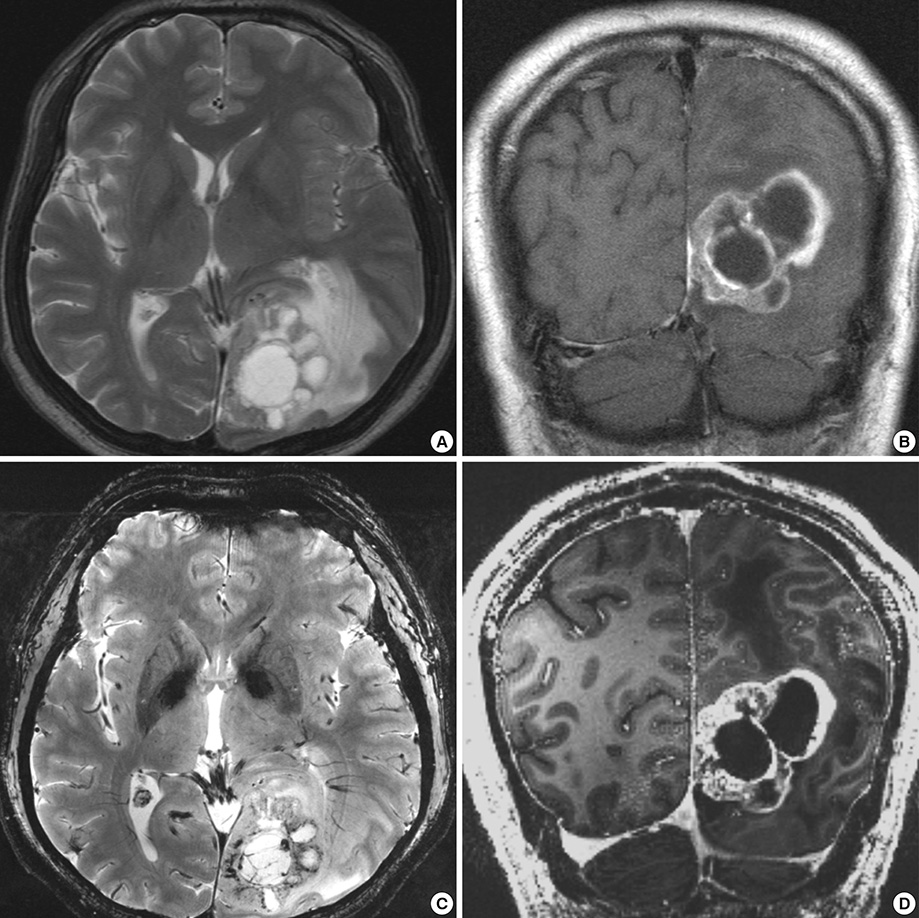
Fig. 5 1.5T and 7.0T MRI for metastatic brain tumor of non-small cell lung carcinoma. T2-weighted axial and post-contrast T1-weighted coronal images from 1.5T brain MRI (A, B) and T2*-weighted axial and post-contrast T1-weighted coronal images from 7.0T brain MRI (C, D) in a patient with a metastatic brain tumor of non-small cell lung carcinoma (Patient Number 23 in Table 2). Compared to the 1.5T brain MRI (A), the T2*-weighted axial images from the 7.0T brain MRI (C) show a clearer image of the tumor margin between the tumor and its surrounding white matter fiber projections such as left optic radiation. Compared to the 1.5T brain MRI (B), the post-contrast T1-weighted coronal images from the 7.0T brain MRI (D) show sharply demarcated enhancing tumor lesions with distinct margins from the normal white matter.
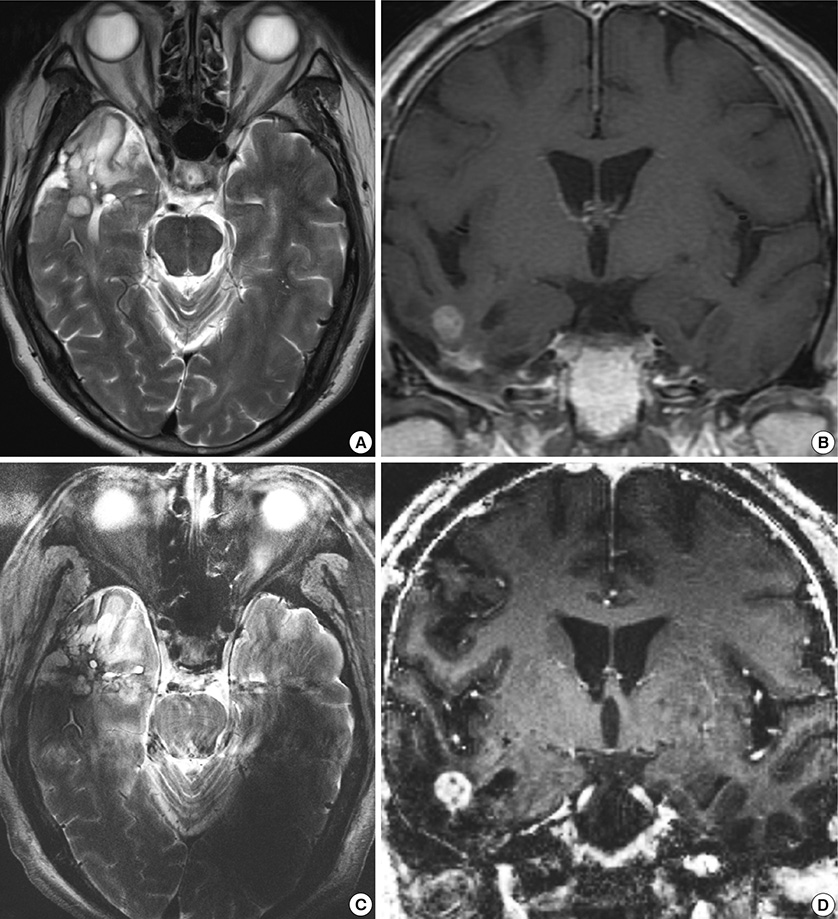
Fig. 6 1.5T and 7.0T MRI for glioblastoma. T2-weighted axial and post-contrast T1-weighted coronal images from 1.5T brain MRI (A, B) and T2-weighted axial and post-contrast T1-weighted coronal images from 7.0T brain MRI (C, D) in a patient with a glioblastoma (Patient Number 8 in Table 2). Compared to the T2-weighted axial images from the 1.5T brain MRI (A), the flow related artifacts caused by the posterior circulation arteries such as the basilar artery, superior cerebellar artery, or posterior cerebral artery are exaggerated crossing over the midline in the T2-weighted axial image from the 7.0T brain MRI (C). The post-contrast T1-weighted coronal images from the 1.5T (B) and 7.0T (D) brain MRI show a small enhancing nodule of recurrent glioblastoma in the right temporal lobe.
Cited by 1 articles
-
Comparison of 3 and 7 Tesla Magnetic Resonance Imaging of Obstructive Hydrocephalus Caused by Tectal Glioma
Hyeong Cheol Moon, Hyeon-Man Baek, Young Seok Park
Brain Tumor Res Treat. 2016;4(2):150-154. doi: 10.14791/btrt.2016.4.2.150.
Reference
-
1. Van der Kolk AG, Hendrikse J, Zwanenburg JJ, Visser F, Luijten PR. Clinical applications of 7 T MRI in the brain. Eur J Radiol. 2013; 82:708–718.2. Lupo JM, Banerjee S, Hammond KE, Kelley DA, Xu D, Chang SM, Vigneron DB, Majumdar S, Nelson SJ. GRAPPA-based susceptibility-weighted imaging of normal volunteers and patients with brain tumor at 7 T. Magn Reson Imaging. 2009; 27:480–488.3. Moenninghoff C, Maderwald S, Theysohn JM, Kraff O, Ladd ME, El Hindy N, van de Nes J, Forsting M, Wanke I. Imaging of adult astrocytic brain tumours with 7 T MRI: preliminary results. Eur Radiol. 2010; 20:704–713.4. Pinker K, Noebauer-Huhmann IM, Stavrou I, Hoeftberger R, Szomolanyi P, Weber M, Stadlbauer A, Grabner G, Knosp E, Trattnig S. High-field, high-resolution, susceptibility-weighted magnetic resonance imaging: improved image quality by addition of contrast agent and higher field strength in patients with brain tumors. Neuroradiology. 2008; 50:9–16.5. Strzhizhovskĭ AD, Galaktionova GV. Proliferation of bone marrow cells upon exposure to constant magnetic fields of ultra-high strength. Tsitologiia. 1978; 20:717–720.6. Zmyślony M, Aniołczyk H, Bortkiewicz A. Exposure to VHF and UHF electromagnetic fields among workers employed in radio and TV broadcast centers: I. assessment of exposure. Med Pr. 2001; 52:321–327.7. Kangarlu A, Burgess RE, Zhu H, Nakayama T, Hamlin RL, Abduljalil AM, Robitaille PM. Cognitive, cardiac, and physiological safety studies in ultra high field magnetic resonance imaging. Magn Reson Imaging. 1999; 17:1407–1416.8. Shrivastava D, Abosch A, Hanson T, Tian J, Gupte A, Iaizzo PA, Vaughan JT. Effect of the extracranial deep brain stimulation lead on radiofrequency heating at 9.4 Tesla (400.2 MHz). J Magn Reson Imaging. 2010; 32:600–607.9. Mansfield P, Bowley RM, Haywood B. Controlled E-field gradient coils. MAGMA. 2003; 16:113–120.10. Louis DN, Ohgaki H, Wiestler OD, Cavenee WK, Burger PC, Jouvet A, Scheithauer BW, Kleihues P. The 2007 WHO classification of tumours of the central nervous system. Acta Neuropathol. 2007; 114:97–109.11. Yuh WT, Christoforidis GA, Koch RM, Sammet S, Schmalbrock P, Yang M, Knopp MV. Clinical magnetic resonance imaging of brain tumors at ultrahigh field: a state-of-the-art review. Top Magn Reson Imaging. 2006; 17:53–61.12. Dashner RA, Kangarlu A, Clark DL, RayChaudhury A, Chakeres DW. Limits of 8-Tesla magnetic resonance imaging spatial resolution of the deoxygenated cerebral microvasculature. J Magn Reson Imaging. 2004; 19:303–307.13. Christoforidis GA, Grecula JC, Newton HB, Kangarlu A, Abduljalil AM, Schmalbrock P, Chakeres DW. Visualization of microvascularity in glioblastoma multiforme with 8-T high-spatial-resolution MR imaging. AJNR Am J Neuroradiol. 2002; 23:1553–1556.14. Abduljalil AM, Kangarlu A, Yu Y, Robitaille PM. Macroscopic susceptibility in ultra high field MRI: II: acquisition of spin echo images from the human head. J Comput Assist Tomogr. 1999; 23:842–844.15. Burgess RE, Yu Y, Christoforidis GA, Bourekas EC, Chakeres DW, Spigos D, Kangarlu A, Abduljalil AM, Robitaille PM. Human leptomeningeal and cortical vascular anatomy of the cerebral cortex at 8 Tesla. J Comput Assist Tomogr. 1999; 23:850–856.16. Vaughan JT, Garwood M, Collins CM, Liu W, DelaBarre L, Adriany G, Andersen P, Merkle H, Goebel R, Smith MB, et al. 7T vs. 4T: RF power, homogeneity, and signal-to-noise comparison in head images. Magn Reson Med. 2001; 46:24–30.17. Folkman J. Angiogenesis in cancer, vascular, rheumatoid and other disease. Nat Med. 1995; 1:27–31.18. Abramovitch R, Meir G, Neeman M. Neovascularization induced growth of implanted C6 glioma multicellular spheroids: magnetic resonance microimaging. Cancer Res. 1995; 55:1956–1962.19. Kleihues P, Louis DN, Scheithauer BW, Rorke LB, Reifenberger G, Burger PC, Cavenee WK. The WHO classification of tumors of the nervous system. J Neuropathol Exp Neurol. 2002; 61:215–225.20. Brem S, Cotran R, Folkman J. Tumor angiogenesis: a quantitative method for histologic grading. J Natl Cancer Inst. 1972; 48:347–356.21. Cho ZH, Kang CK, Han JY, Kim SH, Kim KN, Hong SM, Park CW, Kim YB. Observation of the lenticulostriate arteries in the human brain in vivo using 7.0T MR angiography. Stroke. 2008; 39:1604–1606.
- Full Text Links
-
- Actions
-
Cited
- CITED
-
- Close
- Share
-
- Similar articles
-
- A Case Report of Preoperative and Postoperative 7.0T Brain MRI in a Patient with a Small Cell Glioblastoma
- Contrast-enhanced Magnetic Resonance Imaging of Brain Metastases at 7.0T versus 1.5T: A Preliminary Result
- Abbreviated Breast Magnetic Resonance Imaging: Background, Evidence From Studies, and Future Considerations
- Review of Recent Advancement of Ultra High Field Magnetic Resonance Imaging: from Anatomy to Tractography
- Delayed Effect of Contrast Enhancement in Brain Tumors on MRI
