Review of Recent Advancement of Ultra High Field Magnetic Resonance Imaging: from Anatomy to Tractography
- Affiliations
-
- 1Advanced Institute of Convergence Technology, Seoul National University, Suwon, Korea. zcho1@snu.ac.kr
- KMID: 2354794
- DOI: http://doi.org/10.13104/imri.2016.20.3.141
Abstract
- PURPOSE
Advances of magnetic resonance imaging (MRI), especially that of the Ultra-High Field (UHF) MRI will be reviewed.
MATERIALS AND METHODS
Diffusion MRI data was obtained from a healthy adult young male of age 30 using a 7.0T research MRI scanner (Magnetom, Siemens) with 40 mT/m maximum gradient field. The specific imaging parameters used for the data acquisition were a single shot DW echo planar imaging.
RESULTS
Three areas of the imaging experiments are focused on for the study, namely the anatomy, angiography, and tractography.
CONCLUSION
It is envisioned that, in near future, there will be more 7.0T MRIs for brain research and explosive clinical application research will also be developed, for example in the area of connectomics in neuroscience and clinical neurology and neurosurgery.
Keyword
MeSH Terms
Figure
-
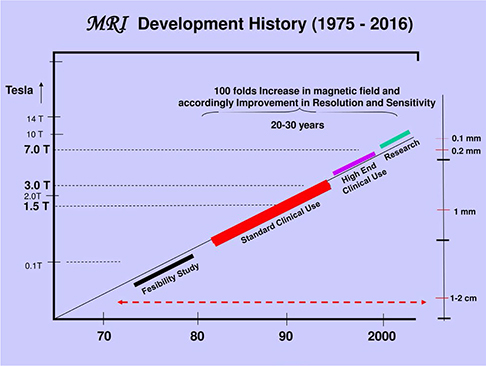
Fig. 1 History of MRI development. MR imaging actually started as early as mid-1970 after the first MRI concept was introduced in 1973. Most of the early MRI magnets were the resistive types and field strength was less than 1-1.5 K Gauss. Only after the 80's superconducting magnets were introduced and field strengths were 1.0-2.0 Tesla (T). Most of the commercial products were, however, centered around 1.5T and 1.5T was more or less the standard super conducting MRI till mid 90's. Since mid-90's 3.0T MRI began to appear, but performance was minimal and users responses were not very enthusiastic. 7.0T magnet became available since the early 2000 and early 7.0T MRI research types began to be in operation at Harvard, NIH, Magdeburg in Germany, and Gachon NRI in Korea. As of today, 2016, nearly 70-80 7.0T units are in operation at various research centers of the world.
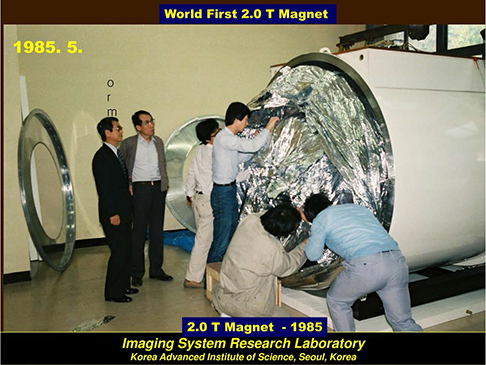
Fig. 2 One of the first 2.0T magnets were installed at Korea Advanced Institute of Science (now KAIST) for research. This is one of the historical event and start producing numerous high resolution anatomical images much superior than the low field resistive MRI of 1.0 K Gauss or 0.1T and opened superconducting MRI era and it remained till beginning of 2000.
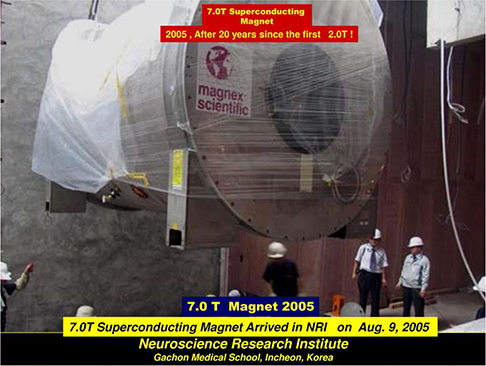
Fig. 3 One of the first 7.0T magnets were installed at Neuroscience Research Institute of Gachon University in Korea in 2005. This prototype required an extensive shielding to protect magnetic field radiation to the external surroundings. Nearly 500 tons of iron sheets were used for the shielding at the time. Today, new self-shielded types became available, therefore, no longer such an expensive and elaborate shielding is necessary.

Fig. 4 Various RF (radiofrequency) coils of different types are displayed. In UHF (ultra-high field) MRI such as 7.0T MRI, wave length of the RF is very short (like 20 cm only), therefore, severe non-uniformity arises within the object, like head. One of the major difficulties were, therefore, development of the suitable and efficient RF coil suitable for the each experiment which is particularly difficult at the time due to the increased frequency at 7.0T often destroys the field uniformity as well as RF excitation uniformity. The later could affect the local overdose of RF radiation to the patients or subject under study, therefore, requires utmost care since it could result in danger to the subjects or patients.
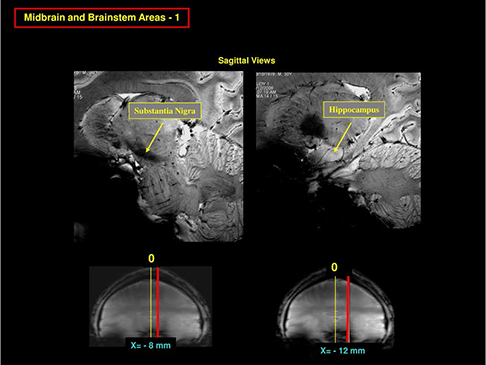
Fig. 5 7.0T MRI began to reveal many ultra-high resolution anatomical images such as the fine details of the brainstem structures by T2 weighted imaging. In this figure, two most exciting sagittal view images of the brainstem areas are shown. First, in the left, a sagittal slice at x = -8 mm, we can see clearly the substantia nigra as well as many brainstem structures such as the corticospinal tracts in the pons and other thalamic structures in the diencephalon. In the right, we see the fine structure of the hippocampus and amygdala and the surroundings.

Fig. 6 This image is an expanded view image of the left side of image shown in Figure 5 where substantia nigra is. As seen, one can identify from the upper left by counter clock wise; corpus callosum, the thalamus, anterior commissure, nucleus accumbens, ventral tegmental area, substantia nigra, subthalamic nucleus and fornix. In the pons, we can also clearly see the corticospinal tracts and in the low right, we see the entire cerebellum.
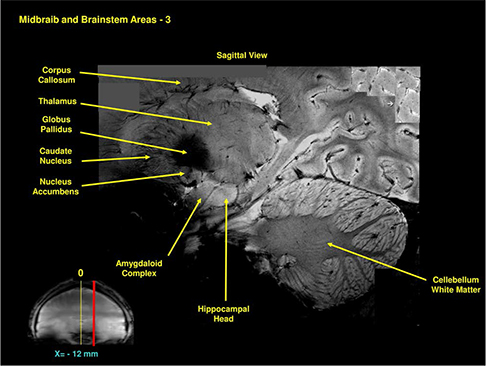
Fig. 7 This is the expanded image of the right side in Figure 5 showing the details of the hippocampus. As seen, we see remarkably clear delineation of the entire hippocampal structure together with the amygdala right adjacent to the head of the hippocampus. Again we can see the thalamus and most part of the basal ganglia.
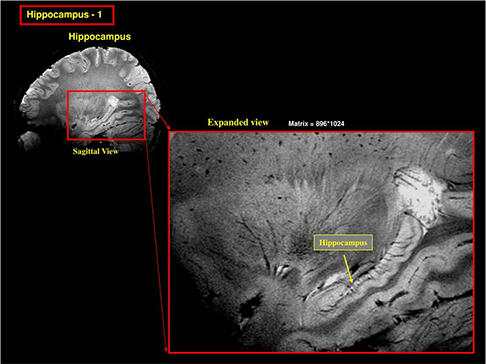
Fig. 8 This is another image of the hippocampus showing the details of the dentate gyrus and surroundings in a sagittal view. In the low side of the hippocampal proper, a parallel and continuous contact of the cingulum along the body of hippocampus is seen.

Fig. 9 This image is the most typical hippocampal image seen in a coronal view. As it is shown, we can see clearly most of the sub-components of the hippocampal proper near the head of the hippocampus. Familiar CA1, CA2 etc. can be clearly seen together with the surrounding parahippocampal cortices such as the subiculum, part of the entorhinal cortex, as well as the fusiform area (FFA). This hippocampal image is certainly one of the finest form ever obtained for in-vivo human brain imaging in the field of in-vivo human brain imaging with MRI.

Fig. 10 As we move more to the clinical arena, such as substantia nigra is interesting due to the fact that substantia nigra is heavily involved in Parkinson's disease as well as other movement disorders. In this figure both sagittal and an axial view images are displayed to demonstrate the relative location of the area which contains the substantia nigra. In the axial view image shown in the right of the image clearly visualized the area of substantia nigra with crus cerebri surrounding the substantia nigra in a smooth arch. We will see how this smooth arch is destroyed in the case of Parkinson's disease.
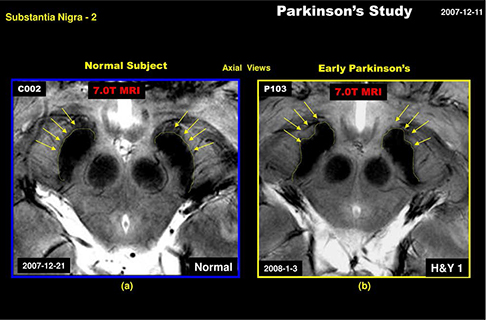
Fig. 11 In this figure, we have displayed two images containing the substantia nigra in an axial view. In the left the substantia nigra area of a healthy normal subject is displayed while in the right, a Parkinson's patient is shown. As seen, the crus cerebri, the surrounding fiber bundles of the substantia nigra, are severely degradated from the original clean arch form due to the damage of the substantia nigra proper. Considering the fact the patient is known to be the early Parkinson's (H&Y1), it is interesting to know how the damage of substantia nigra initiated or influenced the surrounding fiber bundles, the crus cerebri. This study leads to physicians that the Parkinson's disease can now be detected directly which otherwise difficult in the past with low field MRI.
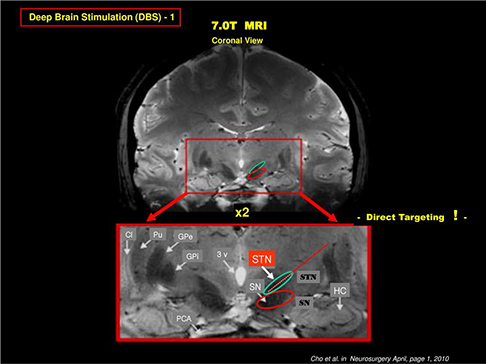
Fig. 12 As we know that there is an alternative to the drug administration in treatment of Parkinson's and other movement disorders, the deep brain stimulation (DBS), known for years and now widely practiced and considered as an important new option, especially for the cases of drug resistant patients. The target for the DBS treatment or the electrode insertion point is the gray matter located bellow the thalamus deep inside the brain. Targeting and location of this gray matter, known as the subthalamic nucleus (STN), is not easy with conventional low field MRI and used only for the relative estimate of the STN and often need an additional tool to identify or confirmation of the position of the STN, for instance using such as MER (Micro Electrode Recording). As shown, this target, the STN can be directly localized or visualized by 7.0T MRI as shown in the image. STN is located right above the substantia nigra (SN) and is clearly visible. This allows physician to perform "Direct Targeting" and appears to be the most promising new technique that can be achieved by using 7.0T MRI.
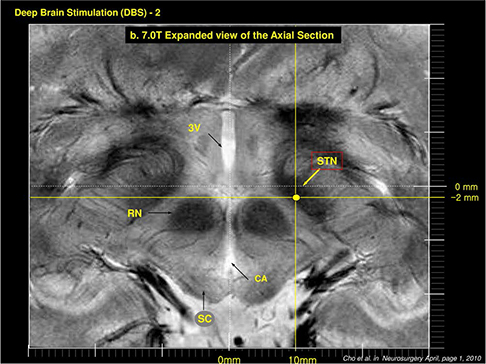
Fig. 13 This axial view image with STN location identified from the first STN location of the coronal section of STN clearly indicates the target point for DBS electrode location in axial view. Obviously this can be extended to sagittal view as well such that 3 dimensionally well identified target point can be selected with sub-millimeter precision. It should be noted that the precise targeting and location of the stimulating electrode is the key requirement for scientifically reproducible experiments, especially in this early stage of DBS research which requires understanding of the mechanisms involved and exploration of the neural function behind the DBS mechanisms.
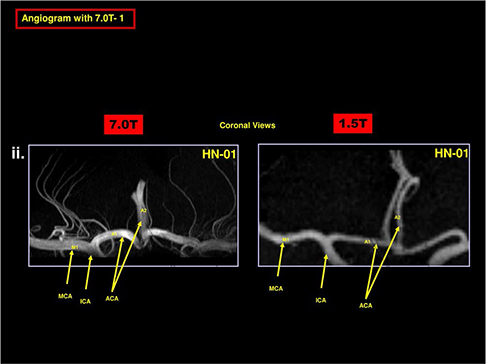
Fig. 14 Angiography with UHF MRI is another well-known technique which has an obvious advantage, that is the increase of T1 value as field increases. In the time of flight angiography, imaging slice is repeatedly activated, therefore, saturated while the new blood flow to the slice, the inflow blood, is not saturated, therefore, the blood to tissue contrast is increased substantially. This advantage is one of the most important and advantageous point of the UHF MRI in angiography. In this figure, a comparison of the UHF MR angiography is shown together with the low conventional low field MR angiography with 1.5T. As shown, the small vessel angiography with low field MRI completely lost all the small vessels in the region where the lenticulostriate arteries should be while we can see all the small vessels in the 7.0T MR angiography. Note here that these angiography are performed without contrast agent. This technique, therefore, appears to be a useful technique in early diagnosis of the strokes of various types.
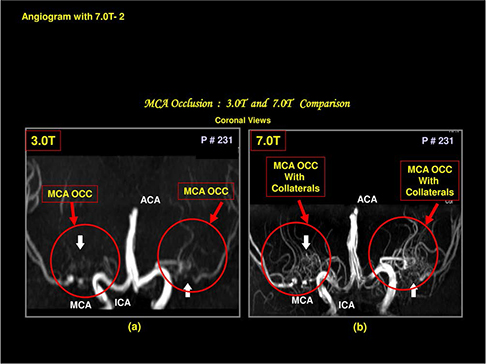
Fig. 15 Another example which demonstrating the advantages of the UHF MRI in angiography is shown. In the left, a conventional time of flight angiography with 3.0T MRI is shown for a patient with middle cerebral artery (MCA) occlusion. As seen, MCA is completely occluded and appears as a severe MCA occlusion. In the right, same patient with 7.0T MR angiography where many small collaterals are visible explaining why this patient is still survived and functions normally. It should be noted that with 3.0T MR angiography alone, diagnosis of this patient would be, at best, confusion or requires another study with contrast agents either by X-ray or MR angiography.
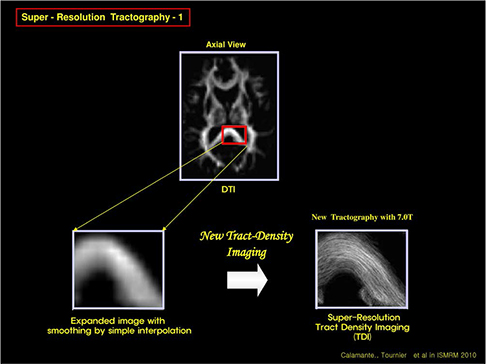
Fig. 16 One of the most exciting new development with UHF MRI is the tractography. Due to the increased signal to noise ratio and high statics, it is now possible to make resolution better, that is the voxel size can be made small, in turn, this provide us means to eliminate much disturbed fiber tract "crossing" and "kissings" thereby one can improve the resolution. In this figure an example of the improvement in resolution of the new tractography with 7.0T is demonstrated. In the upper part, a conventional tractography with diffusion tensor imaging of an axial view image is displayed. When a portion of the corpus callosum of the posterior part is displayed in the low left side, with smoothing with interpolation, it appears as shown in the left side. With 7.0T MRI and new tract density imaging technique, one can improve the image quality substantially as shown in the low right side of the image. This new tractography allows us many new developments including new "Connectomics" much discussed now days.
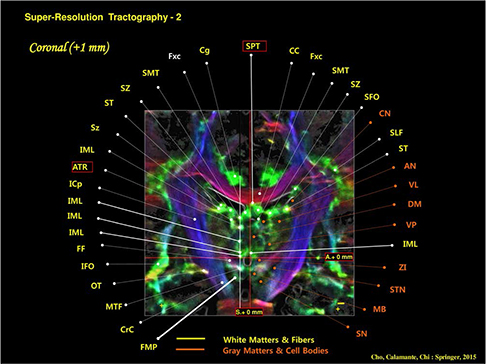
Fig. 17 In this figure, one of the examples of the new tractography obtained from the 7.0T MRI with TDI image processing is displayed. With this high resolution tractography, it is now possible to assign most of the fine and small tracts even such as the anterior thalamic radiation (ATR) as shown in the tract assignment at the left side of figure.

Fig. 18 A comparison with the previously attempted classification of the various fiber tracts with new 7.0T MR tractography is shown. For example, one of the important tracts was the superior longitudinal fasciculus (SLF). Although this tract is important and required further scrutiny, it has been delayed until now due to the resolution limits of the existing MR tractography, mainly by the low field MRI. In the left side, one of the most pioneering attempt to further classify the SLF into sub-division with low field MRI which has been attempted by Makris et al. is shown. In this image (coronal view), four divided SLF subdivisions are indicated, such as SLF I, II, III, and AF (Arcuate Fasciculus). Although it is largely correct, quantitative analysis was difficult. In the right, the new 7.0T MR tractography is shown for comparison. We will describe in the following a few examples of SLF sub-divisions with the new 7.0T MR tractography.

Fig. 19 Further analysis of the SLF by the new 7.0T MR tractography is shown in this figure. As seen, when the SLF points shown in the coronal view are displayed in sagittal view images, that is it is now possible to show each corresponding sagittal slice as shown in the circular form surrounding the coronal view image at the middle-left. As seen, it is now possible to analyze quantitatively how each tract is distributed and branched out and directed to different cortical and subcortical areas. For example, the slice at lateral most side at x = -4.0 cm, large number of red spots are visible which originated from the slices more medially located and eventually directed toward the cortical surfaces, for example many well-known Brodmann's areas such as the prefrontal cortex or Broca's area while many medially located slices such as the slice at x = -3.0 cm has mostly connected to the prefrontal areas, like Brodmann's areas BA9, 10, and 11. These high resolution neurotractography are and will be the most powerful tools of the future neuroscience research and brain research projects such as the "Connectomics" much discussed today in the field of neuroscience.

Fig. 20 As we have learned, progresses of MRI in the last three decades were remarkable and future will be similar if not identical. As we enter 21st century, we have had one of the most remarkable progresses with UHF MRI such as the 7.0T MRI with which one can see-through the human brain in-vivo with such a details it is now possible to locate many fine cortical structures hitherto remained as a mystery, such as the substructures of the hippocampus as well as the SLF sub-divisions. In the right most columns, several future progresses expected with further developments of the MRI, especially in the field of UHF and EHF (Extreme High Field) MRI such as 14T. Further improvement in MRI with field strength beyond 7.0T is coming slowly but soon a number of world centers will be equipped with UHF MRI beyond the 7.0T. Application areas will also rapidly expand beyond the simple anatomy to angiography but to the field such as the ultra-high resolution tractography which has much prospect in many modern diseases and disorders such as psychiatric and non-movement disorders, not to mention the future "Connectomics".
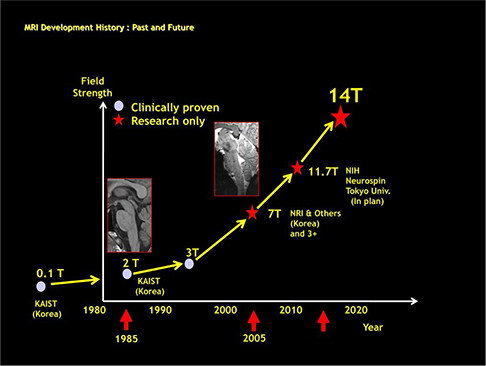
Fig. 21 Lastly, historical development is shown with a drawing starting from the early development of the low field resistive 0.1T magnet MRI to the 7.0T MRI and beyond such as the 11.7T and 14T. Author is convinced that there will be 14T MRI in near future demonstrating the many unknown MRI power hitherto unseen and even imagined. Science progresses without limits and once Einstein said that "Great thought begin with seeing something differently", that is with increasing resolution and contrast, we not only see more but also different aspect of the same subject which otherwise not possible.
Cited by 2 articles
-
Advanced Sectioned Images of a Cadaver Head with Voxel Size of 0.04 mm
Beom Sun Chung, Miran Han, Donghwan Har, Jin Seo Park
J Korean Med Sci. 2019;34(34):. doi: 10.3346/jkms.2019.34.e218.Simultaneous Unwrapping Phase and Error Recovery from Inhomogeneity (SUPER) for Quantitative Susceptibility Mapping of the Human Brain
Young-Joong Yang, Jong-Hyun Yoon, Hyun-Man Baek, Chang-Beom Ahn
Investig Magn Reson Imaging. 2018;22(1):37-49. doi: 10.13104/imri.2018.22.1.37.
Reference
-
1. Hinshaw WS, Bottomley PA, Holland GN. Radiographic thin-section image of the human wrist by nuclear magnetic resonance. Nature. 1977; 270:722–723.2. Holland GN, Moore WS, Hawkes RC. Nuclear magnetic resonance tomography of the brain. J Comput Assist Tomogr. 1980; 4:1–3.3. Cho ZH, Kim HS, Song HB, Cumming J. Fourier transform nuclear magnetic resonance tomographic imaging. Proc IEEE Inst Electr Electron Eng. 1982; 79:1152–1173.4. Cho ZH, Oh CH, Mun CW, Kim YS. Some results of high-flow-velocity NMR imaging using selection gradient. Magn Reson Med. 1986; 3:857–862.5. Park HW, Cho ZH. High-resolution human in vivo spectroscopic imaging using echo-time encoding technique. Magn Reson Med. 1986; 3:448–453.6. Cho ZH, Son YD, Kim HK, et al. A hybrid PET-MRI: an integrated molecular-genetic imaging system with HRRT-PET and 7.0-T MRI. Int J Imaging Syst Technol. 2007; 17:252–265.7. Duyn JH, van Gelderen P, Li TQ, de Zwart JA, Koretsky AP, Fukunaga M. High-field MRI of brain cortical substructure based on signal phase. Proc Natl Acad Sci U S A. 2007; 104:11796–11801.8. Calamante F, Tournier JD, Smith RE, Connelly A. A generalized framework for super-resolution track-weighted imaging. Neuroimage. 2012; 59:2494–2503.9. Calamante F, Oh SH, Tournier JD, et al. Super-resolution track-density imaging of thalamic substructures: comparison with high-resolution anatomical magnetic resonance imaging at 7.0T. Hum Brain Mapp. 2013; 34:2538–2548.10. Cho ZH, Law M, Chi JG, et al. An anatomic review of thalamolimbic fiber tractography: ultra-high resolution direct visualization of thalamolimbic fibers anterior thalamic radiation, superolateral and inferomedial medial forebrain bundles, and newly identified septum pellucidum tract. World Neurosurg. 2015; 83:54–61.11. Makris N, Kennedy DN, McInerney S, et al. Segmentation of subcomponents within the superior longitudinal fascicle in humans: a quantitative, in vivo, DT-MRI study. Cereb Cortex. 2005; 15:854–869.12. Cho ZH, Chi JG,. Calamante F. 7.0T MRI brain white matter atlas. 2nd ed. New York, Heidelberg, London: Springer Verlag;2015.13. Lee KH, Blaha CD, Garris PA, et al. Evolution of deep brain stimulation: human electrometer and smart devices supporting the next generation of therapy. Neuromodulation. 2009; 12:85–103.14. Cho ZH, Min HK, Oh SH, et al. Direct visualization of deep brain stimulation targets in Parkinson disease with the use of 7-tesla magnetic resonance imaging. J Neurosurg. 2010; 113:639–647.
- Full Text Links
-
- Actions
-
Cited
- CITED
-
- Close
- Share
-
- Similar articles
-
- High field strength magnetic resonance imaging of cardiovascular diseases
- Diffusion Tensor Imaging: Exploring the Motor Networks and Clinical Applications
- Normal Anatomy of Cranial Nerves III–XII on Magnetic Resonance Imaging
- Recent Issues in Musculoskeletal Anatomy Research and Correlation with MRI
- Introduction to high field strength magnetic resonance imaging
