Analysis of ¹â¸F-Fluorodeoxyglucose and ¹â¸F-Fluoride Positron Emission Tomography in Korean Stroke Patients with Carotid Atherosclerosis
- Affiliations
-
- 1Department of Neurology, Chung-Ang University Hospital, Chung-Ang University College of Medicine, Seoul, Korea. kwangyeol.park@gmail.com
- 2Department of Nuclear Medicine, Korea University Medical Center, Korea University College of Medicine, Seoul, Korea.
- 3Department of Molecular Medicine and Biopharmaceutical Science, WCU Graduate School of Convergence Science and Technology, Seoul National University, Seoul, Korea.
- 4Department of Nuclear Medicine, Chung-Ang University Hospital, Chung-Ang University College of Medicine, Seoul, Korea. joneseok@cau.ac.kr
- KMID: 2458388
- DOI: http://doi.org/10.12997/jla.2019.8.2.232
Abstract
OBJECTIVE
The objective of this study was to analyze uptake patterns and intensity of ¹â¸F-fluorodeoxyglucose (FDG) and ¹â¸F-sodium fluoride (NaF) radioligands in carotid atheroma among stroke patients according to carotid atheroma characteristics.
METHODS
Between September 2015 and January 2017, consecutive acute stroke or transient ischemic attack patients with 50% or more proximal internal carotid artery stenosis on brain computed tomography angiography were prospectively enrolled. All patients received FDG and NaF positron emission tomography (PET) evaluation when their neurological status was stabilized. Uptake values of FDG and NaF were compared by target to blood ratio (TBR) according to the calcification burden, atheroma volume and the presence of a necrotic core of carotid atheroma.
RESULTS
A total of 18 patients with 36 carotid arteries were finally enrolled, with 10 patients diagnosed as acute cerebral infarction due to symptomatic carotid stenosis. FDG uptake at symptomatic carotid arteries was significantly more increased than that at asymptomatic arteries (TBR: 1.17±0.23 vs. 1.01±0.15, Mann-Whitney U-test, p=0.02), but NaF uptake was not different (TBR: 1.38±0.49 vs. 1.51±0.40, p=0.40). In terms of calcification degree, NaF uptake increased as calcification burden increased (none, 1.28±0.36; spotty, 1.29±0.29; linear, 1.74±0.44; analysis of variance, p=0.02).
CONCLUSION
Carotid evaluation by FDG is superior to NaF PET in the detection of symptomatic carotid atherosclerosis among stroke patients. NaF PET uptake reflects the overall calcification burden.
MeSH Terms
Figure
-
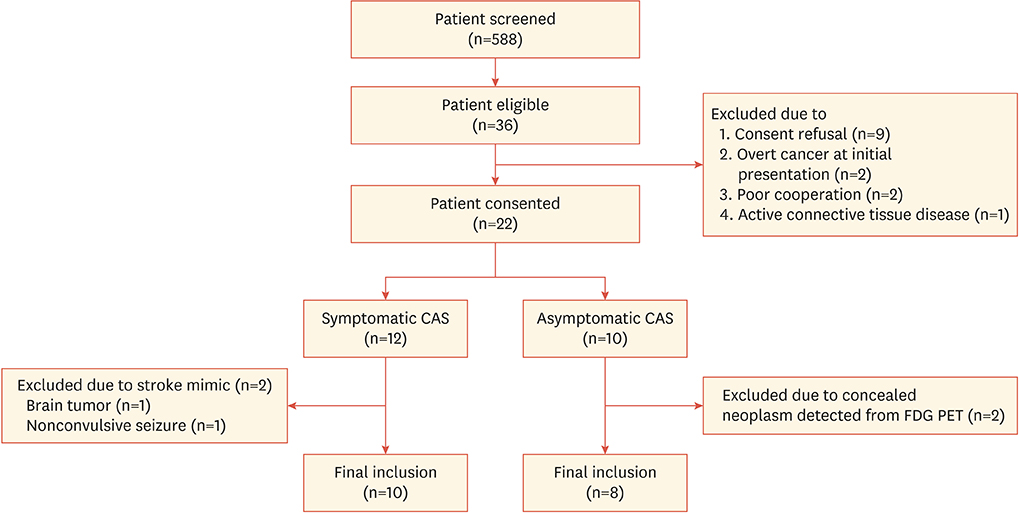
Fig. 1 Study flow chart. A total of 22 patients were initially included in the study and classified in the symptomatic or asymptomatic carotid atherosclerosis groups. A total of 18 patients were finally assessed after PET study (mean age: 75±12 years, including 9 female patients). Two patients in the symptomatic carotid atherosclerosis group were excluded due to stroke mimic: one patient with sudden onset facial palsy and motor aphasia was found to have low grade glioma involving the left frontal cortex 2 months after the index event. The other patient with recurrent mental deterioration and dysarthria was found to have nonconvulsive seizure instead of transient ischemic attack. Another 2 patients were excluded from the asymptomatic carotid atherosclerosis group because concealed neoplasm was detected from FDG PET (one patient with colon cancer, the other with adrenal adenoma). CAS, carotid atherosclerosis; FDG, fluorodeoxyglucose; PET, positron emission tomography.
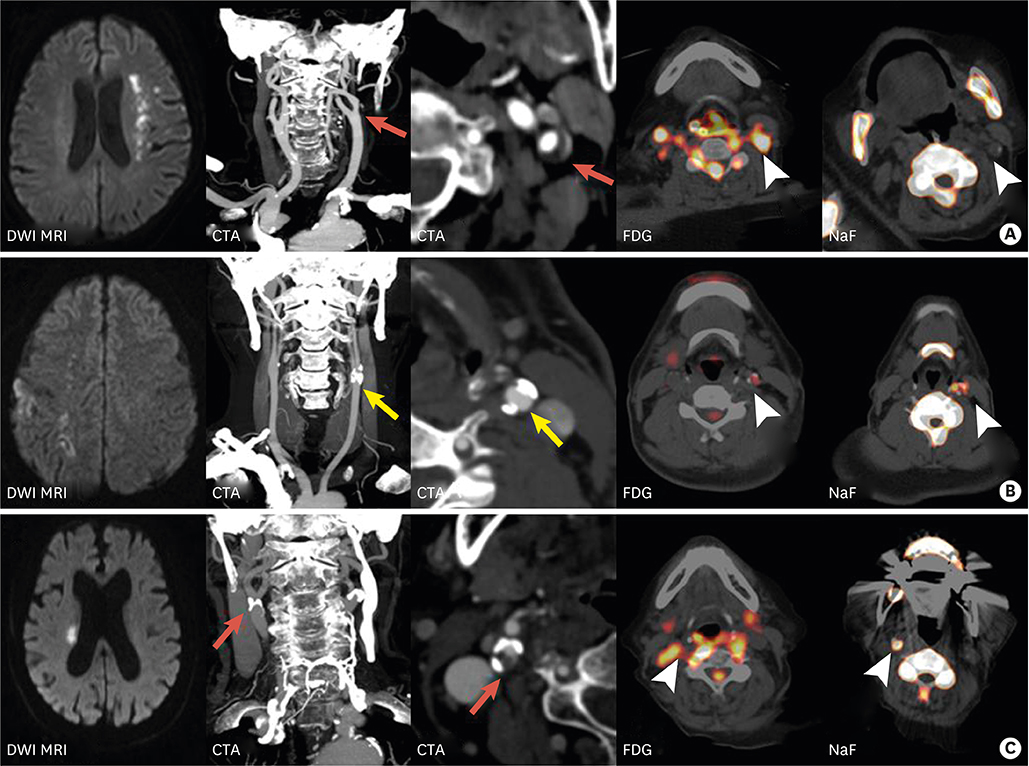
Fig. 2 Representative radiotracer uptake patterns according to atheroma characteristics. (A) A 76-year-old female patient was diagnosed with left hemispheric border zone infarction from DWI MRI with a severe left carotid stenosis from CTA. Axial section of CTA revealed an atheroma with perivascular rim enhancement and minimal calcification (red arrows). PET images showed increased FDG uptake (arrowhead) and minimal NaF uptake (arrowhead). (B) A 55-year-old male patient had multiple infarctions involving the right middle cerebral artery territory from DWI and moderate stenosis at the left proximal carotid artery (asymptomatic atherosclerosis, yellow arrow). Axial CTA showed considerable atheroma burden with multiple spotty calcification and PET image revealed minimal FDG uptake and increased NaF uptake at atheroma (arrowhead). (C) An 85-year-old female patient was diagnosed with right corona radiata infarction due to proximal carotid atherosclerosis. Axial CTA showed large atheroma with heterogeneous signal intensity due to heavy calcification burden and necrotic core (red arrow). PET image showed increased uptake of both FDG and NaF radiotracers (arrowhead). CTA, computed tomography angiography; FDG, fluorodeoxyglucose; PET, positron emission tomography; NaF, sodium fluoride; DWI, diffusion-weighted imaging; MRI, magnetic resonance imaging.
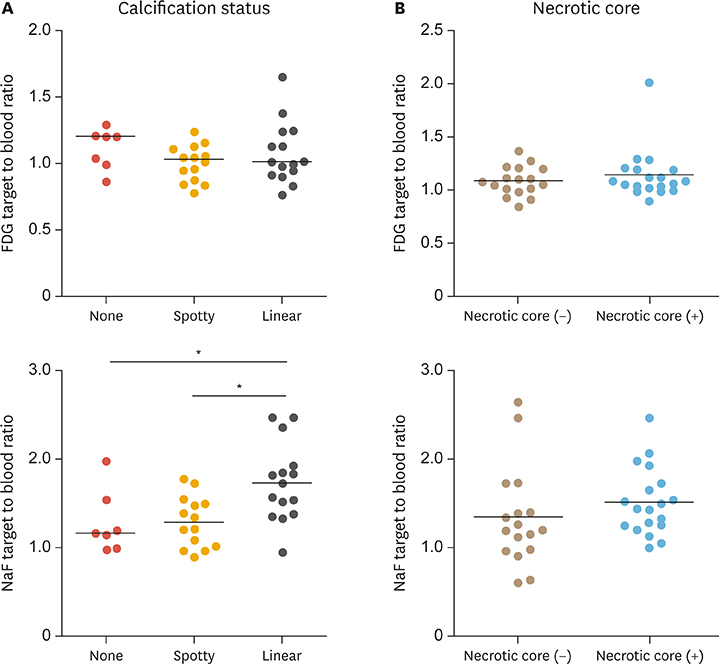
Fig. 3 Comparison of FDG and NaF uptake in terms of atheroma characteristics. (A) Although FDG uptake was not significantly different according to calcification status of internal carotid arteries (none, 1.12±0.15; spotty, 1.00±0.14; linear, 1.08±0.23; ANOVA, p=0.38), uptake values of NaF showed the maximum intensity on the severe calcified atheroma group (none, 1.28±0.36; spotty, 1.29±0.29; linear, 1.74±0.44; ANOVA, p=0.02). (B) Uptake values of FDG radiotracers were not significantly different according to the presence of necrotic core (1.09±0.14 vs. 1.15±0.24, Mann Whitney U-test, p=0.67), although levels of NaF tended to be increased in atherosclerotic walls with necrotic core (1.34±0.55 vs. 1.51±0.38, Mann Whitney U-test, p=0.09). FDG, fluorodeoxyglucose; NaF, sodium fluoride; ANOVA, analysis of variance.
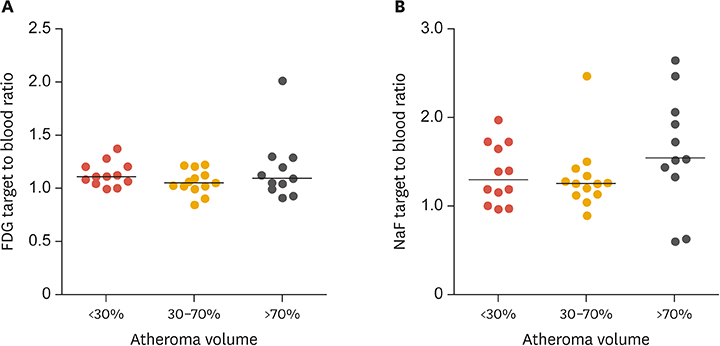
Fig. 4 Comparison of FDG and NaF uptake values in terms of atheroma volume. The uptake levels of FDG or NaF radiotracer were not significantly different according to atheroma volume status (FDG: mild, 1.13±0.11; moderate, 1.06±0.12; severe, 1.18±0.31; ANOVA, p=0.34; NaF: mild, 1.36±0.34; moderate, 1.32±0.38; severe, 1.63±0.65; ANOVA, p=0.25). ANOVA, analysis of variance; FDG, fluorodeoxyglucose; NaF, sodium fluoride.
Reference
-
1. O'Donnell MJ, Chin SL, Rangarajan S, Xavier D, Liu L, Zhang H, et al. Global and regional effects of potentially modifiable risk factors associated with acute stroke in 32 countries (INTERSTROKE): a case-control study. Lancet. 2016; 388:761–775.2. Abbott AL, Paraskevas KI, Kakkos SK, Golledge J, Eckstein HH, Diaz-Sandoval LJ, et al. Systematic review of guidelines for the management of asymptomatic and symptomatic carotid stenosis. Stroke. 2015; 46:3288–3301.
Article3. Tarkin JM, Dweck MR, Evans NR, Takx RA, Brown AJ, Tawakol A, et al. Imaging atherosclerosis. Circ Res. 2016; 118:750–769.
Article4. Joseph P, Tawakol A. Imaging atherosclerosis with positron emission tomography. Eur Heart J. 2016; 37:2974–2980.
Article5. Tarkin JM, Joshi FR, Rudd JH. PET imaging of inflammation in atherosclerosis. Nat Rev Cardiol. 2014; 11:443–457.
Article6. Joshi NV, Vesey AT, Williams MC, Shah AS, Calvert PA, Craighead FH, et al. 18F-fluoride positron emission tomography for identification of ruptured and high-risk coronary atherosclerotic plaques: a prospective clinical trial. Lancet. 2014; 383:705–713.
Article7. Vesey AT, Jenkins WS, Irkle A, Moss A, Sng G, Forsythe RO, et al. 18F-fluoride and 18F-fluorodeoxyglucose positron emission tomography after transient ischemic attack or minor ischemic stroke: case-control study. Circ Cardiovasc Imaging. 2017; 10:e004976.
Article8. Kim JM, Lee ES, Park KY, Seok JW, Kwon OS. Comparison of [18F]-FDG and [18F]-NaF positron emission tomography on culprit carotid atherosclerosis: a prospective study. JACC Cardiovasc Imaging. 2019; 12:370–372.
Article9. Adams HP Jr, Bendixen BH, Kappelle LJ, Biller J, Love BB, Gordon DL, et al. Classification of subtype of acute ischemic stroke. Definitions for use in a multicenter clinical trial. TOAST. Trial of Org 10172 in acute stroke treatment. Stroke. 1993; 24:35–41.
Article10. Fukuda K, Iihara K, Maruyama D, Yamada N, Ishibashi-Ueda H. Relationship between carotid artery remodeling and plaque vulnerability with T1-weighted magnetic resonance imaging. J Stroke Cerebrovasc Dis. 2014; 23:1462–1470.
Article11. Irkle A, Vesey AT, Lewis DY, Skepper JN, Bird JL, Dweck MR, et al. Identifying active vascular microcalcification by (18)F-sodium fluoride positron emission tomography. Nat Commun. 2015; 6:7495.
Article12. Müller HF, Viaccoz A, Fisch L, Bonvin C, Lovblad KO, Ratib O, et al. 18FDG-PET-CT: an imaging biomarker of high-risk carotid plaques. Correlation to symptoms and microembolic signals. Stroke. 2014; 45:3561–3566.
- Full Text Links
-
- Actions
-
Cited
- CITED
-
- Close
- Share
-
- Similar articles
-
- â¶â¸Gallium-Arginine-Glycine-Aspartic Acid and ¹â¸F-Fluorodeoxyglucose Positron Emission Tomography/Computed Tomography in Chondroblastic Osteosarcoma of the Skull
- Early Evaluation of Inflammatory Focus and Treatment Response Using ¹â¸F-Sodium Fluoride Bone Positron Emission Tomography/Computed Tomography in Patients with Metallic Implants: A Case Report
- Fluorine-18 Fluorodeoxyglucose Positron Emission Tomography/Computed Tomography Findings of Post Traumatic Lymphangioma in a Young Adult Male
- The role of ¹â¸F-fluorodeoxyglucose positron emission tomography in the assessment of disease activity of adult-onset Still’s disease
- Resting-State Metabolism of Hand Knob Area on ¹â¸F-FDG PET-CT According to Hand Function and Tractography of Corticospinal Tract After Stroke
