Differentiation of the Infarct Core from Ischemic Penumbra within the First 4.5 Hours, Using Diffusion Tensor Imaging-Derived Metrics: A Rat Model
- Affiliations
-
- 1Department of Electrical Engineering, National Taiwan University, Taipei 10617, Taiwan.
- 2Department of Radiology, Taoyuan Armed Forces General Hospital, Taoyuan 32551, Taiwan.
- 3Research Center of Translational Imaging, College of Medicine, Taipei Medical University, Taipei 11031, Taiwan. sandy0932@gmail.com
- 4Department of Radiology, School of Medicine, College of Medicine, Taipei Medical University, Taipei 11031, Taiwan.
- 5Department of Biomedical Imaging and Radiological Sciences, National Yang-Ming University, Taipei 112, Taiwan.
- 6Department of Physical Therapy and Assistive Technology, National Yang-Ming University, Taipei 112, Taiwan.
- 7Institute of Statistical Science, Academia Sinica, Taipei 11529, Taiwan.
- 8Graduate Institute of Biomedical Electrics and Bioinformatics, National Taiwan University, Taipei 10617, Taiwan.
- 9Department of Medical Imaging and Imaging Research Center, Taipei Medical University Hospital, Taipei Medical University, Taipei 11031, Taiwan.
- 10Department of Radiology, Tri-Service General Hospital, Taipei 114, Taiwan.
- 11Department of Radiology, National Defense Medical Center, Taipei 114, Taiwan.
- KMID: 2427939
- DOI: http://doi.org/10.3348/kjr.2017.18.2.269
Abstract
OBJECTIVE
To investigate whether the diffusion tensor imaging-derived metrics are capable of differentiating the ischemic penumbra (IP) from the infarct core (IC), and determining stroke onset within the first 4.5 hours.
MATERIALS AND METHODS
All procedures were approved by the local animal care committee. Eight of the eleven rats having permanent middle cerebral artery occlusion were included for analyses. Using a 7 tesla magnetic resonance system, the relative cerebral blood flow and apparent diffusion coefficient maps were generated to define IP and IC, half hour after surgery and then every hour, up to 6.5 hours. Relative fractional anisotropy, pure anisotropy (rq) and diffusion magnitude (rL) maps were obtained. One-way analysis of variance, receiver operating characteristic curve and nonlinear regression analyses were performed.
RESULTS
The evolutions of tensor metrics were different in ischemic regions (IC and IP) and topographic subtypes (cortical, subcortical gray matter, and white matter). The rL had a significant drop of 40% at 0.5 hour, and remained stagnant up to 6.5 hours. Significant differences (p < 0.05) in rL values were found between IP, IC, and normal tissue for all topographic subtypes. Optimal rL threshold in discriminating IP from IC was about -29%. The evolution of rq showed an exponential decrease in cortical IC, from -26.9% to -47.6%; an rq reduction smaller than 44.6% can be used to predict an acute stroke onset in less than 4.5 hours.
CONCLUSION
Diffusion tensor metrics may potentially help discriminate IP from IC and determine the acute stroke age within the therapeutic time window.
Keyword
MeSH Terms
-
Animals
Area Under Curve
Brain Ischemia/*diagnosis/diagnostic imaging
Brain Mapping
Cerebrovascular Circulation/physiology
*Diffusion Tensor Imaging
Disease Models, Animal
Gray Matter/diagnostic imaging
Infarction, Middle Cerebral Artery/*diagnosis/diagnostic imaging
Magnetic Resonance Imaging
Male
ROC Curve
Rats
Rats, Sprague-Dawley
Time Factors
White Matter/diagnostic imaging
Figure
-
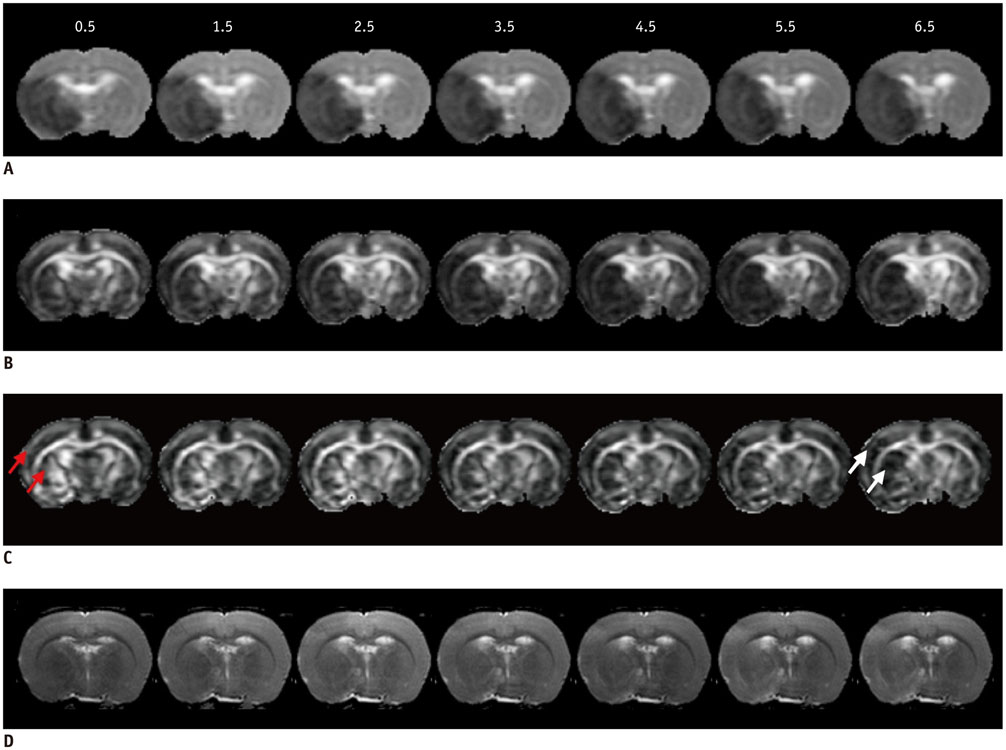
Fig. 1 Serial L (A), q (B), FA (C), and T2WI (D) maps of rat for demonstrating spatiotemporal evolutions. L and q maps showed significant hypointensities on ischemic lesion, while FA maps displayed initial elevation (red arrows) of ischemia with later reduction (white arrows) by 6.5 hours. T2WI showed progressively minor increased intensity in ischemia areas, over time. FA = fractional anisotropy, T2WI = T2-weighted imaging

Fig. 2 Temporal evolutions of rL (A), rq (B), and rFA (C) in cortical (left column), subcortical GM (middle column), and WM regions (right column), respectively. *Indicates significant difference between IP and NT (p < 0.05), †Represents significant difference between IP and IC (p < 0.05). Error bars are ± SEM. GM = gray matter, IC = infarct core, IP = ischemic penumbra, NT = normal tissue, WM = white matter

Fig. 3 ROC curves in discriminating IP from IC (blue curves) and NT (red curves) for cortical (A), subcortical GM (B), and WM (C) using rL values. Gray areas indicate range for eight rats. GM = gray matter, IC = infarct core, IP = ischemic penumbra, NT = normal tissue, ROC = receiver operating characteristic, WM = white matter
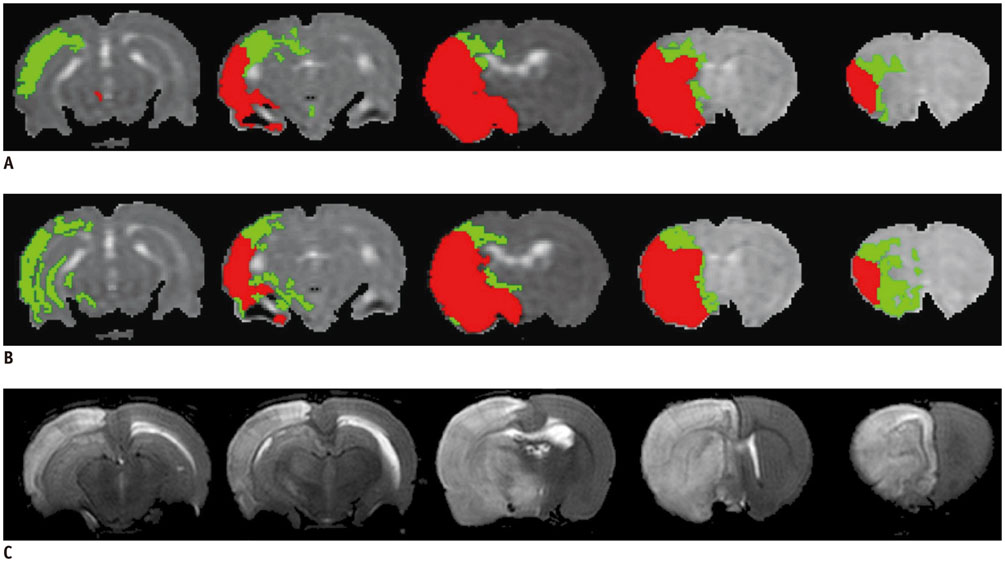
Fig. 4 IC (red) and IP (green) regions defined by perfusion-diffusion mismatch (A) and proposed L-defined method (B) rat at 90 min after MCAo. 24 hr-T2WIs are also displayed to show final infarct regions (C). Severe edema extending to normal hemisphere is observed in 24 hr-T2WIs. IC = infarct core, IP = ischemic penumbra, MCAo = middle cerebral artery occlusion, T2WI = T2-weighted imaging
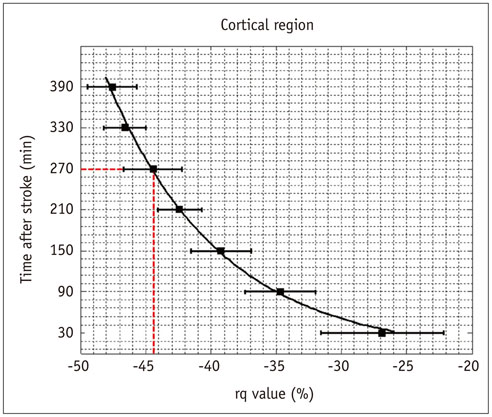
Fig. 5 Relationship between rq value and time after stroke for cortical IC. Solid curve represents empirical relationship, i.e., elapsed time = 1.636 x exp (-0.115 × rq value), estimated by nonlinear regression analysis. Red dashed lines indicate that 4.5-hr stroke onset can be identified by 44.6% reduction of rq value. Error bars are ± SEM. IC = infarct core
Cited by 1 articles
-
Diffusion Tensor-Derived Properties of Benign Oligemia, True “at Risk” Penumbra, and Infarct Core during the First Three Hours of Stroke Onset: A Rat Model
Fang-Ying Chiu, Duen-Pang Kuo, Yung-Chieh Chen, Yu-Chieh Kao, Hsiao-Wen Chung, Cheng-Yu Chen
Korean J Radiol. 2018;19(6):1161-1171. doi: 10.3348/kjr.2018.19.6.1161.
Reference
-
1. Hacke W, Kaste M, Bluhmki E, Brozman M, Dávalos A, Guidetti D, et al. Thrombolysis with alteplase 3 to 4.5 hours after acute ischemic stroke. N Engl J Med. 2008; 359:1317–1329.2. Kang DW, Kwon JY, Kwon SU, Kim JS. Wake-up or unclear-onset strokes: are they waking up to the world of thrombolysis therapy? Int J Stroke. 2012; 7:311–320.3. Bhagat YA, Hussain MS, Stobbe RW, Butcher KS, Emery DJ, Shuaib A, et al. Elevations of diffusion anisotropy are associated with hyper-acute stroke: a serial imaging study. Magn Reson Imaging. 2008; 26:683–693.4. Sakai K, Yamada K, Nagakane Y, Mori S, Nakagawa M, Nishimura T. Diffusion tensor imaging may help the determination of time at onset in cerebral ischaemia. J Neurol Neurosurg Psychiatry. 2009; 80:986–990.5. Puig J, Blasco G, Daunis-I-Estadella J, Thomalla G, Castellanos M, Soria G, et al. Increased corticospinal tract fractional anisotropy can discriminate stroke onset within the first 4.5 hours. Stroke. 2013; 44:1162–1165.6. Shereen A, Nemkul N, Yang D, Adhami F, Dunn RS, Hazen ML, et al. Ex vivo diffusion tensor imaging and neuropathological correlation in a murine model of hypoxia-ischemia-induced thrombotic stroke. J Cereb Blood Flow Metab. 2011; 31:1155–1169.7. Chiang T, Messing RO, Chou WH. Mouse model of middle cerebral artery occlusion. J Vis Exp. 2011; (48):2761.8. Bråtane BT, Walvick RP, Corot C, Lancelot E, Fisher M. Characterization of gadolinium-based dynamic susceptibility contrast perfusion measurements in permanent and transient MCAO models with volumetric based validation by CASL. J Cereb Blood Flow Metab. 2010; 30:336–342.9. Henninger N, Bouley J, Nelligan JM, Sicard KM, Fisher M. Normobaric hyperoxia delays perfusion/diffusion mismatch evolution, reduces infarct volume, and differentially affects neuronal cell death pathways after suture middle cerebral artery occlusion in rats. J Cereb Blood Flow Metab. 2007; 27:1632–1642.10. Yao X, Yu T, Liang B, Xia T, Huang Q, Zhuang S. Effect of increasing diffusion gradient direction number on diffusion tensor imaging fiber tracking in the human brain. Korean J Radiol. 2015; 16:410–418.11. Ostergaard L, Weisskoff RM, Chesler DA, Gyldensted C, Rosen BR. High resolution measurement of cerebral blood flow using intravascular tracer bolus passages. Part I: mathematical approach and statistical analysis. Magn Reson Med. 1996; 36:715–725.12. Lee EK, Choi SH, Yun TJ, Kang KM, Kim TM, Lee SH, et al. Prediction of response to concurrent chemoradiotherapy with temozolomide in glioblastoma: application of immediate post-operative dynamic susceptibility contrast and diffusion-weighted MR imaging. Korean J Radiol. 2015; 16:1341–1348.13. Wang W, Steward CE, Desmond PM. Diffusion tensor imaging in glioblastoma multiforme and brain metastases: the role of p, q, L, and fractional anisotropy. AJNR Am J Neuroradiol. 2009; 30:203–208.14. Meng X, Fisher M, Shen Q, Sotak CH, Duong TQ. Characterizing the diffusion/perfusion mismatch in experimental focal cerebral ischemia. Ann Neurol. 2004; 55:207–212.15. Shen Q, Meng X, Fisher M, Sotak CH, Duong TQ. Pixel-by-pixel spatiotemporal progression of focal ischemia derived using quantitative perfusion and diffusion imaging. J Cereb Blood Flow Metab. 2003; 23:1479–1488.16. Bhagat YA, Emery DJ, Shuaib A, Sher F, Rizvi NH, Akhtar N, et al. The relationship between diffusion anisotropy and time of onset after stroke. J Cereb Blood Flow Metab. 2006; 26:1442–1450.17. Carano RA, Li F, Irie K, Helmer KG, Silva MD, Fisher M, et al. Multispectral analysis of the temporal evolution of cerebral ischemia in the rat brain. J Magn Reson Imaging. 2000; 12:842–858.18. Papp EA, Leergaard TB, Calabrese E, Johnson GA, Bjaalie JG. Waxholm space atlas of the Sprague Dawley rat brain. Neuroimage. 2014; 97:374–386.19. Jenkinson M, Bannister P, Brady M, Smith S. Improved optimization for the robust and accurate linear registration and motion correction of brain images. Neuroimage. 2002; 17:825–841.20. Marquardt DW. An algorithm for least-squares estimation of nonlinear parameters. J Soc Indust Appl Math. 1963; 11:431–441.21. Henninger N, Bratane BT, Bastan B, Bouley J, Fisher M. Normobaric hyperoxia and delayed tPA treatment in a rat embolic stroke model. J Cereb Blood Flow Metab. 2009; 29:119–129.22. Singhal AB, Benner T, Roccatagliata L, Koroshetz WJ, Schaefer PW, Lo EH, et al. A pilot study of normobaric oxygen therapy in acute ischemic stroke. Stroke. 2005; 36:797–802.23. Kim HY, Singhal AB, Lo EH. Normobaric hyperoxia extends the reperfusion window in focal cerebral ischemia. Ann Neurol. 2005; 57:571–575.24. Flynn EP, Auer RN. Eubaric hyperoxemia and experimental cerebral infarction. Ann Neurol. 2002; 52:566–572.25. Yam PS, Dewar D, McCulloch J. Axonal injury caused by focal cerebral ischemia in the rat. J Neurotrauma. 1998; 15:441–450.26. Dewar D, Dawson DA. Changes of cytoskeletal protein immunostaining in myelinated fibre tracts after focal cerebral ischaemia in the rat. Acta Neuropathol. 1997; 93:71–77.27. Kuroiwa T, Nagaoka T, Ueki M, Yamada I, Miyasaka N, Akimoto H. Different apparent diffusion coefficient: water content correlations of gray and white matter during early ischemia. Stroke. 1998; 29:859–865.28. Pantoni L, Garcia JH, Gutierrez JA. Cerebral white matter is highly vulnerable to ischemia. Stroke. 1996; 27:1641–1646. discussion 1647.29. Armitage GA, Todd KG, Shuaib A, Winship IR. Laser speckle contrast imaging of collateral blood flow during acute ischemic stroke. J Cereb Blood Flow Metab. 2010; 30:1432–1436.30. Zhang H, Prabhakar P, Sealock R, Faber JE. Wide genetic variation in the native pial collateral circulation is a major determinant of variation in severity of stroke. J Cereb Blood Flow Metab. 2010; 30:923–934.31. Cowper SE, Robin HS, Steinberg SM, Su LD, Gupta S, LeBoit PE. Scleromyxoedema-like cutaneous diseases in renal-dialysis patients. Lancet. 2000; 356:1000–1001.32. Takasawa M, Jones PS, Guadagno JV, Christensen S, Fryer TD, Harding S, et al. How reliable is perfusion MR in acute stroke? Validation and determination of the penumbra threshold against quantitative PET. Stroke. 2008; 39:870–877.33. Calamante F, Gadian DG, Connelly A. Quantification of perfusion using bolus tracking magnetic resonance imaging in stroke: assumptions, limitations, and potential implications for clinical use. Stroke. 2002; 33:1146–1151.34. Wu O, Østergaard L, Weisskoff RM, Benner T, Rosen BR, Sorensen AG. Tracer arrival timing-insensitive technique for estimating flow in MR perfusion-weighted imaging using singular value decomposition with a block-circulant deconvolution matrix. Magn Reson Med. 2003; 50:164–174.35. Sakai K, Yamada K, Oouchi H, Nishimura T. Numerical simulation model of hyperacute/acute stage white matter infarction. Magn Reson Med Sci. 2008; 7:187–194.36. Pierpaoli C, Basser PJ. Toward a quantitative assessment of diffusion anisotropy. Magn Reson Med. 1996; 36:893–906.37. Kim SJ, Choi CG, Kim JK, Yun SC, Jahng GH, Jeong HK, et al. Effects of MR parameter changes on the quantification of diffusion anisotropy and apparent diffusion coefficient in diffusion tensor imaging: evaluation using a diffusional anisotropic phantom. Korean J Radiol. 2015; 16:297–303.
- Full Text Links
-
- Actions
-
Cited
- CITED
-
- Close
- Share
-
- Similar articles
-
- Diffusion Tensor-Derived Properties of Benign Oligemia, True “at Risk†Penumbra, and Infarct Core during the First Three Hours of Stroke Onset: A Rat Model
- Diffusion Metrics as a Potential Prognostic Biomarker in Cervical Myelopathy
- Magnetic Resonance Imaging of the Ischemic Penumbra: Diffusion-Perfusion Mismatch in Acute Stroke Patients
- Correlation between Intravoxel Incoherent Motion Magnetic Resonance Imaging Derived Metrics and Serum Soluble CD40 Ligand Level in an Embolic Canine Stroke Model
- Principle and Experiments in Diffusion Tensor Imaging
