Diffusion Tensor-Derived Properties of Benign Oligemia, True “at Risk†Penumbra, and Infarct Core during the First Three Hours of Stroke Onset: A Rat Model
- Affiliations
-
- 1Department of Medical Imaging and Radiological Sciences, College of Medicine, I-Shou University, Kaohsiung 82445, Taiwan.
- 2Department of Radiology, Taoyuan Armed Forces General Hospital, Taoyuan 32551, Taiwan.
- 3Department of Medical Imaging, Taipei Medical University Hospital, Taipei Medical University, Taipei 11031, Taiwan. sandy0932@gmail.com
- 4Translational Imaging Research Center, College of Medicine, Taipei Medical University, Taipei 11031, Taiwan.
- 5Graduate Institute of Biomedical Electrics and Bioinformatics, National Taiwan. University, Taipei 10617, Taiwan.
- 6Department of Radiology, School of Medicine, College of Medicine, Taipei Medical University, Taipei 11031, Taiwan.
- 7Department of Radiology, Tri-Service General Hospital, Taipei 11490, Taiwan.
- 8Department of Radiology, National Defense Medical Center, Taipei 11490, Taiwan.
- KMID: 2424855
- DOI: http://doi.org/10.3348/kjr.2018.19.6.1161
Abstract
OBJECTIVE
The aim of this study was to investigate diffusion tensor (DT) imaging-derived properties of benign oligemia, true "at risk" penumbra (TP), and the infarct core (IC) during the first 3 hours of stroke onset.
MATERIALS AND METHODS
The study was approved by the local animal care and use committee. DT imaging data were obtained from 14 rats after permanent middle cerebral artery occlusion (pMCAO) using a 7T magnetic resonance scanner (Bruker) in room air. Relative cerebral blood flow and apparent diffusion coefficient (ADC) maps were generated to define oligemia, TP, IC, and normal tissue (NT) every 30 minutes up to 3 hours. Relative fractional anisotropy (rFA), pure anisotropy (rq), diffusion magnitude (rL), ADC (rADC), axial diffusivity (rAD), and radial diffusivity (rRD) values were derived by comparison with the contralateral normal brain.
RESULTS
The mean volume of oligemia was 24.7 ± 14.1 mm³, that of TP was 81.3 ± 62.6 mm³, and that of IC was 123.0 ± 85.2 mm³ at 30 minutes after pMCAO. rFA showed an initial paradoxical 10% increase in IC and TP, and declined afterward. The rq, rL, rADC, rAD, and rRD showed an initial discrepant decrease in IC (from −24% to −36%) as compared with TP (from −7% to −13%). Significant differences (p < 0.05) in metrics, except rFA, were found between tissue subtypes in the first 2.5 hours. The rq demonstrated the best overall performance in discriminating TP from IC (accuracy = 92.6%, area under curve = 0.93) and the optimal cutoff value was −33.90%. The metric values for oligemia and NT remained similar at all time points.
CONCLUSION
Benign oligemia is small and remains microstructurally normal under pMCAO. TP and IC show a distinct evolution of DT-derived properties within the first 3 hours of stroke onset, and are thus potentially useful in predicting the fate of ischemic brain.
Keyword
MeSH Terms
Figure
-
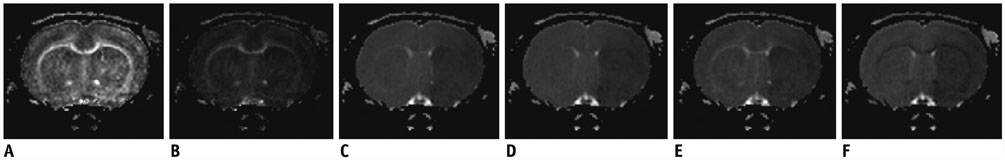
Fig. 1 Maps of DTI metrics measured at 30 minutes post pMCAO. Note relative hypointensity changes within hemisphere ipsilateral to pMCAO on maps of q (B), L (C), MD (D), AD (E), and RD (F), with exception of FA (A) which shows symmetrical signal intensity. AD = axial diffusivity, DTI = diffusion tensor imaging, FA = fractional anisotropy, L = diffusion magnitude, MD = mean diffusivity, pMCAO = permanent middle cerebral artery occlusion, q = pure anisotropy, RD = radial diffusivity
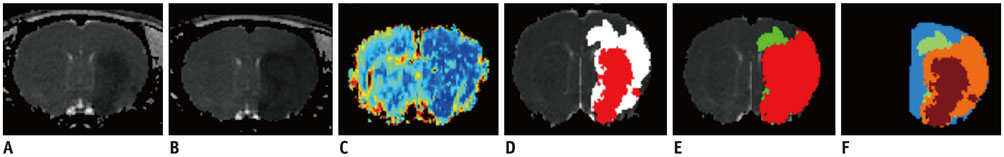
Fig. 2 Definitions of oligemia, TP, IC, and final infarct (IC3h) in pMCAO rat. IC was defined as hypodense area in apparent diffusion coefficient map at 30 minutes post pMCAO (A) while IC3h was same growing hypodense area at 3 hours (B). Perfusion deficit at 30 minutes post pMCAO is shown in (C). Perfusion-diffusion mismatch is illustrated in (D) where red indicates IC and white perfusion deficit (including oligemia and TP) at 30 minutes post pMCAO. Oligemia (green in E, F) was defined as CBF0.5h – IC3h mismatch. TP (orange in F) was difference between IC3h and IC at 30 minutes. CBF = cerebral blood flow, IC = infarct core, TP = true penumbra
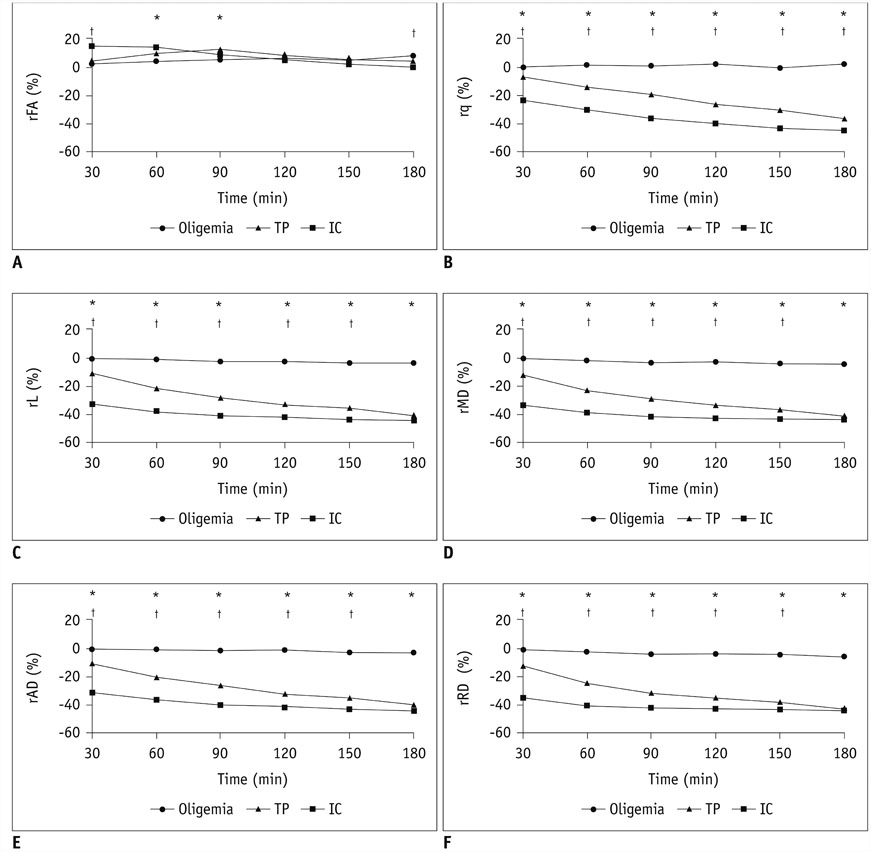
Fig. 3 Temporal evolution of DTI metrics within 3 hours post-pMCAO in oligemia, TP, and IC. In particular, significant differences (p < 0.05) in DTI metrics between oligemia, TP, and IC, including rFA (A), rq (B), rL (C), rMD (D), rAD (E), and rRD (F) are highlighted across time points. *TP vs. oligemia, †TP vs. IC. rAD = relative AD, rFA = relative FA, rL = relative L, rMD = relative MD, rq = relative q, rRD = relative RD
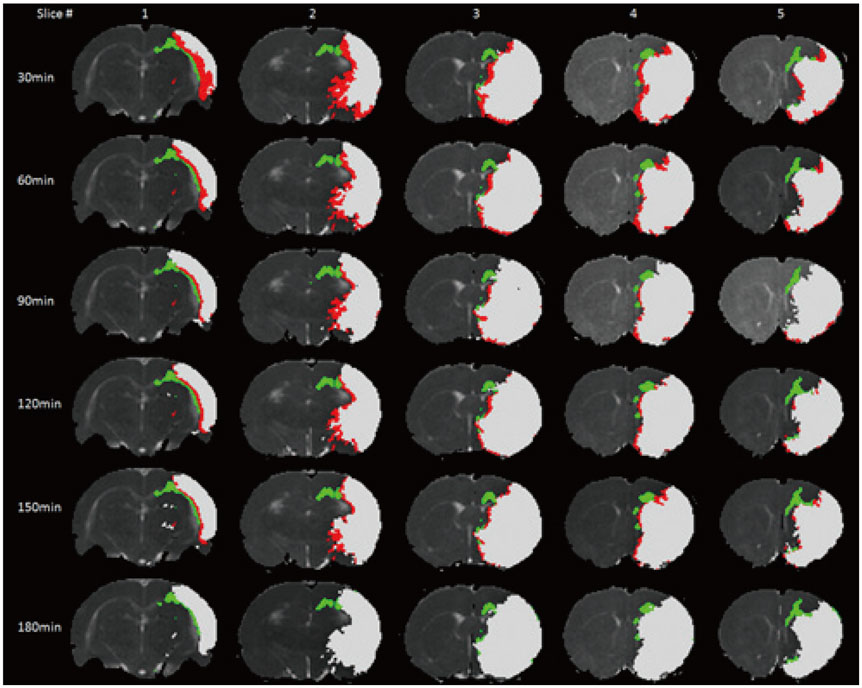
Fig. 4 Topographic distributions of IC, TP, and oligemia with ischemia progression. NT is displayed in grayscale, core in white, TP in red, and oligemia in green. As time evolved, TP gradually merged into IC and disappeared, while oligemia persisted during first 3 hours post pMCAO. NT = normal tissue

Fig. 5 Volumes of IC at 30 minutes and final infarct, oligemia, and TP at 3 hours. A. Comparison of infarct sizes (mm3) between 0.5 hours and 3 hours in all rats (n = 14). B. Mean volumes of IC at 30 minutes, final infarct, TP, and oligemia at 3 hours. Data presented as mean ± standard deviation.
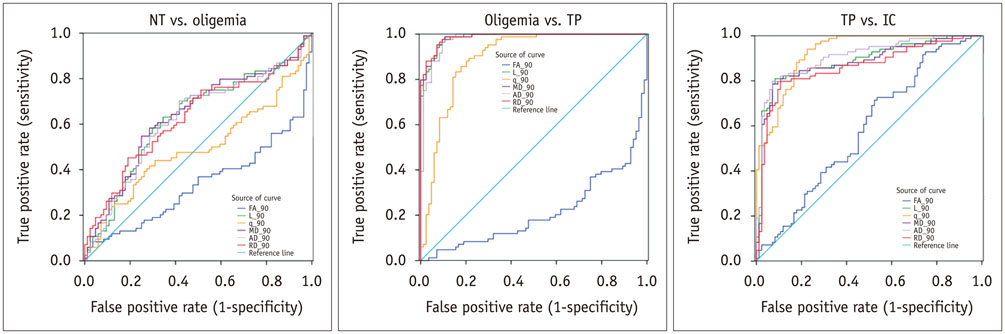
Fig. 6 Imaging A–C encompasses three different receiver operating characteristic curves but similar comparisons. Receiver operating characteristic curves for discriminating NT from oligemia (A), oligemia from TP (B), and TP from IC (C), using diffusion metrics at 90 minutes post-pMCAO.
Reference
-
1. Hossmann KA, Heiss WD, Bewermeyer H, Mies G. EEG frequency analysis in the course of acute ischemic stroke. Neurosurg Rev. 1980; 3:31–36.
Article2. Hacke W, Kaste M, Bluhmki E, Brozman M, Dávalos A, Guidetti D, et al. ECASS Investigators. Thrombolysis with alteplase 3 to 4.5 hours after acute ischemic stroke. N Engl J Med. 2008; 359:1317–1329.
Article3. Albers GW, Thijs VN, Wechsler L, Kemp S, Schlaug G, Skalabrin E, et al. DEFUSE Investigators. Magnetic resonance imaging profiles predict clinical response to early reperfusion: the diffusion and perfusion imaging evaluation for understanding stroke evolution (DEFUSE) study. Ann Neurol. 2006; 60:508–517.
Article4. Heiss WD. Ischemic penumbra: evidence from functional imaging in man. J Cereb Blood Flow Metab. 2000; 20:1276–1293.
Article5. Albers GW, Lansberg MG, Kemp S, Tsai JP, Lavori P, Christensen S, et al. A multicenter randomized controlled trial of endovascular therapy following imaging evaluation for ischemic stroke (DEFUSE 3). Int J Stroke. 2017; 12:896–905.
Article6. Butcher KS, Parsons M, MacGregor L, Barber PA, Chalk J, Bladin C, et al. EPITHET Investigators. Refining the perfusion-diffusion mismatch hypothesis. Stroke. 2005; 36:1153–1159.
Article7. Goyal M, Menon BK, Derdeyn CP. Perfusion imaging in acute ischemic stroke: let us improve the science before changing clinical practice. Radiology. 2013; 266:16–21.
Article8. Sakai K, Yamada K, Nagakane Y, Mori S, Nakagawa M, Nishimura T. Diffusion tensor imaging may help the determination of time at onset in cerebral ischaemia. J Neurol Neurosurg Psychiatry. 2009; 80:986–990.
Article9. Puig J, Blasco G, Daunis-I-Estadella J, Thomalla G, Castellanos M, Soria G, et al. Increased corticospinal tract fractional anisotropy can discriminate stroke onset within the first 4.5 hours. Stroke. 2013; 44:1162–1165.
Article10. Chiang T, Messing RO, Chou WH. Mouse model of middle cerebral artery occlusion. J Vis Exp. 2011; (48):pii: 2761.
Article11. Kuo DP, Lu CF, Liou M, Chen YC, Chung HW, Chen CY. Differentiation of the infarct core from ischemic penumbra within the first 4.5 hours, using diffusion tensor imaging-derived metrics: a rat model. Korean J Radiol. 2017; 18:269–278.
Article12. Ostergaard L, Weisskoff RM, Chesler DA, Gyldensted C, Rosen BR. High resolution measurement of cerebral blood flow using intravascular tracer bolus passages. Part I: mathematical approach and statistical analysis. Magn Reson Med. 1996; 36:715–725.13. Lee EK, Choi SH, Yun TJ, Kang KM, Kim TM, Lee SH, et al. Prediction of response to concurrent chemoradiotherapy with temozolomide in glioblastoma: application of immediate post-operative dynamic susceptibility contrast and diffusion-weighted MR imaging. Korean J Radiol. 2015; 16:1341–1348.
Article14. Calamante F, Gadian DG, Connelly A. Quantification of perfusion using bolus tracking magnetic resonance imaging in stroke: assumptions, limitations, and potential implications for clinical use. Stroke. 2002; 33:1146–1151.15. Wu O, Østergaard L, Weisskoff RM, Benner T, Rosen BR, Sorensen AG. Tracer arrival timing-insensitive technique for estimating flow in MR perfusion-weighted imaging using singular value decomposition with a block-circulant deconvolution matrix. Magn Reson Med. 2003; 50:164–174.
Article16. Sakai K, Yamada K, Oouchi H, Nishimura T. Numerical simulation model of hyperacute/acute stage white matter infarction. Magn Reson Med Sci. 2008; 7:187–194.
Article17. Shereen A, Nemkul N, Yang D, Adhami F, Dunn RS, Hazen ML, et al. Ex vivo diffusion tensor imaging and neuropathological correlation in a murine model of hypoxia-ischemia-induced thrombotic stroke. J Cereb Blood Flow Metab. 2011; 31:1155–1169.
Article18. Bråtane BT, Walvick RP, Corot C, Lancelot E, Fisher M. Characterization of gadolinium-based dynamic susceptibility contrast perfusion measurements in permanent and transient MCAO models with volumetric based validation by CASL. J Cereb Blood Flow Metab. 2010; 30:336–342.
Article19. Henninger N, Bouley J, Nelligan JM, Sicard KM, Fisher M. Normobaric hyperoxia delays perfusion/diffusion mismatch evolution, reduces infarct volume, and differentially affects neuronal cell death pathways after suture middle cerebral artery occlusion in rats. J Cereb Blood Flow Metab. 2007; 27:1632–1642.
Article20. Yao X, Yu T, Liang B, Xia T, Huang Q, Zhuang S. Effect of increasing diffusion gradient direction number on diffusion tensor imaging fiber tracking in the human brain. Korean J Radiol. 2015; 16:410–418.
Article21. Lythgoe MF, Thomas DL, Calamante F, Pell GS, King MD, Busza AL, et al. Acute changes in MRI diffusion, perfusion, T(1), and T(2) in a rat model of oligemia produced by partial occlusion of the middle cerebral artery. Magn Reson Med. 2000; 44:706–712.22. Shen Q, Meng X, Fisher M, Sotak CH, Duong TQ. Pixel-by-pixel spatiotemporal progression of focal ischemia derived using quantitative perfusion and diffusion imaging. J Cereb Blood Flow Metab. 2003; 23:1479–1488.
Article23. Meng X, Fisher M, Shen Q, Sotak CH, Duong TQ. Characterizing the diffusion/perfusion mismatch in experimental focal cerebral ischemia. Ann Neurol. 2004; 55:207–212.
Article24. Lee DH, Kang DW, Ahn JS, Choi CG, Kim SJ, Suh DC. Imaging of the ischemic penumbra in acute stroke. Korean J Radiol. 2005; 6:64–74.
Article25. Liu Y, D'Arceuil HE, Westmoreland S, He J, Duggan M, Gonzalez RG, et al. Serial diffusion tensor MRI after transient and permanent cerebral ischemia in nonhuman primates. Stroke. 2007; 38:138–145.
Article26. Morita N, Harada M, Uno M, Furutani K, Nishitani H. Change of diffusion anisotropy in patients with acute cerebral infarction using statistical parametric analysis. Radiat Med. 2006; 24:253–259.
Article27. Tamura H, Kurihara N, Machida Y, Nishino A, Shimosegawa E. How does water diffusion in human white matter change following ischemic stroke? Magn Reson Med Sci. 2009; 8:121–134.
Article28. Bhagat YA, Hussain MS, Stobbe RW, Butcher KS, Emery DJ, Shuaib A, et al. Elevations of diffusion anisotropy are associated with hyper-acute stroke: a serial imaging study. Magn Reson Imaging. 2008; 26:683–693.
Article29. Ozsunar Y, Koseoglu K, Huisman TA, Koroshetz W, Sorensen AG. MRI measurements of water diffusion: impact of region of interest selection on ischemic quantification. Eur J Radiol. 2004; 51:195–201.
Article30. Carano RA, Li F, Irie K, Helmer KG, Silva MD, Fisher M, et al. Multispectral analysis of the temporal evolution of cerebral ischemia in the rat brain. J Magn Reson Imaging. 2000; 12:842–858.
Article31. Harris AD, Pereira RS, Mitchell JR, Hill MD, Sevick RJ, Frayne R. A comparison of images generated from diffusion-weighted and diffusion-tensor imaging data in hyper-acute stroke. J Magn Reson Imaging. 2004; 20:193–200.
Article32. Sorensen AG, Wu O, Copen WA, Davis TL, Gonzalez RG, Koroshetz WJ, et al. Human acute cerebral ischemia: detection of changes in water diffusion anisotropy by using MR imaging. Radiology. 1999; 212:785–792.
Article33. Zelaya F, Flood N, Chalk JB, Wang D, Doddrell DM, Strugnell W, et al. An evaluation of the time dependence of the anisotropy of the water diffusion tensor in acute human ischemia. Magn Reson Imaging. 1999; 17:331–348.
Article34. Deb P, Sharma S, Hassan KM. Pathophysiologic mechanisms of acute ischemic stroke: an overview with emphasis on therapeutic significance beyond thrombolysis. Pathophysiology. 2010; 17:197–218.
Article35. Pitkonen M, Abo-Ramadan U, Marinkovic I, Pedrono E, Hasan KM, Strbian D, et al. Long-term evolution of diffusion tensor indices after temporary experimental ischemic stroke in rats. Brain Res. 2012; 1445:103–110.
Article36. Baron CA, Kate M, Gioia L, Butcher K, Emery D, Budde M, et al. Reduction of diffusion-weighted imaging contrast of acute ischemic stroke at short diffusion times. Stroke. 2015; 46:2136–2141.
Article37. Yam PS, Dewar D, McCulloch J. Axonal injury caused by focal cerebral ischemia in the rat. J Neurotrauma. 1998; 15:441–450.
Article38. Dewar D, Dawson DA. Changes of cytoskeletal protein immunostaining in myelinated fibre tracts after focal cerebral ischaemia in the rat. Acta Neuropathol. 1997; 93:71–77.
Article39. Nael K, Trouard TP, Lafleur SR, Krupinski EA, Salamon N, Kidwell CS. White matter ischemic changes in hyperacute ischemic stroke: voxel-based analysis using diffusion tensor imaging and MR perfusion. Stroke. 2015; 46:413–418.
Article40. Green HA, Peña A, Price CJ, Warburton EA, Pickard JD, Carpenter TA, et al. Increased anisotropy in acute stroke: a possible explanation. Stroke. 2002; 33:1517–1521.41. Lassen NA. Cerebral blood flow and oxygen consumption in man. Physiol Rev. 1959; 39:183–238.
Article42. Markus HS. Cerebral perfusion and stroke. J Neurol Neurosurg Psychiatry. 2004; 75:353–361.
Article43. Lassen NA, Astrup J. Ischemic penumbra. In : Wood JH, editor. Cerebral blood flow: physiologic and clinical aspects. New York, NY: McGraw-Hill;1987. p. 458–466.44. Plaschke K, Sommer C, Schroeck H, Matejic D, Kiessling M, Martin E, et al. A mouse model of cerebral oligemia: relation to brain histopathology, cerebral blood flow, and energy state. Exp Brain Res. 2005; 162:324–331.
Article45. Takasawa M, Jones PS, Guadagno JV, Christensen S, Fryer TD, Harding S, et al. How reliable is perfusion MR in acute stroke? Validation and determination of the penumbra threshold against quantitative PET. Stroke. 2008; 39:870–877.
- Full Text Links
-
- Actions
-
Cited
- CITED
-
- Close
- Share
-
- Similar articles
-
- Differentiation of the Infarct Core from Ischemic Penumbra within the First 4.5 Hours, Using Diffusion Tensor Imaging-Derived Metrics: A Rat Model
- Diffusion Tensor Imaging in Acute Ischemic Stroke: Usefulness of Fractional Anisotropy
- Magnetic Resonance Imaging of the Ischemic Penumbra: Diffusion-Perfusion Mismatch in Acute Stroke Patients
- Hyperoxia-Induced ΔR1 : MRI Biomarker of Histological Infarction in Acute Cerebral Stroke
- Visual recovery demonstrated by functional MRI and diffusion tensor tractography in bilateral occipital lobe infarction
