A Novel Nicotinamide Adenine Dinucleotide Correction Method for Mitochondrial Ca2+ Measurement with FURA-2-FF in Single Permeabilized Ventricular Myocytes of Rat
- Affiliations
-
- 1Department of Physiology, University of Ulsan College of Medicine/Asan Medical Center, Seoul 138-736, Korea. leemch@gmail.com
- KMID: 2285581
- DOI: http://doi.org/10.4196/kjpp.2015.19.4.373
Abstract
- Fura-2 analogs are ratiometric fluoroprobes that are widely used for the quantitative measurement of [Ca2+]. However, the dye usage is intrinsically limited, as the dyes require ultraviolet (UV) excitation, which can also generate great interference, mainly from nicotinamide adenine dinucleotide (NADH) autofluorescence. Specifically, this limitation causes serious problems for the quantitative measurement of mitochondrial [Ca2+], as no available ratiometric dyes are excited in the visible range. Thus, NADH interference cannot be avoided during quantitative measurement of [Ca2+] because the majority of NADH is located in the mitochondria. The emission intensity ratio of two different excitation wavelengths must be constant when the fluorescent dye concentration is the same. In accordance with this principle, we developed a novel online method that corrected NADH and Fura-2-FF interference. We simultaneously measured multiple parameters, including NADH, [Ca2+], and pH/mitochondrial membrane potential; Fura-2-FF for mitochondrial [Ca2+] and TMRE for Psi(m) or carboxy-SNARF-1 for pH were used. With this novel method, we found that the resting mitochondrial [Ca2+] concentration was 1.03 microM. This 1 microM cytosolic Ca2+ could theoretically increase to more than 100 mM in mitochondria. However, the mitochondrial [Ca2+] increase was limited to ~30 microM in the presence of 1 microM cytosolic Ca2+. Our method solved the problem of NADH signal contamination during the use of Fura-2 analogs, and therefore the method may be useful when NADH interference is expected.
Keyword
MeSH Terms
Figure
-
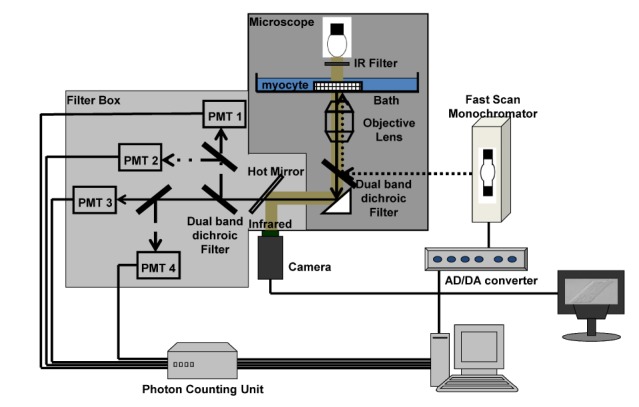
Fig. 1 A microfluorometry system for multiparameric measurement. The diagram shows the instrumentation used to measure NADH (emission, 450 nm; excitation, 361 nm), Fura-2-FF (emission, 500 nm; excitation, 353 and 400 nm), and TMRE (emission, 590 nm; excitation, 530 nm) or carboxy-SNARF-1 (emission, 590 and 640nm; excitation, 539 nm). The light from a Xenon arc lamp excited the fluoroprobes in a myocyte, and then the emission passed through a dichroic mirror and band-pass filters to measure the intensity using photon-counting devices. Near infrared from a microscope was used as a light source to visualize the myocytes during experiments using a CCD camera and monitor.
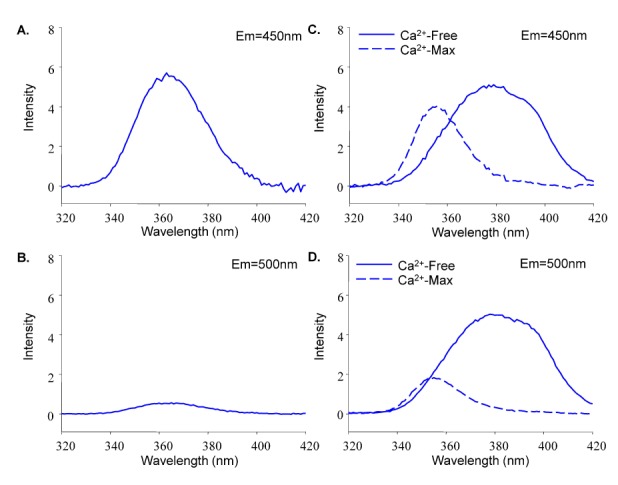
Fig. 2 The excitation spectrum of NADH-Fura-2-FF. The spectrum shows the interference between NADH and Fura-2-FF at each emission (450 and 500 nm). (A) The NADH excitation spectrum at 450-nm emission. (B) The NADH excitation spectrum at 500-nm emission. (C) The Fura-2-FF excitation spectrum at 450-nm emission under Ca2+-free and 1 mM Ca2+ conditions. (D) The Fura-2-FF excitation spectrum at 500-nm emission under Ca2+-free and 1 mM Ca2+ conditions.
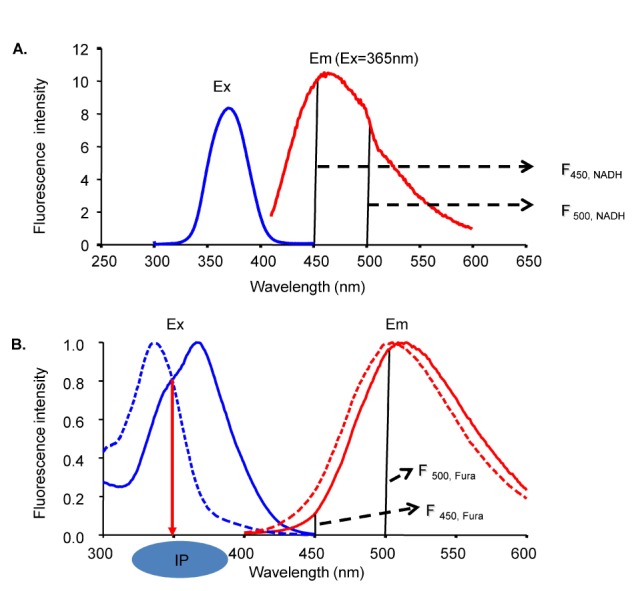
Fig. 3 NADH and Fura-2 excitation and emission spectra. (A) The NADH excitation spectrum was obtained at 465-nm emission and the emission spectrum was obtained at 365-nm excitation. (B) The Fura-2 excitation spectrum was obtained at 500-nm emission and the emission spectrum was obtained at 340-nm excitation. The emission spectrum was shifted to the left by an increase in Ca2+. Ex is excitation. Em is emission.
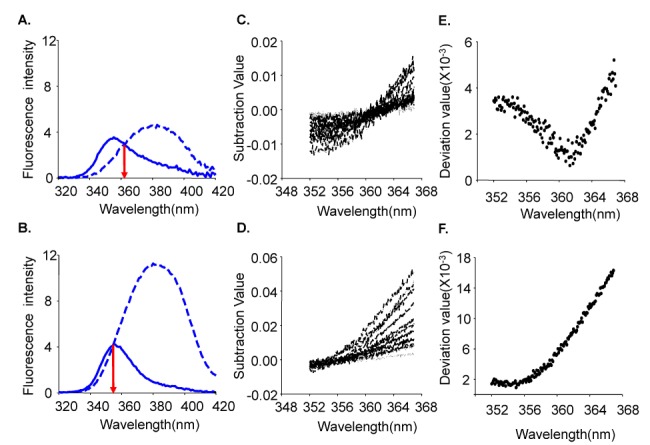
Fig. 4 Identification of isosbestic points. (A) The isosbestic point at 450-nm emission (red arrow). Ca2+ in the non-bound state (- -) and Ca2+ in the bound state (-) (B) The isosbestic point at 500-nm emission for Ca2+ in the non-bound state (- -) and Ca2+ in the bound state (-) (C) The graph shows subtracted data. Ca2+ in the non-bound state was subtracted from that in the bound state at 450 nm. (D) The graph shows subtracted data. Ca2+ in the non-bound state was subtracted from that in the bound state at 500 nm. (E) Standard deviation data from graph C. (F) Standard deviation data from graph D.
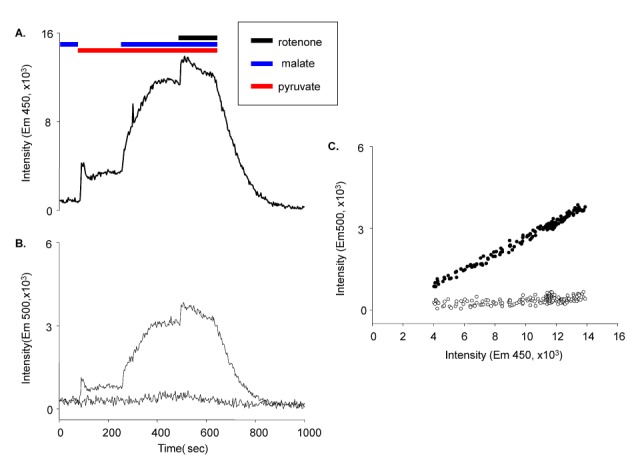
Fig. 5 Measurement of RN factors. (A) The NADH signal in Fura-2-FF-free myocytes at 361-nm excitation and 450-nm emission was measured in the presence of various mitochondrial substrates. (B) F400,500 (●) and F353,500 (-) were measured simultaneously to monitor the NADH contribution to the Fura-2-FF signal. (C) The graph shows the relationships between F361,450,NADH and F353,500,NADH (●) and between F361,450,NADH and F400,500,NADH (○). Linear relationships are evident in the graph.
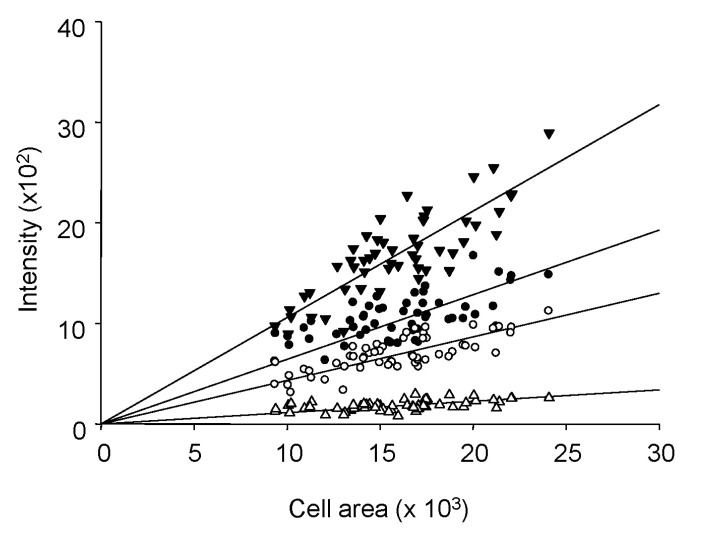
Fig. 6 Cellular area-dependent autofluorescent background. ● (F361,450) was used for NADH signal correction. ○ (F353,500) and ▾ (F400,500) were used for Fura-2-FF signal correction, respectively. ▵ (F530,590) was used for TMRE signal correction.
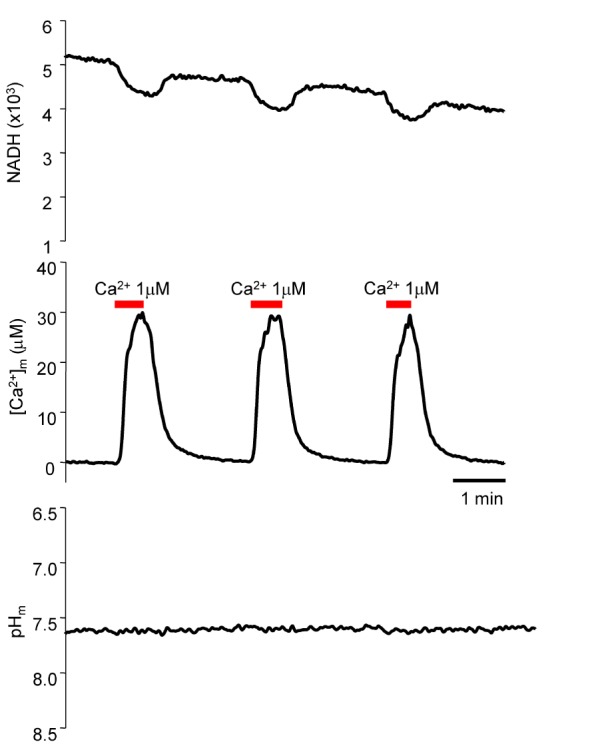
Fig. 7 Simultaneous measurement of NADH, [Ca2+]m, and pH. Using carboxy-SNARF- and Fura-2-FF-loaded myocytes, NADH, [Ca2+]m, and pH was measured simultaneously. The mitochondrial pH changes were investigated following Ca2+ changes. The increase in [Ca2+]m did not affect mitochondrial pH. Mitochondrial pH was 7.504±0.047 (mean±S.E., n=13).
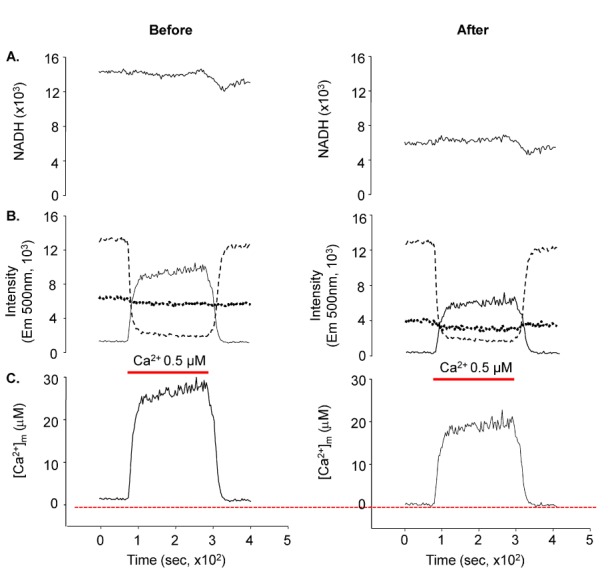
Fig. 8 Results of NADH and Fura-2-FF interference correction. The left panels show the signals prior to correction and the right panels show the signals after correction. NADH and the ratio of Fura-2-FF signals were changed following correction. The calculated [Ca2+]m was substantially decreased. (A) NADH signals at 450-nm emission. (B) Fura-2-FF signals at 500-nm emission. The figure shows F400,500 (- -), F353,500 (----), and the ratio of Fura-2-FF (-). (C) The mitochondrial calcium concentration calculated from the Fura-2-FF ratio.
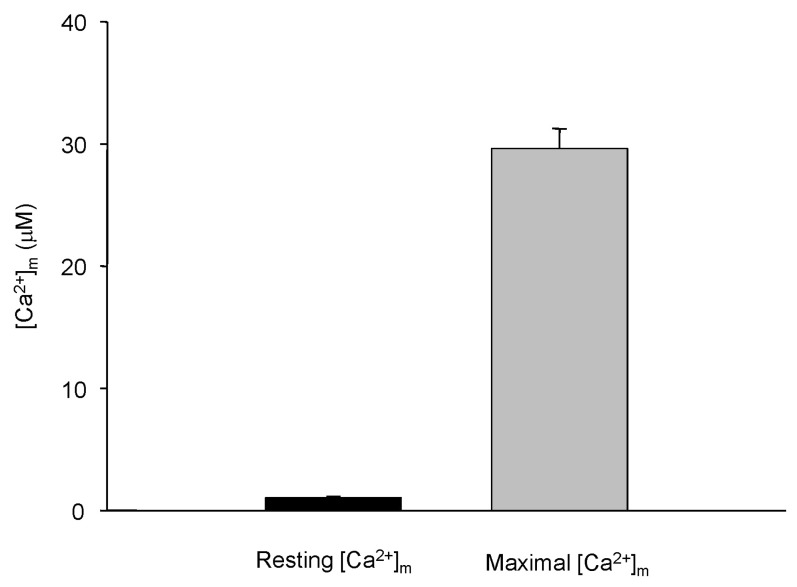
Fig. 9 Resting and maximal [Ca2+]m at l µM cytosolic Ca2+. The resting [Ca2+]m was 1.03±0.13 µM (mean±S.E., n=32) and the maximal [Ca2+]m was 29.6±1.61 µM (mean±S.E., n=33).
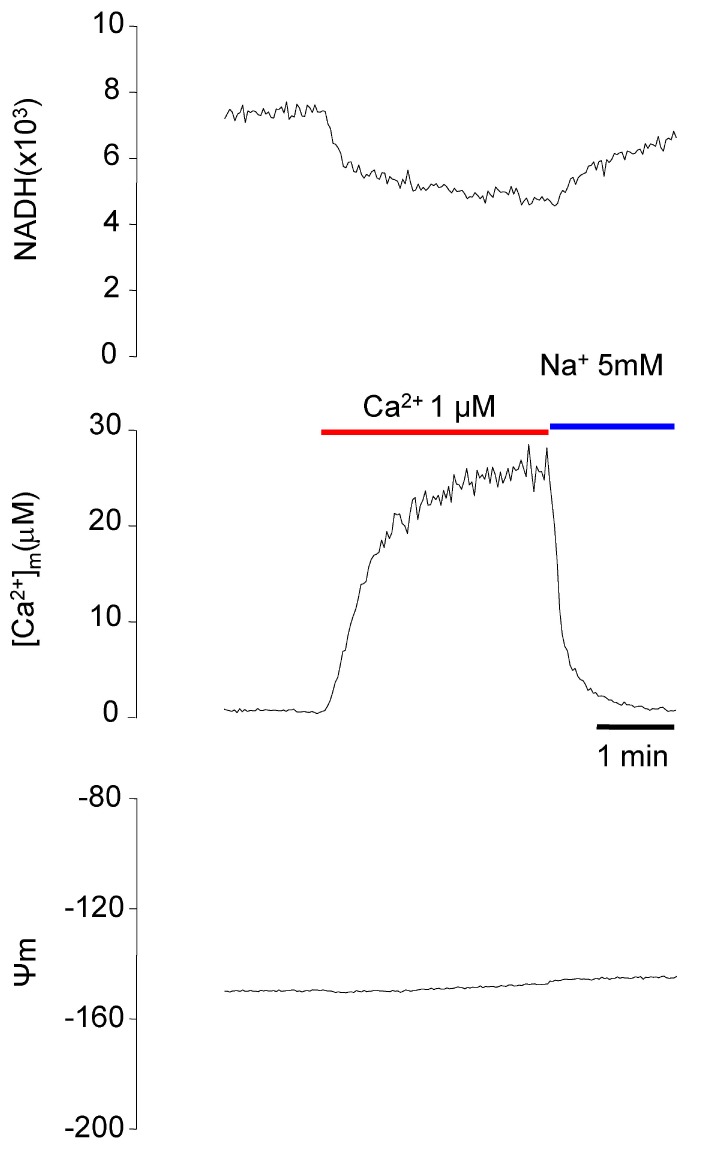
Fig. 10 Simultaneous measurement of NADH, [Ca2+]m, and Ψm. Using Fura-2-FF-loaded myocytes, NADH, [Ca2+]m, and Ψm were measured simultaneously. The resting Ψm was assumed to be -150 mV.
Reference
-
1. Bers DM. Ca influx and sarcoplasmic reticulum Ca release in cardiac muscle activation during postrest recovery. Am J Physiol. 1985; 248:H366–H381. PMID: 2579587.
Article2. Wier WG. Cytoplasmic [Ca2+] in mammalian ventricle: dynamic control by cellular processes. Annu Rev Physiol. 1990; 52:467–485. PMID: 2184764.3. Bers DM. Cardiac excitation-contraction coupling. Nature. 2002; 415:198–205. PMID: 11805843.
Article4. Duchen MR. Mitochondria in health and disease: perspectives on a new mitochondrial biology. Mol Aspects Med. 2004; 25:365–451. PMID: 15302203.
Article5. Raffaello A, Rizzuto R. Mitochondrial longevity pathways. Biochim Biophys Acta. 2011; 1813:260–268. PMID: 20950653.
Article6. Rizzuto R, Bernardi P, Pozzan T. Mitochondria as all-round players of the calcium game. J Physiol. 2000; 529(Pt 1):37–47. PMID: 11080249.
Article7. Griffiths EJ. Mitochondrial calcium transport in the heart: physiological and pathological roles. J Mol Cell Cardiol. 2009; 46:789–803. PMID: 19285504.
Article8. O'Rourke B, Cortassa S, Aon MA. Mitochondrial ion channels: gatekeepers of life and death. Physiology (Bethesda). 2005; 20:303–315. PMID: 16174870.9. Gunter TE, Buntinas L, Sparagna G, Eliseev R, Gunter K. Mitochondrial calcium transport: mechanisms and functions. Cell Calcium. 2000; 28:285–296. PMID: 11115368.
Article10. Sparagna GC, Gunter KK, Sheu SS, Gunter TE. Mitochondrial calcium uptake from physiological-type pulses of calcium. A description of the rapid uptake mode. J Biol Chem. 1995; 270:27510–27515. PMID: 7499209.11. Buntinas L, Gunter KK, Sparagna GC, Gunter TE. The rapid mode of calcium uptake into heart mitochondria (RaM): comparison to RaM in liver mitochondria. Biochim Biophys Acta. 2001; 1504:248–261. PMID: 11245789.
Article12. Beutner G, Sharma VK, Giovannucci DR, Yule DI, Sheu SS. Identification of a ryanodine receptor in rat heart mitochondria. J Biol Chem. 2001; 276:21482–21488. PMID: 11297554.
Article13. Beutner G, Sharma VK, Lin L, Ryu SY, Dirksen RT, Sheu SS. Type 1 ryanodine receptor in cardiac mitochondria: transducer of excitation-metabolism coupling. Biochim Biophys Acta. 2005; 1717:1–10. PMID: 16246297.
Article14. Carafoli E, Tiozzo R, Lugli G, Crovetti F, Kratzing C. The release of calcium from heart mitochondria by sodium. J Mol Cell Cardiol. 1974; 6:361–371. PMID: 4855051.
Article15. Brand MD. The stoichiometry of the exchange catalysed by the mitochondrial calcium/sodium antiporter. Biochem J. 1985; 229:161–166. PMID: 3929768.
Article16. Jung DW, Baysal K, Brierley GP. The sodium-calcium antiport of heart mitochondria is not electroneutral. J Biol Chem. 1995; 270:672–678. PMID: 7822294.
Article17. Poburko D, Potter K, van Breemen E, Fameli N, Liao CH, Basset O, Ruegg UT, van Breemen C. Mitochondria buffer NCX-mediated Ca2+-entry and limit its diffusion into vascular smooth muscle cells. Cell Calcium. 2006; 40:359–371. PMID: 16806462.18. Gunter TE, Chace JH, Puskin JS, Gunter KK. Mechanism of sodium independent calcium efflux from rat liver mitochondria. Biochemistry. 1983; 22:6341–6351. PMID: 6661437.19. Wingrove DE, Gunter TE. Kinetics of mitochondrial calcium transport. I. Characteristics of the sodium-independent calcium efflux mechanism of liver mitochondria. J Biol Chem. 1986; 261:15159–15165. PMID: 3771569.
Article20. Bers DM. Excitation-contraction coupling and cardiac contractile force. 2nd ed. Dordrecht, Netherlands: Kluwer Academic;2001.21. Crompton M, Moser R, Lüdi H, Carafoli E. The interrelations between the transport of sodium and calcium in mitochondria of various mammalian tissues. Eur J Biochem. 1978; 82:25–31. PMID: 23291.
Article22. Griffiths EJ, Halestrap AP. Pyrophosphate metabolism in the perfused heart and isolated heart mitochondria and its role in regulation of mitochondrial function by calcium. Biochem J. 1993; 290:489–495. PMID: 8383966.
Article23. Allen SP, Stone D, McCormack JG. The loading of fura-2 into mitochondria in the intact perfused rat heart and its use to estimate matrix Ca2+ under various conditions. J Mol Cell Cardiol. 1992; 24:765–773. PMID: 1383555.24. Miyata H, Silverman HS, Sollott SJ, Lakatta EG, Stern MD, Hansford RG. Measurement of mitochondrial free Ca2+ concentration in living single rat cardiac myocytes. Am J Physiol. 1991; 261:H1123–H1134. PMID: 1928394.25. Du C, MacGowan GA, Farkas DL, Koretsky AP. Calibration of the calcium dissociation constant of Rhod(2)in the perfused mouse heart using manganese quenching. Cell Calcium. 2001; 29:217–227. PMID: 11243930.26. Paredes RM, Etzler JC, Watts LT, Zheng W, Lechleiter JD. Chemical calcium indicators. Methods. 2008; 46:143–151. PMID: 18929663.
Article27. Hyrc KL, Bownik JM, Goldberg MP. Ionic selectivity of low-affinity ratiometric calcium indicators: mag-Fura-2, Fura-2FF and BTC. Cell Calcium. 2000; 27:75–86. PMID: 10756974.
Article28. Dong Z, Saikumar P, Griess GA, Weinberg JM, Venkatachalam MA. Intracellular Ca2+ thresholds that determine survival or death of energy-deprived cells. Am J Pathol. 1998; 152:231–240. PMID: 9422540.29. Zhao M, Hollingworth S, Baylor SM. AM-loading of fluorescent Ca2+ indicators into intact single fibers of frog muscle. Biophys J. 1997; 72:2736–2747. PMID: 9168048.30. Golovina VA, Blaustein MP. Spatially and functionally distinct Ca2+ stores in sarcoplasmic and endoplasmic reticulum. Science. 1997; 275:1643–1648. PMID: 9054358.31. London RE, Rhee CK, Murphy E, Gabel S, Levy LA. NMR-sensitive fluorinated and fluorescent intracellular calcium ion indicators with high dissociation constants. Am J Physiol. 1994; 266:C1313–C1322. PMID: 8203496.
Article32. Weinberg JM, Davis JA, Venkatachalam MA. Cytosolic-free calcium increases to greater than 100 micromolar in ATP-depleted proximal tubules. J Clin Invest. 1997; 100:713–722. PMID: 9239420.
Article33. Chance B, Schoener B, Oshino R, Itshak F, Nakase Y. Oxidation-reduction ratio studies of mitochondria in freeze-trapped samples. NADH and flavoprotein fluorescence signals. J Biol Chem. 1979; 254:4764–4771. PMID: 220260.
Article34. Eng J, Lynch RM, Balaban RS. Nicotinamide adenine dinucleotide fluorescence spectroscopy and imaging of isolated cardiac myocytes. Biophys J. 1989; 55:621–630. PMID: 2720061.
Article35. Brandes R, Bers DM. Simultaneous measurements of mitochondrial NADH and Ca2+ during increased work in intact rat heart trabeculae. Biophys J. 2002; 83:587–604. PMID: 12124250.36. Jo H, Noma A, Matsuoka S. Calcium-mediated coupling between mitochondrial substrate dehydrogenation and cardiac workload in single guinea-pig ventricular myocytes. J Mol Cell Cardiol. 2006; 40:394–404. PMID: 16480740.37. Grynkiewicz G, Poenie M, Tsien RY. A new generation of Ca2+ indicators with greatly improved fluorescence properties. J Biol Chem. 1985; 260:3440–3450. PMID: 3838314.38. Miller DJ, Smith GL. EGTA purity and the buffering of calcium ions in physiological solutions. Am J Physiol. 1984; 246:C160–C166. PMID: 6421170.
Article39. Smith GL, Miller DJ. Potentiometric measurements of stoichiometric and apparent affinity constants of EGTA for protons and divalent ions including calcium. Biochim Biophys Acta. 1985; 839:287–299. PMID: 2985122.
Article40. McGuigan JA, Kay JW, Elder HY. Critical review of the methods used to measure the apparent dissociation constant and ligand purity in Ca2+ and Mg2+ buffer solutions. Prog Biophys Mol Biol. 2006; 92:333–370. PMID: 16887174.41. Schubert J. The use of ion exchangers for the determination of physical-chemical properties of substances, particularly radiotracers, in solution; theoretical. J Phys Colloid Chem. 1948; 52:340–350. PMID: 18906407.42. Ebashi S. Calcium binding activity of vesicular relaxing factor. J Chir (Paris). 1961; 50:236–244.
Article43. Page E. Quantitative ultrastructural analysis in cardiac membrane physiology. Am J Physiol. 1978; 235:C147–C158. PMID: 364994.
Article44. Page E, McCallister LP, Power B. Sterological measurements of cardiac ultrastructures implicated in excitation-contraction coupling. Proc Natl Acad Sci U S A. 1971; 68:1465–1466. PMID: 5283936.45. Malgaroli A, Milani D, Meldolesi J, Pozzan T. Fura-2 measurement of cytosolic free Ca2+ in monolayers and suspensions of various types of animal cells. J Cell Biol. 1987; 105:2145–2155. PMID: 3680375.46. Denton RM, McCormack JG. On the role of the calcium transport cycle in heart and other mammalian mitochondria. FEBS Lett. 1980; 119:1–8.
Article47. Denton RM, McCormack JG. Ca2+ transport by mammalian mitochondria and its role in hormone action. Am J Physiol. 1985; 249:E543–E554. PMID: 2417490.48. Denton RM, McCormack JG. Ca2+ as a second messenger within mitochondria of the heart and other tissues. Annu Rev Physiol. 1990; 52:451–466. PMID: 2184763.49. Hansford RG. Relation between mitochondrial calcium transport and control of energy metabolism. Rev Physiol Biochem Pharmacol. 1985; 102:1–72. PMID: 2863864.
Article50. Hansford RG. Relation between cytosolic free Ca2+ concentration and the control of pyruvate dehydrogenase in isolated cardiac myocytes. Biochem J. 1987; 241:145–151. PMID: 2436608.51. McCormack JG, Halestrap AP, Denton RM. Role of calcium ions in regulation of mammalian intramitochondrial metabolism. Physiol Rev. 1990; 70:391–425. PMID: 2157230.
Article52. Kirichok Y, Krapivinsky G, Clapham DE. The mitochondrial calcium uniporter is a highly selective ion channel. Nature. 2004; 427:360–364. PMID: 14737170.
Article53. Al-Nasser I, Crompton M. The reversible Ca2+-induced permeabilization of rat liver mitochondria. Biochem J. 1986; 239:19–29. PMID: 3099778.54. Crompton M. The mitochondrial permeability transition pore and its role in cell death. Biochem J. 1999; 341:233–249. PMID: 10393078.
Article55. Halestrap AP, Clarke SJ, Javadov SA. Mitochondrial permeability transition pore opening during myocardial reperfusion--a target for cardioprotection. Cardiovasc Res. 2004; 61:372–385. PMID: 14962470.
Article56. Halestrap AP, McStay GP, Clarke SJ. The permeability transition pore complex: another view. Biochimie. 2002; 84:153–166. PMID: 12022946.
Article57. Rasmussen H, Barrett PQ. Calcium messenger system: an integrated view. Physiol Rev. 1984; 64:938–984. PMID: 6330778.
Article58. Gunter TE, Gunter KK, Sheu SS, Gavin CE. Mitochondrial calcium transport: physiological and pathological relevance. Am J Physiol. 1994; 267:C313–C339. PMID: 8074170.
Article59. Carafoli E, Lehninger AL. A survey of the interaction of calcium ions with mitochondria from different tissues and species. Biochem J. 1971; 122:681–690. PMID: 5129264.
Article60. Carafoli E. Mitochondria, Ca2+ transport and the regulation of heart contraction and metabolism. J Mol Cell Cardiol. 1975; 7:83–87. PMID: 123597.
- Full Text Links
-
- Actions
-
Cited
- CITED
-
- Close
- Share
-
- Similar articles
-
- A Computational Model of Cytosolic and Mitochondrial [Ca2+] in Paced Rat Ventricular Myocytes
- Recent trends in two-photon auto-fluorescence lifetime imaging (2P-FLIM) and its biomedical applications
- Effect of hypothermic cardioplegia on cardiac protection--I. Effect of hypothermic cardioplegia on the cytosolic Ca2+ concentration in rat ventricular myocytes
- Effects of ryanodine on the intracellular Na+ activity and tension and action potentials of rat and guinea pig cardiac ventricular muscles
- Changes of Cytosolic Ca2+ under Metabolic Inhibition in Isolated Rat Ventricular Myocytes
