Asthma-Predictive Genetic Markers in Gene Expression Profiling of Peripheral Blood Mononuclear Cells
- Affiliations
-
- 1Genome Research Center for Allergy and Respiratory Disease, Soonchunhyang University Bucheon Hospital, Bucheon, Korea. mdcspark@unitel.co.kr
- 2Genomictree Inc., Daejeon, Korea. genomictree1@korea.com
- 3Division of Allergy and Respiratory Medicine, Department of Internal Medicine, Soonchunhyang University Bucheon Hospital, Bucheon, Korea.
- 4Division of Allergy and Respiratory Medicine, Soonchunhyang University Seoul Hospital, Seoul, Korea.
- KMID: 2167078
- DOI: http://doi.org/10.4168/aair.2011.3.4.265
Abstract
- PURPOSE
We sought to identify asthma-related genes and to examine the potential of these genes to predict asthma, based on expression levels.
METHODS
The subjects were 42 asthmatics and 10 normal healthy controls. PBMC RNA was subjected to microarray analysis using a 35K array; t-tests were used to identify genes that were expressed differentially between the two groups. A multiple logistic regression analysis was applied to the differentially expressed genes, and area under the curve (AUC) values from receiver operating characteristic (ROC) curves were obtained.
RESULTS
In total, 170 genes were selected using the following criteria: P< or =0.001 and > or =2-fold change. Among these genes, 57 were up-regulated and 113 were down-regulated in asthmatics versus normal controls. A multiple logistic regression analysis was done using more stringent criteria (P< or =0.001 and > or =5-fold change), and eight genes were selected as candidate asthma biomarkers. Using these genes, 255 models (2(8)-1) were generated. Among them, only 85 showed P< or =0.05 by multiple logistic regression analysis. Based on the AUCs from ROC curves for the 85 models, we found that the best model consisted of the genes MEPE, MLSTD1, and TRIM37. The model showed 0.9928 of the AUC with 98% sensitivity and 80% specificity.
CONCLUSIONS
MEPE, MLSTD1, and TRIM37 may be useful biomarkers for asthma.
Keyword
MeSH Terms
Figure
-
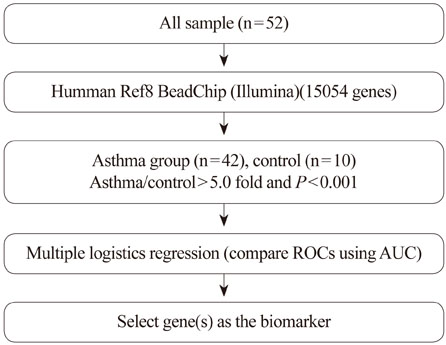
Fig. 1 Gene expression profiling strategy and general workflow.

Fig. 2 (A) Volcano graph. The x-axis represents the logarithm of the fold-change value, while the y-axis represents the negative logarithm of the P value. A and B denote areas satisfying the following criteria: ≥2-fold change and P≤0.001. (B) Hierarchical clustering graph and heat map.
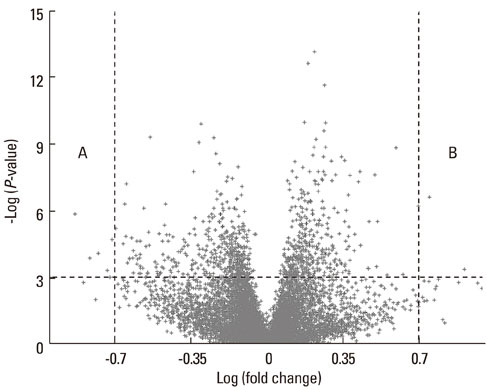
Fig. 3 Volcano graph. The x-axis represents the logarithm of the fold-change value, while the y-axis represents the negative logarithm of the P value. A and B denote areas satisfying the following criteria: ≥5-fold change and P≤0.001.
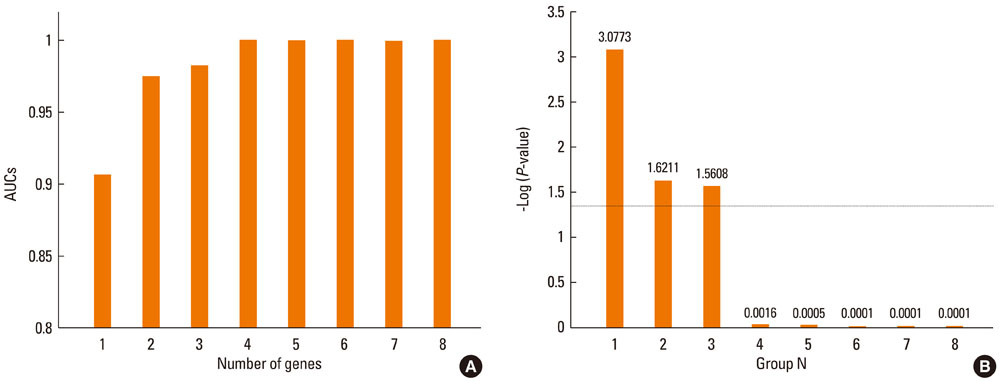
Fig. 4 (A) Distribution of the average AUCs for the top five in group n. (B) Distribution of the average log of the P values for the top five in group n. The dashed line indicates the cut-off value (P<0.05).

Fig. 5 (A) Values of the AUCs for each of the eight genes, two-gene combinations, and three-gene combinations. (B) ROC curve of the best model, consisting of MEPE, MLSTD1, and TRIM37 (P value: 0.000001; asymptotic 95% confidence interval lower bound: 0.977, upper bound: 1; AUC: 0.9928).
Reference
-
1. Bateman ED, Hurd SS, Barnes PJ, Bousquet J, Drazen JM, FitzGerald M, Gibson P, Ohta K, O'Byrne P, Pedersen SE, Pizzichini E, Sullivan SD, Wenzel SE, Zar HJ. Global strategy for asthma management and prevention: GINA executive summary. Eur Respir J. 2008. 31:143–178.2. Cohn L, Elias JA, Chupp GL. Asthma: mechanisms of disease persistence and progression. Annu Rev Immunol. 2004. 22:789–815.3. Sengler C, Lau S, Wahn U, Nickel R. Interactions between genes and environmental factors in asthma and atopy: new developments. Respir Res. 2002. 3:7.4. De Vos J, Thykjaer T, Tarte K, Ensslen M, Raynaud P, Requirand G, Pellet F, Pantesco V, Rème T, Jourdan M, Rossi JF, Ørntoft T, Klein B. Comparison of gene expression profiling between malignant and normal plasma cells with oligonucleotide arrays. Oncogene. 2002. 21:6848–6857.5. Alon U, Barkai N, Notterman DA, Gish K, Ybarra S, Mack D, Levine AJ. Broad patterns of gene expression revealed by clustering analysis of tumor and normal colon tissues probed by oligonucleotide arrays. Proc Natl Acad Sci U S A. 1999. 96:6745–6750.6. Laprise C, Sladek R, Ponton A, Bernier MC, Hudson TJ, Laviolette M. Functional classes of bronchial mucosa genes that are differentially expressed in asthma. BMC Genomics. 2004. 5:21.7. Lilly CM, Tateno H, Oguma T, Israel E, Sonna LA. Effects of allergen challenge on airway epithelial cell gene expression. Am J Respir Crit Care Med. 2005. 171:579–586.8. Yang SH, Kim JS, Oh TJ, Kim MS, Lee SW, Woo SK, Cho HS, Choi YH, Kim YH, Rha SY, Chung HC, An SW. Genome-scale analysis of resveratrol-induced gene expression profile in human ovarian cancer cells using a cDNA microarray. Int J Oncol. 2003. 22:741–750.9. Chamberland A, Madore AM, Tremblay K, Laviolette M, Laprise C. A comparison of two sets of microarray experiments to define allergic asthma expression pattern. Exp Lung Res. 2009. 35:399–410.10. Baines KJ, Wood LG, Gibson PG. The nutrigenomics of asthma: molecular mechanisms of airway neutrophilia following dietary antioxidant withdrawal. OMICS. 2009. 13:355–365.11. Guajardo JR, Schleifer KW, Daines MO, Ruddy RM, Aronow BJ, Wills-Karp M, Hershey GK. Altered gene expression profiles in nasal respiratory epithelium reflect stable versus acute childhood asthma. J Allergy Clin Immunol. 2005. 115:243–251.12. Kavuru MS, Dweik RA, Thomassen MJ. Role of bronchoscopy in asthma research. Clin Chest Med. 1999. 20:153–189.13. Hansel NN, Hilmer SC, Georas SN, Cope LM, Guo J, Irizarry RA, Diette GB. Oligonucleotide-microarray analysis of peripheral-blood lymphocytes in severe asthma. J Lab Clin Med. 2005. 145:263–274.14. Katsunuma T, Kawahara H, Suda T, Ishii T, Ohya Y, Akasawa A, Saito H, Oshida T, Sugita Y. Analysis of gene expressions of T cells from children with acute exacerbations of asthma. Int Arch Allergy Immunol. 2004. 134:29–33.15. Aoki T, Matsumoto Y, Hirata K, Ochiai K, Okada M, Ichikawa K, Shibasaki M, Arinami T, Sumazaki R, Noguchi E. Expression profiling of genes related to asthma exacerbations. Clin Exp Allergy. 2009. 39:213–221.16. Subrata LS, Bizzintino J, Mamessier E, Bosco A, McKenna KL, Wikström ME, Goldblatt J, Sly PD, Hales BJ, Thomas WR, Laing IA, LeSouëf PN, Holt PG. Interactions between innate antiviral and atopic immunoinflammatory pathways precipitate and sustain asthma exacerbations in children. J Immunol. 2009. 183:2793–2800.17. Kraft P, Wacholder S, Cornelis MC, Hu FB, Hayes RB, Thomas G, Hoover R, Hunter DJ, Chanock S. Beyond odds ratios--communicating disease risk based on genetic profiles. Nat Rev Genet. 2009. 10:264–269.18. Chomczynski P, Sacchi N. Single-step method of RNA isolation by acid guanidinium thiocyanate-phenol-chloroform extraction. Anal Biochem. 1987. 162:156–159.19. Bradley AP. The use of the area under the ROC curve in the evaluation of machine learning algorithms. Pattern Recognit. 1997. 30:1145–1159.20. Fawcett T. An introduction to ROC analysis. Pattern Recognit Lett. 2006. 27:861–874.21. Kuperman DA, Lewis CC, Woodruff PG, Rodriguez MW, Yang YH, Dolganov GM, Fahy JV, Erle DJ. Dissecting asthma using focused transgenic modeling and functional genomics. J Allergy Clin Immunol. 2005. 116:305–311.22. Woodruff PG, Boushey HA, Dolganov GM, Barker CS, Yang YH, Donnelly S, Ellwanger A, Sidhu SS, Dao-Pick TP, Pantoja C, Erle DJ, Yamamoto KR, Fahy JV. Genome-wide profiling identifies epithelial cell genes associated with asthma and with treatment response to corticosteroids. Proc Natl Acad Sci U S A. 2007. 104:15858–15863.23. Kruskal WH, Tanur JM. Linear hypotheses. International encyclopedia of statistics. 1978. Vol. 1. New York: Free Press;523–541.24. Chong PK, Lee H, Zhou J, Liu SC, Loh MC, Wang TT, Chan SP, Smoot DT, Ashktorab H, So JB, Lim KH, Yeoh KG, Lim YP. ITIH3 is a potential biomarker for early detection of gastric cancer. J Proteome Res. 2010. 9:3671–3679.25. Peat G, Thomas E, Duncan R, Wood L. Is a "false-positive" clinical diagnosis of knee osteoarthritis just the early diagnosis of pre-radiographic disease? Arthritis Care Res (Hoboken). 2010. 62:1502–1506.26. Rom WN, Goldberg JD, Addrizzo-Harris D, Watson HN, Khilkin M, Greenberg AK, Naidich DP, Crawford B, Eylers E, Liu D, Tan EM. Identification of an autoantibody panel to separate lung cancer from smokers and nonsmokers. BMC Cancer. 2010. 10:234.27. Cheng JB, Russell DW. Mammalian wax biosynthesis. I. Identification of two fatty acyl-Coenzyme A reductases with different substrate specificities and tissue distributions. J Biol Chem. 2004. 279:37789–37797.28. Grantham J, Brackley KI, Willison KR. Substantial CCT activity is required for cell cycle progression and cytoskeletal organization in mammalian cells. Exp Cell Res. 2006. 312:2309–2324.
- Full Text Links
-
- Actions
-
Cited
- CITED
-
- Close
- Share
-
- Similar articles
-
- Effect of Leukapheresis on Gene Expression Profiles of Donor's Peripheral Blood Mononuclear Cells
- A Global Gene Expression Analysis of the Peripheral Blood Mononuclear Cells Reveals the Gene Expression Signature in Psoriasis
- Tumor Necrosis Factor-alpha Gene Signature Is Absent in Peripheral Blood Mononuclear Cells of Patients with Granulomatosis Polyangiitis
- Gene - Gene Interactions Among MCP Genes Polymorphisms in Asthma
- Expression of WT1 Gene in Childhood Acute Leukemia
