Determination of Optimal Scan Time for the Measurement of Downstream Metabolites in Hyperpolarized 13C MRSI
- Affiliations
-
- 1Department of Electrical & Electronic Engineering, Yonsei University, Seoul, Korea. donghyunkim@yonsei.ac.kr
- 2Center for Neuroscience Imaging Research, Institute for Basic Science, Sungkyunkwan University, Gyeonggi-do, Korea.
- 3Department of Radiology, Yonsei University College of Medicine, Seoul, Korea.
- KMID: 2151767
- DOI: http://doi.org/10.13104/imri.2015.19.4.212
Abstract
- PURPOSE
For a single time-point hyperpolarized 13C magnetic resonance spectroscopy imaging (MRSI) of animal models, scan-time window after injecting substrates is critical in terms of signal-to-noise ratio (SNR) of downstream metabolites. Prescans of time-resolved magnetic resonance spectroscopy (MRS) can be performed to determine the scan-time window. In this study, based on two-site exchange model, protocol-specific simulation approaches were developed for 13C MRSI and the optimal scan-time window was determined to maximize the SNR of downstream metabolites.
MATERIALS AND METHODS
The arterial input function and conversion rate constant from injected substrates (pyruvate) to downstream metabolite (lactate) were precalibrated, based on pre-scans of time-resolved MRS. MRSI was simulated using twosite exchange model with considerations of scan parameters of MRSI. Optimal scantime window for mapping lactate was chosen from simulated lactate intensity maps. The performance was validated by multiple in vivo experiments of BALB/C nude mice with MDA-MB-231 breast tumor cells. As a comparison, MRSI were performed with other scan-time windows simply chosen from the lactate signal intensities of prescan time-resolved MRS.
RESULTS
The optimal scan timing for our animal models was determined by simulation, and was found to be 15 s after injection of the pyruvate. Compared to the simple approach, we observed that the lactate peak signal to noise ratio (PSNR) was increased by 230%.
CONCLUSIONS
Optimal scan timing to measure downstream metabolites using hyperpolarized 13C MRSI can be determined by the proposed protocol-specific simulation approaches.
Keyword
MeSH Terms
Figure
-
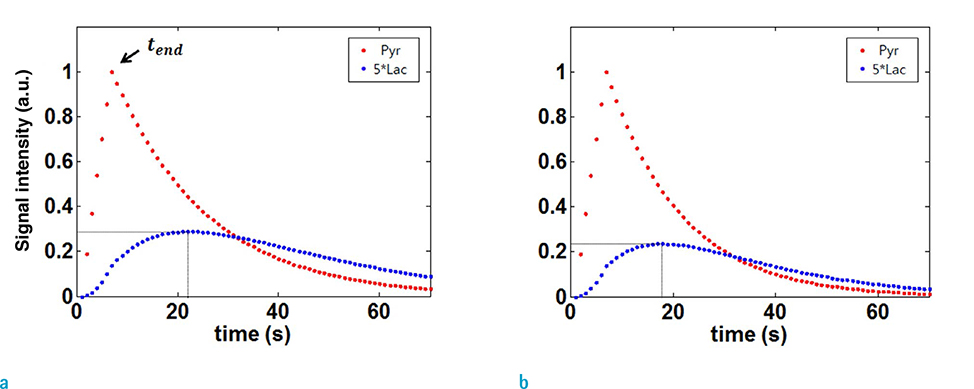
Fig. 1 Simulation of two-site exchange model (a) without and (b) with RF excitation of FA = 10°. Temporal resolution for two-site exchange simulation was 1 s (kpyr→lac = 0.0063 s-1, T1 = 21 s). In simulated dynamic curve, peak of the lactate signal appeared (a) 22 s and (b) 18 s after pyruvate arrival, respectively.

Fig. 2 (a) Simulated lactate signal intensities in hyperpolarized 13C MRSI based on two-site exchange model with multiple kpyr→lac values and acquisition timing with FA = 10°, T1 = 21 s. (b) The optimal scan timing for each kpyr→lac. The optimal scan time for the estimated kpyr→lac, 0.0063, was about 15 s after tend. (c) The lactate signal intensities in MRSI with different scan timings; optimal timing (red line), 7 s after tend (blue line), and 15 s after tend (green line). For estimated kpyr→lac value of 0.0063, lactate signal intensity acquired at 7 s after tend was 10% less than optimal timing. The lactate signal intensity acquired at 15 s after tend was 0.01% less than optimal timing.
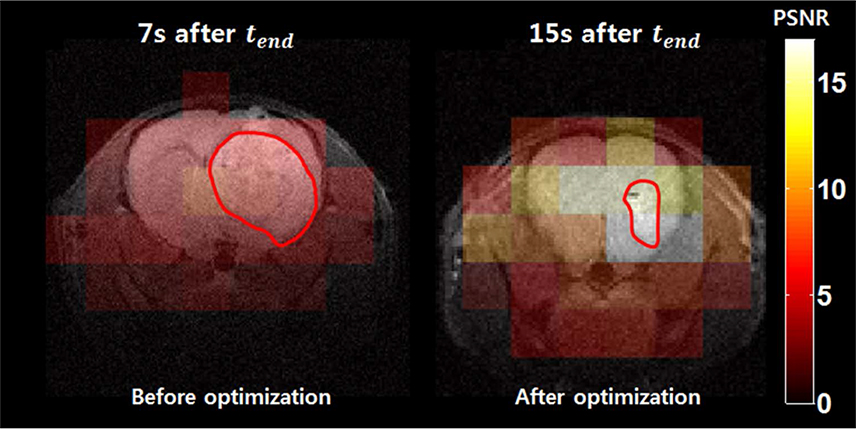
Fig. 3 Comparison of lactate map acquired at (a) control, 7 s after tend and (b) optimized timing, 15 s after tend, overlaid with 1H anatomical image. The lactate map was obtained by measuring peak signal-to-noise ratio (PSNR) of lactate in each voxel. The PSNR corresponding tumor voxels was 8 ± 4.6 for 7 s after tend, and 18.5 ± 3.1 for 15 s after tend (n = 3 per measurement). The boundary of tumor implanted in mice brain is represented as a red line.
Reference
-
1. Golman K, Zandt RI, Lerche M, Pehrson R, Ardenkjaer-Larsen JH. Metabolic imaging by hyperpolarized 13C magnetic resonance imaging for in vivo tumor diagnosis. Cancer Res. 2006; 66:10855–10860.2. Day SE, Kettunen MI, Gallagher FA, et al. Detecting tumor response to treatment using hyperpolarized 13C magnetic resonance imaging and spectroscopy. Nat Med. 2007; 13:1382–1387.3. Ardenkjaer-Larsen JH, Fridlund B, Gram A, et al. Increase in signal-to-noise ratio of > 10,000 times in liquid-state NMR. Proc Natl Acad Sci U S A. 2003; 100:10158–10163.4. Golman K, Zandt RI, Thaning M. Real-time metabolic imaging. Proc Natl Acad Sci U S A. 2006; 103:11270–11275.5. Darpolor MM, Yen YF, Chua MS, et al. In vivo MRSI of hyperpolarized [1-(13)C]pyruvate metabolism in rat hepatocellular carcinoma. NMR Biomed. 2011; 24:506–513.6. Harris T, Eliyahu G, Frydman L, Degani H. Kinetics of hyperpolarized 13C1-pyruvate transport and metabolism in living human breast cancer cells. Proc Natl Acad Sci U S A. 2009; 106:18131–18136.7. Lau AZ, Chen AP, Ghugre NR, et al. Rapid multislice imaging of hyperpolarized 13C pyruvate and bicarbonate in the heart. Magn Reson Med. 2010; 64:1323–1331.8. Schroeder MA, Cochlin LE, Heather LC, Clarke K, Radda GK, Tyler DJ. In vivo assessment of pyruvate dehydrogenase flux in the heart using hyperpolarized carbon-13 magnetic resonance. Proc Natl Acad Sci U S A. 2008; 105:12051–12056.9. Kohler SJ, Yen Y, Wolber J, et al. In vivo 13 carbon metabolic imaging at 3T with hyperpolarized 13C-1-pyruvate. Magn Reson Med. 2007; 58:65–69.10. Zierhut ML, Yen YF, Chen AP, et al. Kinetic modeling of hyperpolarized 13C1-pyruvate metabolism in normal rats and TRAMP mice. J Magn Reson. 2010; 202:85–92.
- Full Text Links
-
- Actions
-
Cited
- CITED
-
- Close
- Share
-
- Similar articles
-
- Optimization of Scan Parameters for in vivo Hyperpolarized Carbon-13 Magnetic Resonance Spectroscopic Imaging
- Alternating Acquisition Technique for Quantification of in vitro Hyperpolarized [1-13C] Pyruvate Metabolism
- Dual Component Analysis for In Vivo T₂* Decay of Hyperpolarized ¹³C Metabolites
- The Accuracy of Axial Length Measurement Using Partial Coherence Interferometrys
- Validity of 38 mg Low Dose 13C-Urea Breath Test for the Diagnosis of Helicobacter pylori Infection
