Estimation of T2* Relaxation Time of Breast Cancer: Correlation with Clinical, Imaging and Pathological Features
- Affiliations
-
- 1Department of Radiology, Kyung Hee University Hospital, College of Medicine, Kyung Hee University, Seoul 02447, Korea.
- 2Department of Radiology, Kyung Hee University Hospital at Gangdong, College of Medicine, Kyung Hee University, Seoul 05278, Korea. oddie2@naver.com
- 3Department of Pathology, Kyung Hee University Hospital at Gangdong, College of Medicine, Kyung Hee University, Seoul 05278, Korea.
- KMID: 2468136
- DOI: http://doi.org/10.3348/kjr.2017.18.1.238
Abstract
OBJECTIVE
The purpose of this study was to estimate the T2* relaxation time in breast cancer, and to evaluate the association between the T2* value with clinical-imaging-pathological features of breast cancer.
MATERIALS AND METHODS
Between January 2011 and July 2013, 107 consecutive women with 107 breast cancers underwent multi-echo T2*-weighted imaging on a 3T clinical magnetic resonance imaging system. The Student's t test and one-way analysis of variance were used to compare the T2* values of cancer for different groups, based on the clinical-imaging-pathological features. In addition, multiple linear regression analysis was performed to find independent predictive factors associated with the T2* values.
RESULTS
Of the 107 breast cancers, 92 were invasive and 15 were ductal carcinoma in situ (DCIS). The mean T2* value of invasive cancers was significantly longer than that of DCIS (p = 0.029). Signal intensity on T2-weighted imaging (T2WI) and histologic grade of invasive breast cancers showed significant correlation with T2* relaxation time in univariate and multivariate analysis. Breast cancer groups with higher signal intensity on T2WI showed longer T2* relaxation time (p = 0.005). Cancer groups with higher histologic grade showed longer T2* relaxation time (p = 0.017).
CONCLUSION
The T2* value is significantly longer in invasive cancer than in DCIS. In invasive cancers, T2* relaxation time is significantly longer in higher histologic grades and high signal intensity on T2WI. Based on these preliminary data, quantitative T2* mapping has the potential to be useful in the characterization of breast cancer.
MeSH Terms
Figure
-
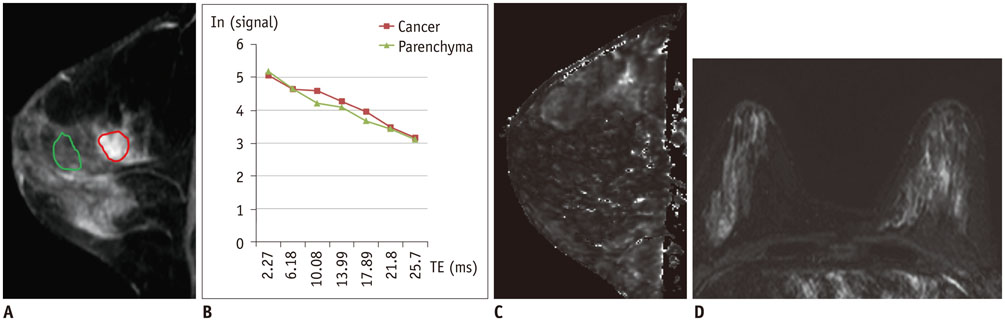
Fig. 1 T2* relaxation time mapping from 55-year-old woman with ductal carcinoma in situ. A. Sagittal contrast-enhanced T1-weighted image shows heterogeneous non-mass enhancement left breast. Region of interest of breast cancer (red) and normal parenchyma (green) was manually outlined and later copied onto T2* map. B. Signal intensity changes on MR images were used to calculate intrinsic T2* relaxivity. R2* values were found by taking negative of linear slope of signal intensity plotted against echo time (TE) for each voxel, of which the gradient is–R2* (measured in 1/ms). Reciprocal of R2* was T2*. C. T2* map shows similar T2* value in breast cancer compared with surrounding glandular tissue. Mean T2* value of breast cancer and parenchyma were 22.7 and 18.9 ms, respectively. D. On coronal T2-weighted image, cancer in left breast was not prominent and classified as iso- signal intensity compared with breast parenchyma.
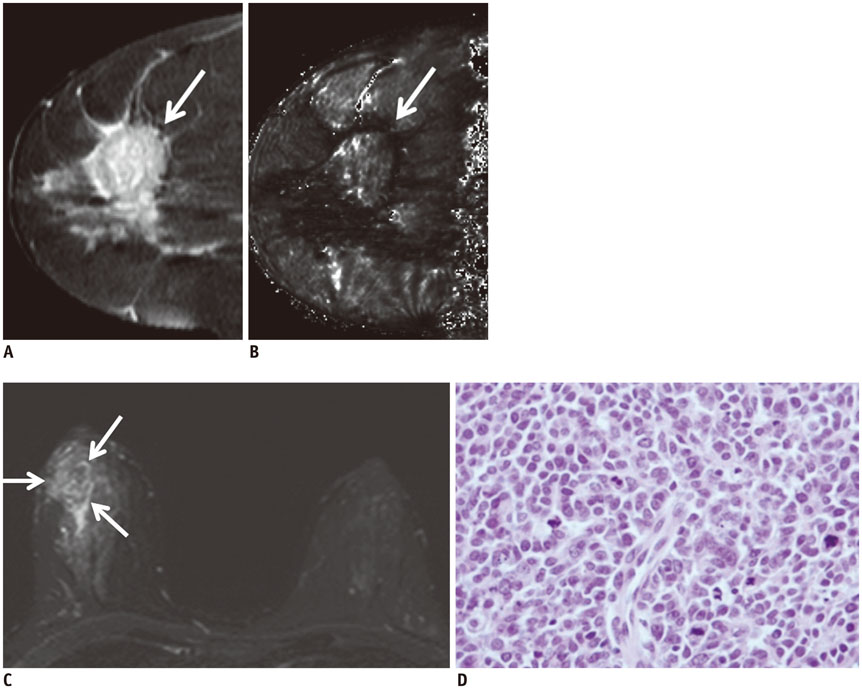
Fig. 2 Representative case in 44-year-old woman with high-grade invasive ductal carcinoma. A. Sagittal contrast-enhanced T1-weighted image shows heterogeneous enhancing mass (arrow) in right breast middle portion. B. T2* map shows increased T2* value in breast cancer (arrow) compared with surrounding glandular tissue. Mean T2* value of breast cancer and normal parenchyma were 50.6 and 35.2 ms, respectively. C. Coronal T2-weighted image shows high signal intensity mass accompanying peritumoral edema in right breast (arrows), which was classified as very high signal intensity. D. Histopathological image shows high cellularity, no tubule formation, and little collagen matrix (hematoxylin and eosin stain, × 400).
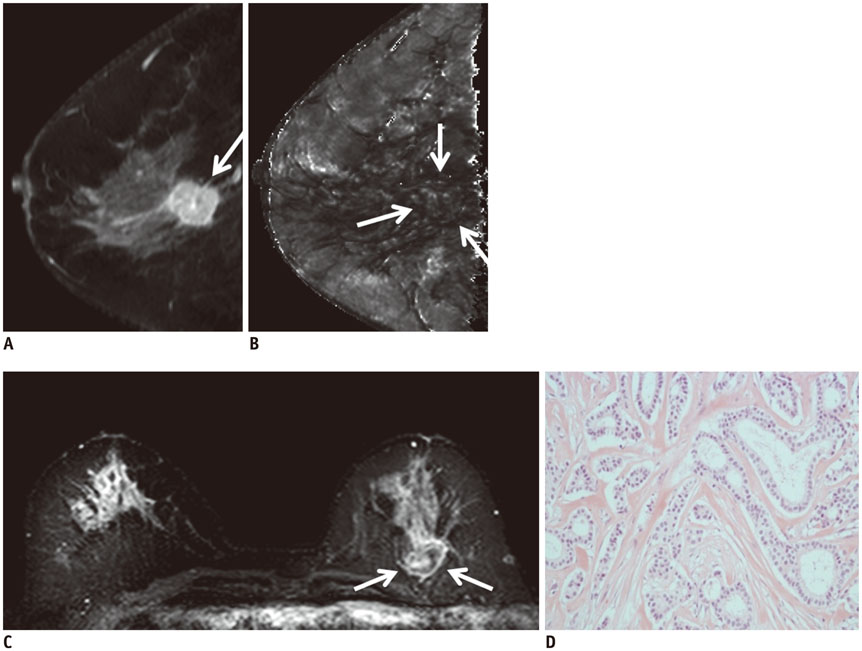
Fig. 3 Representative case in 72-year-old woman with low-grade invasive ductal carcinoma. A. Sagittal contrast-enhanced T1-weighted image shows posterior located enhancing mass (arrow). B. T2* map shows similar T2* value in breast cancer (arrows) compared with surrounding glandular tissue. Mean T2* value of breast cancer and normal parenchyma were 23.4 and 23.4 ms, respectively. C. Coronal T2-weighted image shows mass in left breast which is located posterior to breast parenchyma and has slightly higher signal intensity compared to breast parenchyma (arrows). D. Histopathological image shows increased tubule and gland formation, and rich collagen matrix (hematoxylin and eosin stain, × 200).
Cited by 1 articles
-
Age of Data in Contemporary Research Articles Published in Representative General Radiology Journals
Ji Hun Kang, Dong Hwan Kim, Seong Ho Park, Jung Hwan Baek
Korean J Radiol. 2018;19(6):1172-1178. doi: 10.3348/kjr.2018.19.6.1172.
Reference
-
1. Kriege M, Brekelmans CT, Boetes C, Besnard PE, Zonderland HM, Obdeijn IM, et al. Efficacy of MRI and mammography for breast-cancer screening in women with a familial or genetic predisposition. N Engl J Med. 2004; 351:427–437.2. Kuhl CK, Schrading S, Leutner CC, Morakkabati-Spitz N, Wardelmann E, Fimmers R, et al. Mammography, breast ultrasound, and magnetic resonance imaging for surveillance of women at high familial risk for breast cancer. J Clin Oncol. 2005; 23:8469–8476.3. Leach MO, Boggis CR, Dixon AK, Easton DF, Eeles RA, Evans DG, et al. Screening with magnetic resonance imaging and mammography of a UK population at high familial risk of breast cancer: a prospective multicentre cohort study (MARIBS). Lancet. 2005; 365:1769–1778.4. Ko ES, Han H, Han BK, Kim SM, Kim RB, Lee GW, et al. Prognostic significance of a complete response on breast MRI in patients who received neoadjuvant chemotherapy according to the molecular subtype. Korean J Radiol. 2015; 16:986–995.5. Obdeijn IM, Loo CE, Rijnsburger AJ, Wasser MN, Bergers E, Kok T, et al. Assessment of false-negative cases of breast MR imaging in women with a familial or genetic predisposition. Breast Cancer Res Treat. 2010; 119:399–407.6. Pages EB, Millet I, Hoa D, Doyon FC, Taourel P. Undiagnosed breast cancer at MR imaging: analysis of causes. Radiology. 2012; 264:40–50.7. Yoon JH, Kim MJ, Kim EK, Moon HJ. Imaging surveillance of patients with breast cancer after primary treatment: current recommendations. Korean J Radiol. 2015; 16:219–228.8. Huang W, Fisher PR, Dulaimy K, Tudorica LA, O'Hea B, Button TM. Detection of breast malignancy: diagnostic MR protocol for improved specificity. Radiology. 2004; 232:585–591.9. Gruber S, Debski BK, Pinker K, Chmelik M, Grabner G, Helbich T, et al. Three-dimensional proton MR spectroscopic imaging at 3 T for the differentiation of benign and malignant breast lesions. Radiology. 2011; 261:752–761.10. Yabuuchi H, Matsuo Y, Okafuji T, Kamitani T, Soeda H, Setoguchi T, et al. Enhanced mass on contrast-enhanced breast MR imaging: lesion characterization using combination of dynamic contrast-enhanced and diffusion-weighted MR images. J Magn Reson Imaging. 2008; 28:1157–1165.11. Kul S, Cansu A, Alhan E, Dinc H, Gunes G, Reis A. Contribution of diffusion-weighted imaging to dynamic contrast-enhanced MRI in the characterization of breast tumors. AJR Am J Roentgenol. 2011; 196:210–217.12. Seo M, Cho N, Bae MS, Koo HR, Kim WH, Lee SH, et al. Features of undiagnosed breast cancers at screening breast MR imaging and potential utility of computer-aided evaluation. Korean J Radiol. 2016; 17:59–68.13. Chavhan GB, Babyn PS, Thomas B, Shroff MM, Haacke EM. Principles, techniques, and applications of T2*-based MR imaging and its special applications. Radiographics. 2009; 29:1433–1449.14. González Hernando C, Esteban L, Cañas T, Van den Brule E, Pastrana M. The role of magnetic resonance imaging in oncology. Clin Transl Oncol. 2010; 12:606–613.15. Padhani AR, Krohn KA, Lewis JS, Alber M. Imaging oxygenation of human tumours. Eur Radiol. 2007; 17:861–872.16. Busk M, Horsman MR. Relevance of hypoxia in radiation oncology: pathophysiology, tumor biology and implications for treatment. Q J Nucl Med Mol Imaging. 2013; 57:219–234.17. McPhail LD, Robinson SP. Intrinsic susceptibility MR imaging of chemically induced rat mammary tumors: relationship to histologic assessment of hypoxia and fibrosis. Radiology. 2010; 254:110–118.18. Li SP, Taylor NJ, Makris A, Ah-See ML, Beresford MJ, Stirling JJ, et al. Primary human breast adenocarcinoma: imaging and histologic correlates of intrinsic susceptibility-weighted MR imaging before and during chemotherapy. Radiology. 2010; 257:643–652.19. Liu M, Guo X, Wang S, Jin M, Wang Y, Li J, et al. BOLD-MRI of breast invasive ductal carcinoma: correlation of R2* value and the expression of HIF-1α. Eur Radiol. 2013; 23:3221–3327.20. Padhani A. Science to practice: what does MR oxygenation imaging tell us about human breast cancer hypoxia? Radiology. 2010; 254:1–3.21. Ryu JK, Oh JH, Kim HG, Rhee SJ, Seo M, Jahng GH. Estimation of T2* relaxation times for the glandular tissue and fat of breast at 3T MRI system. J Korean Soc Magn Reson Med. 2014; 18:1–6.22. Uematsu T, Kasami M, Yuen S. Triple-negative breast cancer: correlation between MR imaging and pathologic findings. Radiology. 2009; 250:638–647.23. Elston CW, Ellis IO. Pathological prognostic factors in breast cancer. I. The value of histological grade in breast cancer: experience from a large study with long-term follow-up. Histopathology. 1991; 19:403–410.24. Hammond ME, Hayes DF, Wolff AC, Mangu PB, Temin S. American society of clinical oncology/college of american pathologists guideline recommendations for immunohistochemical testing of estrogen and progesterone receptors in breast cancer. J Oncol Pract. 2010; 6:195–197.25. Dolan M, Snover D. Comparison of immunohistochemical and fluorescence in situ hybridization assessment of HER-2 status in routine practice. Am J Clin Pathol. 2005; 123:766–770.26. Cheang MC, Chia SK, Voduc D, Gao D, Leung S, Snider J, et al. Ki67 index, HER2 status, and prognosis of patients with luminal B breast cancer. J Natl Cancer Inst. 2009; 101:736–750.27. Hoskin PJ, Carnell DM, Taylor NJ, Smith RE, Stirling JJ, Daley FM, et al. Hypoxia in prostate cancer: correlation of BOLD-MRI with pimonidazole immunohistochemistry-initial observations. Int J Radiat Oncol Biol Phys. 2007; 68:1065–1071.28. Hohenberger P, Felgner C, Haensch W, Schlag PM. Tumor oxygenation correlates with molecular growth determinants in breast cancer. Breast Cancer Res Treat. 1998; 48:97–106.29. Höckel M, Vaupel P. Tumor hypoxia: definitions and current clinical, biologic, and molecular aspects. J Natl Cancer Inst. 2001; 93:266–276.30. Ko ES, Han BK, Kim RB, Cho EY, Ahn S, Nam SJ, et al. Apparent diffusion coefficient in estrogen receptor-positive invasive ductal breast carcinoma: correlations with tumor-stroma ratio. Radiology. 2014; 271:30–37.31. Elston CW, Ellis IO. Pathological prognostic factors in breast cancer. I. The value of histological grade in breast cancer: experience from a large study with long-term follow-up. Histopathology. 2002; 41(3A):154–161.32. Lee SH, Cho N, Kim SJ, Cha JH, Cho KS, Ko ES, et al. Correlation between high resolution dynamic MR features and prognostic factors in breast cancer. Korean J Radiol. 2008; 9:10–18.33. Lakhani SR, Ellis IO, Schnitt SJ, Tan PH, van de Vijver MJ. WHO classification of Tumours of the breast. 4th ed. Lyon: International Agency for Research on Cancer;2012. p. 14–31.34. Padhani AR, Ah-See ML, Taylor NJ, et al. An investigation of histological and DC-MRI correlates of intrinsic susceptibility contrast relaxivity (R2*) in human breast cancer. Proceedings of the Thirteenth Meeting of the International Society for Magnetic Resonance in Medicine. Berkeley, CA: International Society for Magnetic Resonance in Medicine;2005. p. 1846.35. Hendrick RE. Image contrast and noise. In : Stark DD, Bradley WG, editors. Magnetic resonance imaging. 3rd ed. St Louis, MO: Mosby;1999. p. 43–68.36. Kawashima M, Tamaki Y, Nonaka T, Higuchi K, Kimura M, Koida T, et al. MR imaging of mucinous carcinoma of the breast. AJR Am J Roentgenol. 2002; 179:179–183.37. Velasco M, Santamaría G, Ganau S, Farrús B, Zanón G, Romagosa C, et al. MRI of metaplastic carcinoma of the breast. AJR Am J Roentgenol. 2005; 184:1274–1278.38. Yuen S, Uematsu T, Kasami M, Tanaka K, Kimura K, Sanuki J, et al. Breast carcinomas with strong high-signal intensity on T2-weighted MR images: pathological characteristics and differential diagnosis. J Magn Reson Imaging. 2007; 25:502–510.
- Full Text Links
-
- Actions
-
Cited
- CITED
-
- Close
- Share
-
- Similar articles
-
- Estimation of T2* Relaxation Times for the Glandular Tissue and Fat of Breast at 3T MRI System
- The Production and Evaluation of the Tissue-equivalent Phantom for the Magnetic Resonance Imaging
- Feasibility of Novel Three-Dimensional Magnetic Resonance Fingerprinting of the Prostate Gland: Phantom and Clinical Studies
- Small Breast Cancer (≤ 5 mm): Ultrasonographic Features and Clinical and Pathological Characteristics
- Quantitative Analysis of Disc Degeneration Using Axial T2 Mapping in a Percutaneous Annular Puncture Model in Rabbits
