Quantitative Analysis of Disc Degeneration Using Axial T2 Mapping in a Percutaneous Annular Puncture Model in Rabbits
- Affiliations
-
- 1Department of Radiology, SMG-SNU Boramae Medical Center, Seoul 07061, Korea.
- 2Department of Radiology, Seoul National University Bundang Hospital, Seongnam 13620, Korea. heungskang@gmail.com
- 3Department of Radiology, Seoul National University Hospital, Seoul 03080, Korea.
- KMID: 2351169
- DOI: http://doi.org/10.3348/kjr.2016.17.1.103
Abstract
OBJECTIVE
To evaluate T2 relaxation time change using axial T2 mapping in a rabbit degenerated disc model and determine the most correlated variable with histologic score among T2 relaxation time, disc height index, and Pfirrmann grade.
MATERIALS AND METHODS
Degenerated disc model was made in 4 lumbar discs of 11 rabbits (n = 44) by percutaneous annular puncture with various severities of an injury. Lumbar spine lateral radiograph, MR T2 sagittal scan and MR axial T2 mapping were obtained at baseline and 2 weeks and 4 weeks after the injury in 7 rabbits and at baseline and 2 weeks, 4 weeks, and 6 weeks after the injury in 4 rabbits. Generalized estimating equations were used for a longitudinal analysis of changes in T2 relaxation time in degenerated disc model. T2 relaxation time, disc height index and Pfirrmann grade were correlated with the histologic scoring of disc degeneration using Spearman's rho test.
RESULTS
There was a significant difference in T2 relaxation time between uninjured and injured discs after annular puncture. Progressive decrease in T2 relaxation time was observed in injured discs throughout the study period. Lower T2 relaxation time was observed in the more severely injured discs. T2 relaxation time showed the strongest inverse correlation with the histologic score among the variables investigated (r = -0.811, p < 0.001).
CONCLUSION
T2 relaxation time measured with axial T2 mapping in degenerated discs is a potential method to assess disc degeneration.
Keyword
MeSH Terms
Figure
-
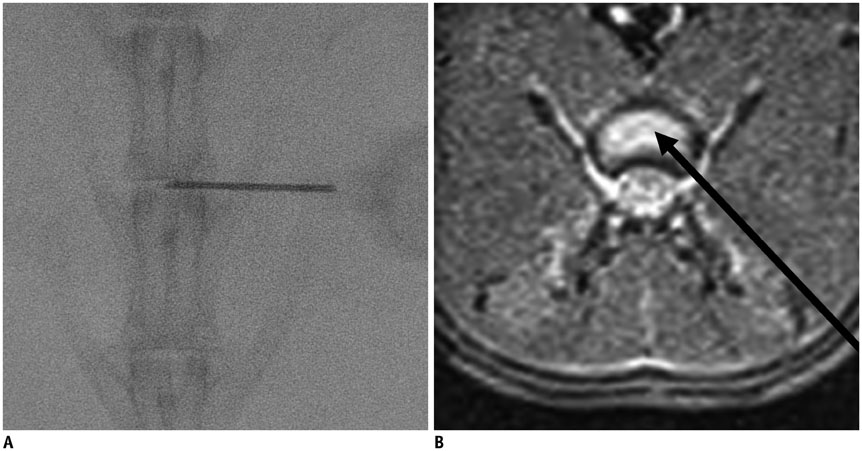
Fig. 1 Fluoroscopic guided annular puncture of lumbar intervertebral disc in rabbit. A. Fluoroscopic image showing needle placement on anteroposterior projection. Note needle tip reaches middle 1/3 to ensure full thickness puncture of annulus fibrosus. B. Route of annular puncture is demonstrated by black arrow on axial MR T2-weighted image.

Fig. 2 Pfirrmann grade 1 to grade 4 discs assessed with MR T2-weighted sagittal scan. A. Grade 1 disc shows homogenous bright high signal intensity in nucleus pulposus and inner annulus fibrosus. B. Grade 2 disc shows inhomogeneous high signal intensity in nucleus pulposus with less distinct margin between nucleus pulposus and annulus fibrosus. C. Grade 3 disc shows intermediate signal intensity in nucleus pulposus and slightly decreased disc height. D. Grade 4 disc shows moderately decreased disc height and intermediate to low signal intensity in nucleus. Note focal disc herniation (open arrow) to central zone.
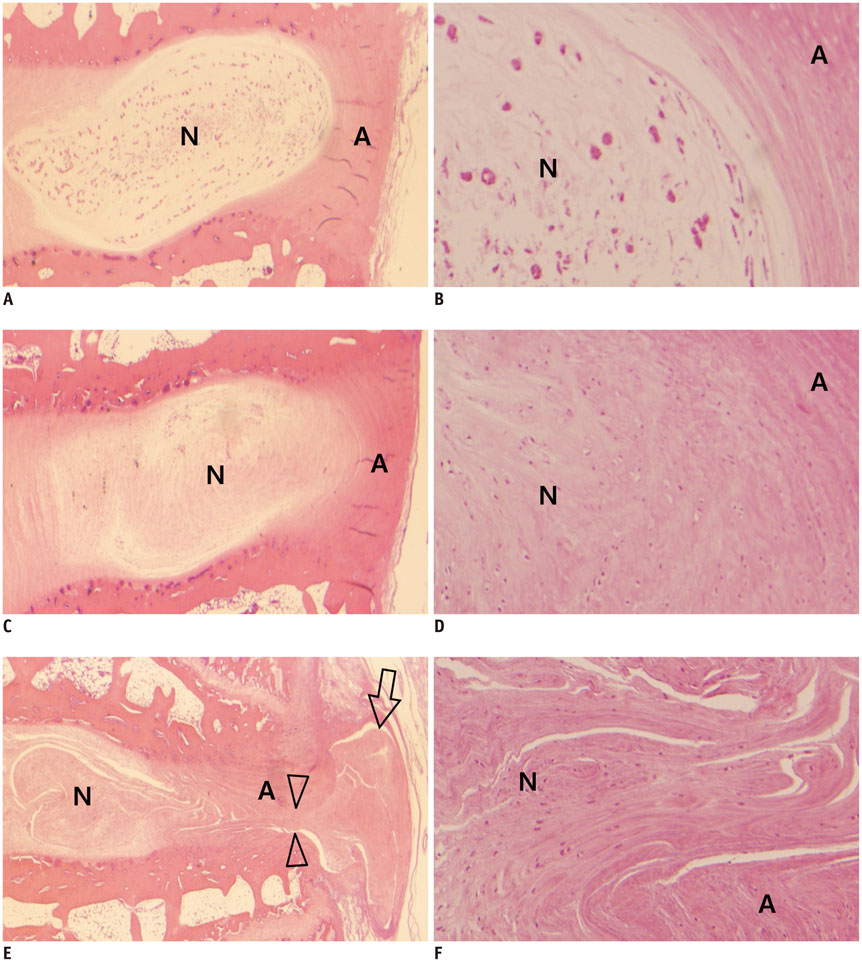
Fig. 3 Typical histologic grades of disc degeneration. Hematoxylin and eosin stained sections of normal (A and B, histologic score 4), moderately degenerated (C and D, histologic score 10), severely degenerated (E and F, histologic score 12) discs show obliteration of border between nucleus pulposus (N) and annulus fibrosus (A), more fibrous, less cellular nucleus pulposus with increasing severity. Note annular tear (open arrowheads) and disc herniation (open arrow) in severely degenerated disc as shown in E (A, C, E at 30 x and B, D, F at 200 x).
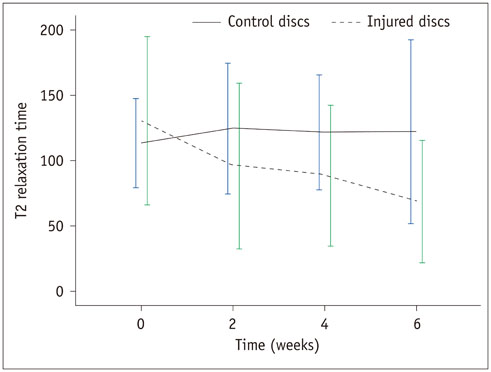
Fig. 4 Mean T2 relaxation time at each time point. Significant decrease in T2 relaxation time for injured discs is observed with time (p < 0.001). Error bars represent standard deviation from mean.
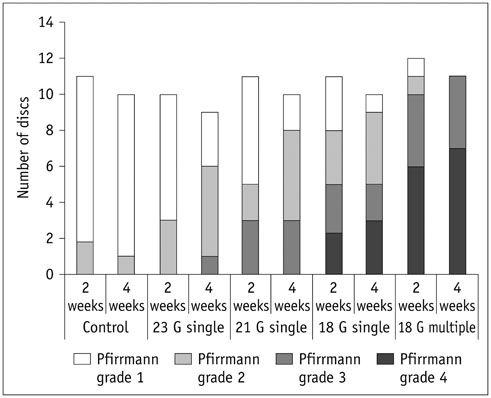
Fig. 5 Number of discs in different Pfirrmann grades of degenerative disc models are demonstrated in different columns according to severity of injury, 2 weeks and 4 weeks after annular puncture.
Reference
-
1. Masuda K. Biological repair of the degenerated intervertebral disc by the injection of growth factors. Eur Spine J. 2008; 17:Suppl 4. 441–451.2. Chujo T, An HS, Akeda K, Miyamoto K, Muehleman C, Attawia M, et al. Effects of growth differentiation factor-5 on the intervertebral disc--in vitro bovine study and in vivo rabbit disc degeneration model study. Spine (Phila Pa 1976). 2006; 31:2909–2917.3. Masuda K, Oegema TR Jr, An HS. Growth factors and treatment of intervertebral disc degeneration. Spine (Phila Pa 1976). 2004; 29:2757–2769.4. Yang H, Wu J, Liu J, Ebraheim M, Castillo S, Liu X, et al. Transplanted mesenchymal stem cells with pure fibrinous gelatin-transforming growth factor-beta1 decrease rabbit intervertebral disc degeneration. Spine J. 2010; 10:802–810.5. Leung VY, Chan D, Cheung KM. Regeneration of intervertebral disc by mesenchymal stem cells: potentials, limitations, and future direction. Eur Spine J. 2006; 15:Suppl 3. S406–S413.6. Kim KS, Yoon ST, Li J, Park JS, Hutton WC. Disc degeneration in the rabbit: a biochemical and radiological comparison between four disc injury models. Spine (Phila Pa 1976). 2005; 30:33–37.7. Kwon YJ. A minimally invasive rabbit model of progressive and reproducible disc degeneration confirmed by radiology, gene expression, and histology. J Korean Neurosurg Soc. 2013; 53:323–330.8. Zhou RP, Zhang ZM, Wang L, Huang MJ, Zheng XC, Cui YN, et al. Establishing a disc degeneration model using computed tomography-guided percutaneous puncture technique in the rabbit. J Surg Res. 2013; 181:e65–e74.9. Pfirrmann CW, Metzdorf A, Zanetti M, Hodler J, Boos N. Magnetic resonance classification of lumbar intervertebral disc degeneration. Spine (Phila Pa 1976). 2001; 26:1873–1878.10. Masuda K, Aota Y, Muehleman C, Imai Y, Okuma M, Thonar EJ, et al. A novel rabbit model of mild, reproducible disc degeneration by an anulus needle puncture: correlation between the degree of disc injury and radiological and histological appearances of disc degeneration. Spine (Phila Pa 1976). 2005; 30:5–14.11. Perry J, Haughton V, Anderson PA, Wu Y, Fine J, Mistretta C. The value of T2 relaxation times to characterize lumbar intervertebral disks: preliminary results. AJNR Am J Neuroradiol. 2006; 27:337–342.12. Blumenkrantz G, Zuo J, Li X, Kornak J, Link TM, Majumdar S. In vivo 3.0-tesla magnetic resonance T1rho and T2 relaxation mapping in subjects with intervertebral disc degeneration and clinical symptoms. Magn Reson Med. 2010; 63:1193–1200.13. Welsch GH, Trattnig S, Paternostro-Sluga T, Bohndorf K, Goed S, Stelzeneder D, et al. Parametric T2 and T2* mapping techniques to visualize intervertebral disc degeneration in patients with low back pain: initial results on the clinical use of 3.0 Tesla MRI. Skeletal Radiol. 2011; 40:543–551.14. Trattnig S, Stelzeneder D, Goed S, Reissegger M, Mamisch TC, Paternostro-Sluga T, et al. Lumbar intervertebral disc abnormalities: comparison of quantitative T2 mapping with conventional MR at 3.0 T. Eur Radiol. 2010; 20:2715–2722.15. Sun W, Zhang K, Zhao CQ, Ding W, Yuan JJ, Sun Q, et al. Quantitative T2 mapping to characterize the process of intervertebral disc degeneration in a rabbit model. BMC Musculoskelet Disord. 2013; 14:357.16. Cai F, Wu XT, Xie XH, Wang F, Hong X, Zhuang SY, et al. Evaluation of intervertebral disc regeneration with implantation of bone marrow mesenchymal stem cells (BMSCs) using quantitative T2 mapping: a study in rabbits. Int Orthop. 2015; 39:149–159.17. Subhan RA, Puvanan K, Murali MR, Raghavendran HR, Shani S, Abdullah BJ, et al. Fluoroscopy assisted minimally invasive transplantation of allogenic mesenchymal stromal cells embedded in HyStem reduces the progression of nucleus pulposus degeneration in the damaged ntervertebral [corrected] disc: a preliminary study in rabbits. ScientificWorldJournal. 2014; 2014:818502.18. Obata S, Akeda K, Imanishi T, Masuda K, Bae W, Morimoto R, et al. Effect of autologous platelet-rich plasma-releasate on intervertebral disc degeneration in the rabbit anular puncture model: a preclinical study. Arthritis Res Ther. 2012; 14:R241.19. Marinelli NL, Haughton VM, Muñoz A, Anderson PA. T2 relaxation times of intervertebral disc tissue correlated with water content and proteoglycan content. Spine (Phila Pa 1976). 2009; 34:520–524.20. Marinelli NL, Haughton VM, Anderson PA. T2 relaxation times correlated with stage of lumbar intervertebral disk degeneration and patient age. AJNR Am J Neuroradiol. 2010; 31:1278–1282.21. Watanabe A, Benneker LM, Boesch C, Watanabe T, Obata T, Anderson SE. Classification of intervertebral disk degeneration with axial T2 mapping. AJR Am J Roentgenol. 2007; 189:936–942.
- Full Text Links
-
- Actions
-
Cited
- CITED
-
- Close
- Share
-
- Similar articles
-
- A Minimally Invasive Rabbit Model of Progressive and Reproducible Disc Degeneration Confirmed by Radiology, Gene Expression, and Histology
- Evaluation of Lumbar Intervertebral Disc Degeneration Using T1Ï and T2 Magnetic Resonance Imaging in a Rabbit Disc Injury Model
- Rabbit Model for in vivo Study of Intervertebral Disc Degeneration and Regeneration
- Effects of Growth Hormone on the Degenerative Changes in the Intervertebral Disc of Rabbits
- Histological Changes after Intradiscal Steroid Injection to the Intervertebral Disc in Disc Injury Rabbit Model
