Alteration of mitochondrial DNA content modulates antioxidant enzyme expressions and oxidative stress in myoblasts
- Affiliations
-
- 1Department of Biochemistry, Dongguk University College of Medicine, Gyeongju 38066, Korea. wanlee@dongguk.ac.kr
- 2Channelopathy Research Center, Dongguk University College of Medicine, Goyang 10326, Korea.
- KMID: 2461045
- DOI: http://doi.org/10.4196/kjpp.2019.23.6.519
Abstract
- Mitochondrial dysfunction is closely associated with reactive oxygen species (ROS) generation and oxidative stress in cells. On the other hand, modulation of the cellular antioxidant defense system by changes in the mitochondrial DNA (mtDNA) content is largely unknown. To determine the relationship between the cellular mtDNA content and defense system against oxidative stress, this study examined a set of myoblasts containing a depleted or reverted mtDNA content. A change in the cellular mtDNA content modulated the expression of antioxidant enzymes in myoblasts. In particular, the expression and activity of glutathione peroxidase (GPx) and catalase were inversely correlated with the mtDNA content in myoblasts. The depletion of mtDNA decreased both the reduced glutathione (GSH) and oxidized glutathione (GSSG) slightly, whereas the cellular redox status, as assessed by the GSH/GSSG ratio, was similar to that of the control. Interestingly, the steady-state level of the intracellular ROS, which depends on the reciprocal actions between ROS generation and detoxification, was reduced significantly and the lethality induced by Hâ‚‚Oâ‚‚ was alleviated by mtDNA depletion in myoblasts. Therefore, these results suggest that the ROS homeostasis and antioxidant enzymes are modulated by the cellular mtDNA content and that the increased expression and activity of GPx and catalase through the depletion of mtDNA are closely associated with an alleviation of the oxidative stress in myoblasts.
Keyword
MeSH Terms
Figure
-
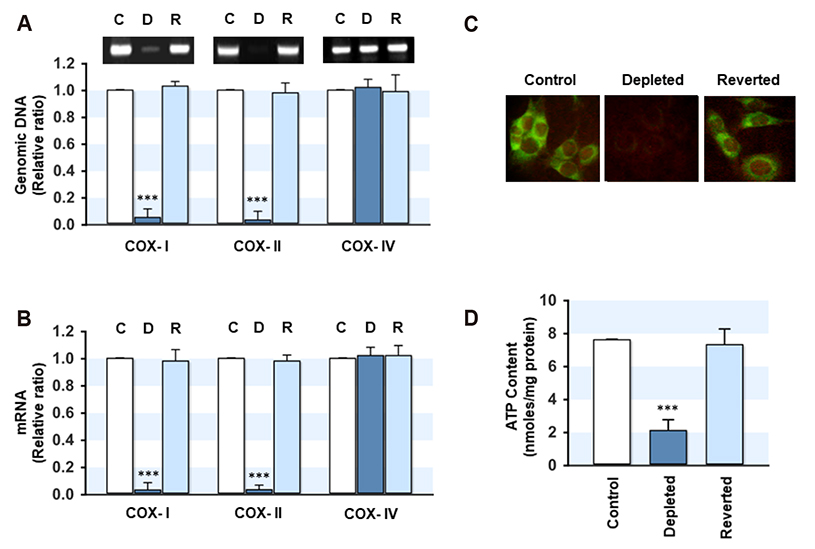
Fig. 1 Alteration of mitochondrial DNA (mtDNA) contents, functional mitochondria, and ATP levels by ethidium bromide (EtBr). (A) The genomic DNA was isolated from the control (C), mtDNA-depleted (D) and -reverted (R) myoblasts, and mtDNA-encoded genes, such as cytochrome c oxidase subunit I (COX-I), subunit II (COX-II), and nuclear DNA-encoded genes, such as cytochrome c oxidase subunit IV (COX-IV), were amplified by PCR. (B) The total RNA was extracted from the myoblasts, and the mRNA levels were quantified by qRT-PCR. The densities were normalized to the β-actin signals, and the relative intensities are expressed in arbitrary units, where the intensity of the control was set to one hundred. ***p < 0.001. (C) To analyze the functional mitochondria, control, mtDNA-depleted and -reverted L6-GLUT4myc myoblasts were stained with MitoTracker. The magnification is ~×400. (D) The total cellular ATP levels were measured by the luciferin-luciferase assay. All results represent the mean ± SEM from five independent experiments. ***p < 0.001 vs. control.
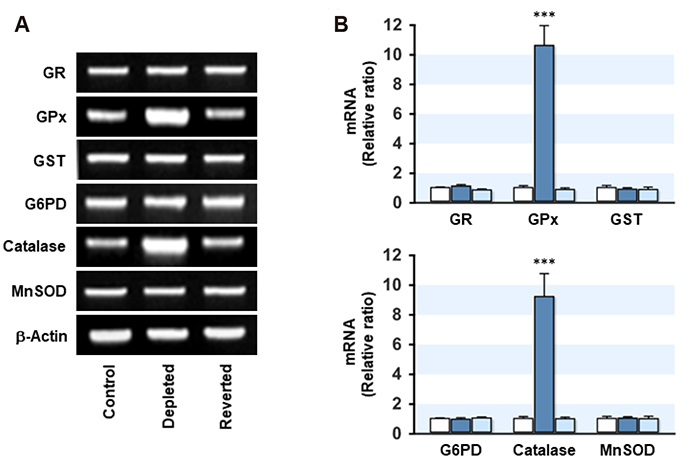
Fig. 2 Effect of mitochondrial DNA (mtDNA) depletion on the transcripts of the antioxidant defense enzymes. The total RNA from the control, mtDNA-depleted (Depleted) and -reverted (Reverted) myoblasts was prepared. The transcript level of the antioxidant defense enzymes was quantified by RT-PCR (A) and qRT-PCR (B). β-Actin was used as the control. All results represent the mean ± SEM from five independent experiments. GR, glutathione reductase; GPx, glutathione peroxidase; GST, glutathione S-transferase; SOD, superoxide dismutase. ***p < 0.001 vs. control.
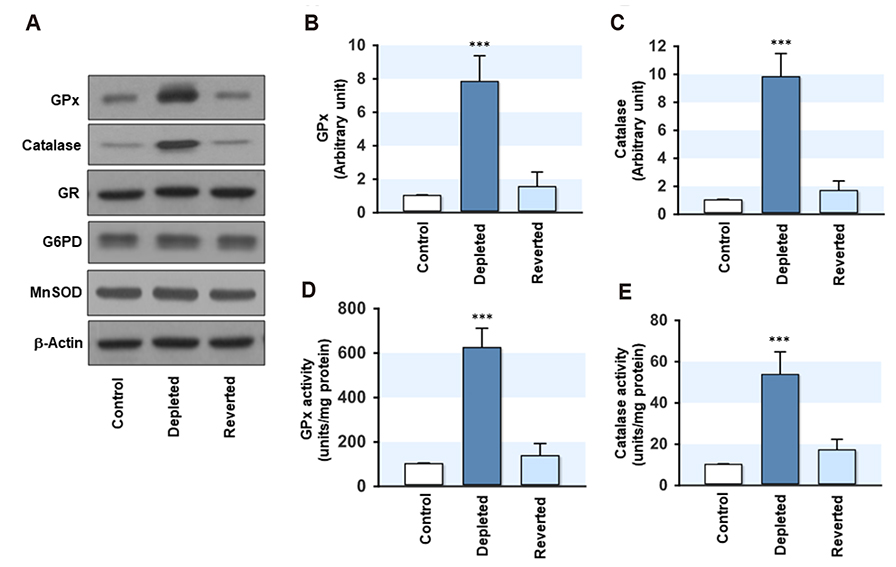
Fig. 3 Effect of mitochondrial DNA (mtDNA) depletion on the expression and activity of glutathione peroxidase (GPx) and catalase. The total cell lysates were prepared in the control, mtDNA-depleted (Depleted) and -reverted (Reverted) myoblasts. (A–C) The expression levels of GPx and catalase were analyzed by immunoblotting. The densities were normalized to the β-actin signals, and the relative intensities are expressed in arbitrary units, where the intensity of the control was set to one. (D) The total GPx activity was measured using the coupled enzyme procedure with glutathione reductase. The specific activity was calculated using the extinction coefficient obtained from the NADPH standard. (E) The total catalase activity was measured by monitoring the decomposition of 10 mM H2O2 at 240 nm in a medium. One unit of catalase decomposes 1 mM of H2O2 per min. The values are expressed as the mean ± SEM from four independent experiments. GR, glutathione reductase; SOD, superoxide dismutase. ***p < 0.001 vs. control.
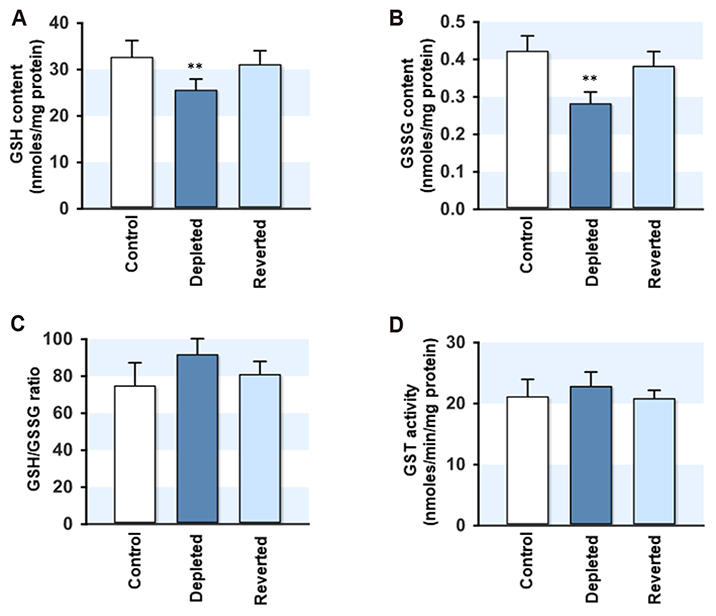
Fig. 4 Effect of mitochondrial DNA (mtDNA) depletion on the reduced glutathione (GSH) or oxidized glutathione (GSSG) contents and glutathione S-transferase (GST) activity. (A, B) The cellular GSH and GSSG contents were measured in the control, mtDNA-depleted (Depleted) and -reverted (Reverted) myoblasts. (C) The cellular redox status is presented as the GSH/GSSG ratio. (D) The GST activity was assayed in the supernatant of the cell lysates and was calculated using a known extinction coefficient. The values are expressed as the mean ± SEM from three independent experiments. **p < 0.01 vs. control.

Fig. 5 Effects of mitochondrial DNA (mtDNA) depletion on the cellular reactive oxygen species (ROS) content and H2O2-induced cell death. (A) Control, mtDNA-depleted (Depleted) and -reverted (Reverted) myoblasts were analyzed for the cellular ROS content using a 2′,7′-dichlorofluorescin diacetate (DCFH-DA) probe. The fluorescent images were observed by confocal microscopy (excitation, 485 nm; emission, 530 nm). The relative fluorescence intensities obtained from 50 cells are expressed in arbitrary units where the intensity of the control was set to one. (B) The level of mitochondrial ROS (mt ROS) was also determined by MitoSOX. The fluorescence intensity was determined with excitation (510 nM) and emission (580 nM) wavelengths. (C, D) Control (circle), mtDNA-depleted (triangle) and -reverted (rectangle) myoblasts were incubated with 0, 25, 250, or 500 mM H2O2 for 24 h. The effects of H2O2-induced cell death were evaluated by MTT reduction assay (C) and LDH release (D) as described in the Methods. The results of MTT reduction are expressed as the percentage change where the absorbance of myoblasts without H2O2 was set to one hundred. LDH release was determined by assaying the activity of LDH released into the culture medium. All results represent the mean ± SEM from four independent experiments. ***p < 0.001; **p < 0.01 vs. control.
Reference
-
1. Schulz E, Wenzel P, Münzel T, Daiber A. Mitochondrial redox signaling: interaction of mitochondrial reactive oxygen species with other sources of oxidative stress. Antioxid Redox Signal. 2014; 20:308–324.
Article2. Li N, Ragheb K, Lawler G, Sturgis J, Rajwa B, Melendez JA, Robinson JP. Mitochondrial complex I inhibitor rotenone induces apoptosis through enhancing mitochondrial reactive oxygen species production. J Biol Chem. 2003; 278:8516–8525.
Article3. Mercy L, Pauw Ad, Payen L, Tejerina S, Houbion A, Demazy C, Raes M, Renard P, Arnould T. Mitochondrial biogenesis in mtDNA-depleted cells involves a Ca2+-dependent pathway and a reduced mitochondrial protein import. FEBS J. 2005; 272:5031–5055.4. Leadsham JE, Sanders G, Giannaki S, Bastow EL, Hutton R, Naeimi WR, Breitenbach M, Gourlay CW. Loss of cytochrome c oxidase promotes RAS-dependent ROS production from the ER resident NADPH oxidase, Yno1p, in yeast. Cell Metab. 2013; 18:279–286.
Article5. Chang CJ, Yin PH, Yang DM, Wang CH, Hung WY, Chi CW, Wei YH, Lee HC. Mitochondrial dysfunction-induced amphiregulin upregulation mediates chemo-resistance and cell migration in HepG2 cells. Cell Mol Life Sci. 2009; 66:1755–1765.
Article6. Anderson S, Bankier AT, Barrell BG, de Bruijn MHL, Coulson AR, Drouin J, Eperon IC, Nierlich DP, Roe BA, Sanger F, Schreier PH, Smith AJH, Staden R, Young IG. Sequence and organization of the human mitochondrial genome. Nature. 1981; 290:457–465.
Article7. Enns GM. The contribution of mitochondria to common disorders. Mol Genet Metab. 2003; 80:11–26.
Article8. Duchen MR. Mitochondria in health and disease: perspectives on a new mitochondrial biology. Mol Aspects Med. 2004; 25:365–451.
Article9. Zylber E, Vesco C, Penman S. Selective inhibition of the synthesis of mitochondria-associated RNA by ethidium bromide. J Mol Biol. 1969; 44:195–204.10. Desjardins P, Frost E, Morais R. Ethidium bromide-induced loss of mitochondrial DNA from primary chicken embryo fibroblasts. Mol Cell Biol. 1985; 5:1163–1169.
Article11. Biswas G, Adebanjo OA, Freedman BD, Anandatheerthavarada HK, Vijayasarathy C, Zaidi M, Kotlikoff M, Avadhani NG. Retrograde Ca2+ signaling in C2C12 skeletal myocytes in response to mitochondrial genetic and metabolic stress: a novel mode of interorganelle crosstalk. EMBO J. 1999; 18:522–533.12. Park SY, Choi GH, Choi HI, Ryu J, Jung CY, Lee W. Depletion of mitochondrial DNA causes impaired glucose utilization and insulin resistance in L6 GLUT4myc myocytes. J Biol Chem. 2005; 280:9855–9864.
Article13. Park SY, Chang I, Kim JY, Kang SW, Park SH, Singh K, Lee MS. Resistance of mitochondrial DNA-depleted cells against cell death: role of mitochondrial superoxide dismutase. J Biol Chem. 2004; 279:7512–7520.14. Nacarelli T, Azar A, Sell C. Inhibition of mTOR prevents ROS production initiated by ethidium bromide-induced mitochondrial DNA depletion. Front Endocrinol (Lausanne). 2014; 5:122.
Article15. Nakahira K, Haspel JA, Rathinam VA, Lee SJ, Dolinay T, Lam HC, Englert JA, Rabinovitch M, Cernadas M, Kim HP, Fitzgerald KA, Ryter SW, Choi AM. Autophagy proteins regulate innate immune responses by inhibiting the release of mitochondrial DNA mediated by the NALP3 inflammasome. Nat Immunol. 2011; 12:222–230.
Article16. Perez MJ, Gonzalez-Sanchez E, Gonzalez-Loyola A, Gonzalez-Buitrago JM, Marin JJ. Mitochondrial genome depletion dysregulates bile acid- and paracetamol-induced expression of the transporters Mdr1, Mrp1 and Mrp4 in liver cells. Br J Pharmacol. 2011; 162:1686–1699.
Article17. Nickel A, Kohlhaas M, Maack C. Mitochondrial reactive oxygen species production and elimination. J Mol Cell Cardiol. 2014; 73:26–33.
Article18. Behan A, Doyle S, Farrell M. Adaptive responses to mitochondrial dysfunction in the rho degrees Namalwa cell. Mitochondrion. 2005; 5:173–193.19. Butow RA, Avadhani NG. Mitochondrial signaling: the retrograde response. Mol Cell. 2004; 14:1–15.20. Brambilla L, Cairo G, Sestili P, O'Donnel V, Azzi A, Cantoni O. Mitochondrial respiratory chain deficiency leads to overexpression of antioxidant enzymes. FEBS Lett. 1997; 418:247–250.
Article21. Chen LB. Fluorescent labeling of mitochondria. Methods Cell Biol. 1989; 29:103–123.22. Ryu HS, Park SY, Ma D, Zhang J, Lee W. The induction of microRNA targeting IRS-1 is involved in the development of insulin resistance under conditions of mitochondrial dysfunction in hepatocytes. PLoS One. 2011; 6:e17343.
Article23. Amuthan G, Biswas G, Zhang SY, Klein-Szanto A, Vijayasarathy C, Avadhani NG. Mitochondria-to-nucleus stress signaling induces phenotypic changes, tumor progression and cell invasion. EMBO J. 2001; 20:1910–1920.
Article24. Lubos E, Loscalzo J, Handy DE. Glutathione peroxidase-1 in health and disease: from molecular mechanisms to therapeutic opportunities. Antioxid Redox Signal. 2011; 15:1957–1997.
Article25. Halliwell B. Antioxidant defence mechanisms: from the beginning to the end (of the beginning). Free Radic Res. 1999; 31:261–272.
Article26. St-Pierre J, Drori S, Uldry M, Silvaggi JM, Rhee J, Jäger S, Handschin C, Zheng K, Lin J, Yang W, Simon DK, Bachoo R, Spiegelman BM. Suppression of reactive oxygen species and neurodegeneration by the PGC-1 transcriptional coactivators. Cell. 2006; 127:397–408.
Article27. Liu Z, Butow RA. Mitochondrial retrograde signaling. Annu Rev Genet. 2006; 40:159–185.
Article28. da Cunha FM, Torelli NQ, Kowaltowski AJ. Mitochondrial retrograde signaling: triggers, pathways, and outcomes. Oxid Med Cell Longev. 2015; 2015:482582.
Article29. Hussain SP, Amstad P, He P, Robles A, Lupold S, Kaneko I, Ichimiya M, Sengupta S, Mechanic L, Okamura S, Hofseth LJ, Moake M, Nagashima M, Forrester KS, Harris CC. p53-induced up-regulation of MnSOD and GPx but not catalase increases oxidative stress and apoptosis. Cancer Res. 2004; 64:2350–2356.
Article30. Zhou LZ, Johnson AP, Rando TA. NF kappa B and AP-1 mediate transcriptional responses to oxidative stress in skeletal muscle cells. Free Radic Biol Med. 2001; 31:1405–1416.
- Full Text Links
-
- Actions
-
Cited
- CITED
-
- Close
- Share
-
- Similar articles
-
- Regional Differences in Mitochondrial Anti-oxidant State during Ischemic Preconditioning in Rat Heart
- Antioxidant Effect of Garlic Supplement Against Exercise-Induced Oxidative Stress in Rats
- The correlation of Septin4 gene expression with sperm quality, DNA damage, and oxidative stress level in infertile patients
- Role of Mitochondrial Oxidative Stress in Sepsis
- Epilepsy and Oxidative Stress
