Comparison of differences in microbial compositions between negative controls and subject samples with varying analysis configurations
- Affiliations
-
- 1Department of Health Sciences and Technology, GAIHST, Gachon University, Incheon, Korea.
- 2Division of Pulmonology and Allergy, Department of Internal Medicine, Gachon University Gil Medical Center, Incheon, Korea. sangminlee77@naver.com
- 3Department of Genome Medicine and Science, College of Medicine, Gachon University, Incheon, Korea. sjung@gachon.ac.kr
- 4Gachon Institute of Genome Medicine and Science, Gachon University Gil Medical Center, Incheon, Korea.
- KMID: 2421216
- DOI: http://doi.org/10.4168/aard.2018.6.5.255
Abstract
- PURPOSE
Identifying microbial communities with 16S ribosomal RNA (rRNA) gene sequencing is a popular approach in microbiome studies, and various software tools and data resources have been developed for microbial analysis. Our aim in this study is investigating various available software tools and reference sequence databases to compare their performance in differentiating subject samples and negative controls.
METHODS
We collected 4 negative control samples using various acquisition protocols, and 2 respiratory samples were acquired from a healthy subject also with different acquisition protocols. Quantitative methods were used to compare the results of taxonomy compositions of these 6 samples by varying the configuration of analysis software tools and reference databases.
RESULTS
The results of taxonomy assignments showed relatively little difference, regardless of pipeline configurations and reference databases. Nevertheless, the effect on the discrepancy was larger using different software configurations than using different reference databases. In recognizing different samples, the 4 negative controls were clearly separable from the 2 subject samples. Additionally, there is a tendency to differentiate samples from different acquisition protocols.
CONCLUSION
Our results suggest little difference in microbial compositions between different software tools and reference databases, but certain configurations can improve the separability of samples. Changing software tools shows a greater impact on results than changing reference databases; thus, it is necessary to utilize appropriate configurations based on the objectives of studies.
Keyword
MeSH Terms
Figure
-

Fig. 1. Normalized compositions of common microbial communities of 6 samples, from each configuration of pipeline and reference sequence database. Compositions of common microbial communities are plotted with unassigned proportions (A), and without unassigned proportions (B). The presented compositions are in phylum level. NC, negative control; S, subject sample.
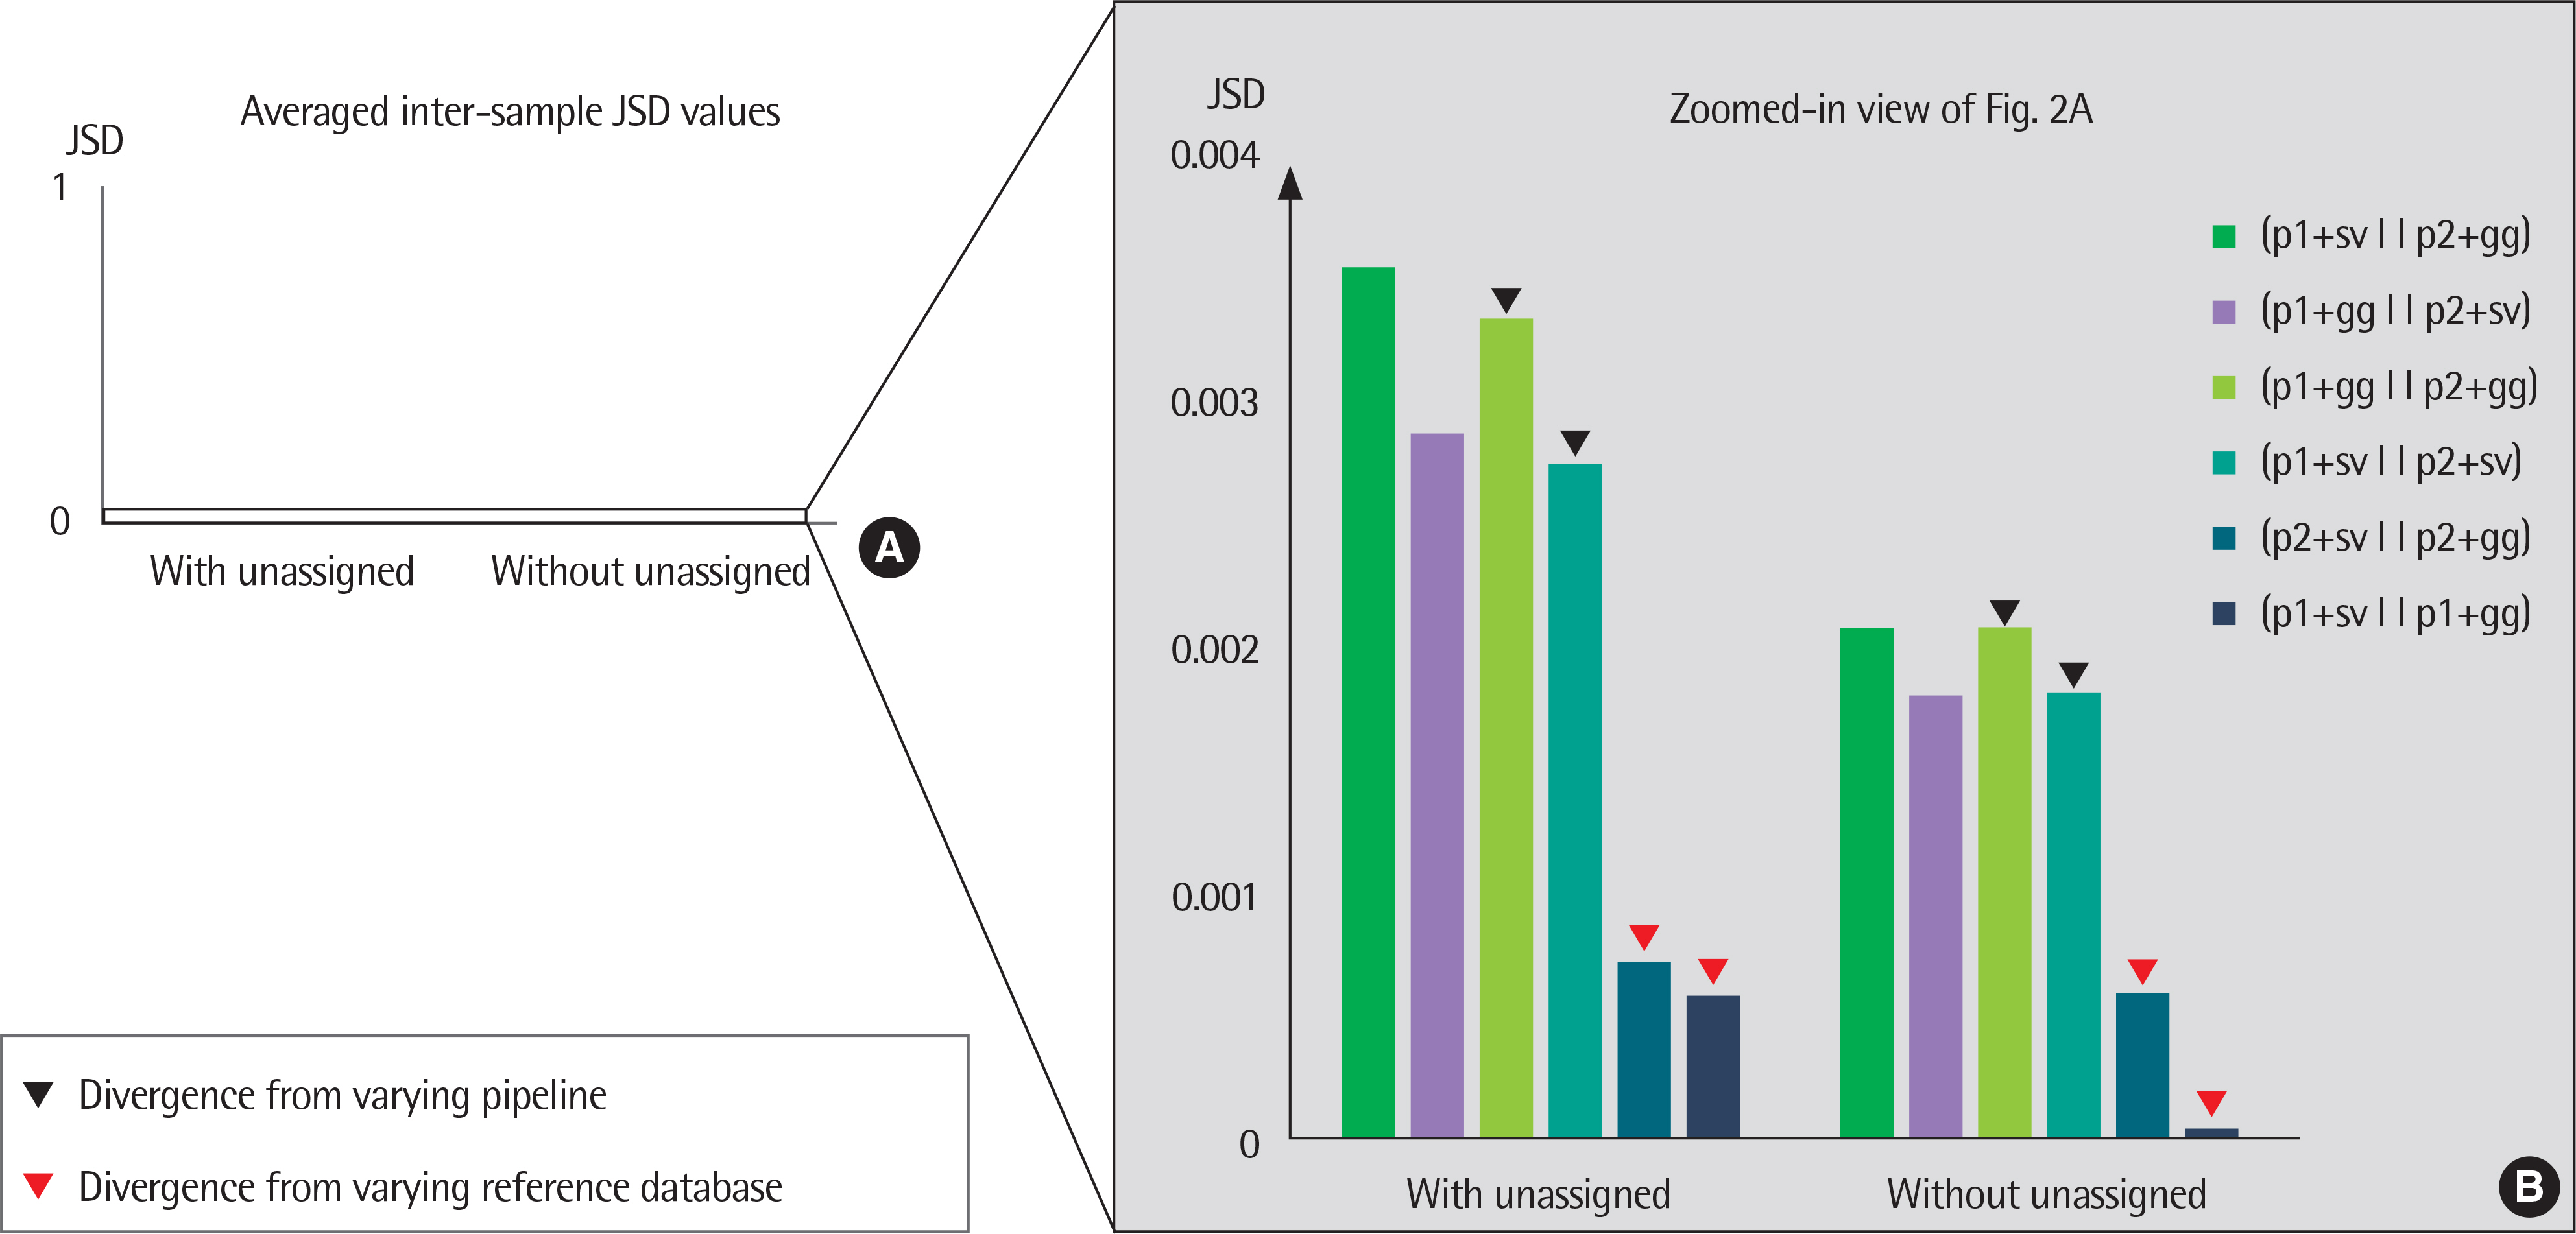
Fig. 2. A bar plot of averaged Jensen-Shannon divergence (JSD) values between the results of 2 different configurations of pipelines and reference sequence databases. The averaged JSD values were computed with and without unassigned portions. The averaged JSD values between 0 to 1 were plotted (A) and zoomed to ob-serve the details (B). Markers indicate the averaged JSD from varying pipeline (black), and from varying database (red). p1, Pipeline1; p2, Pipeline2; gg, Greengenes; sv, SILVA.
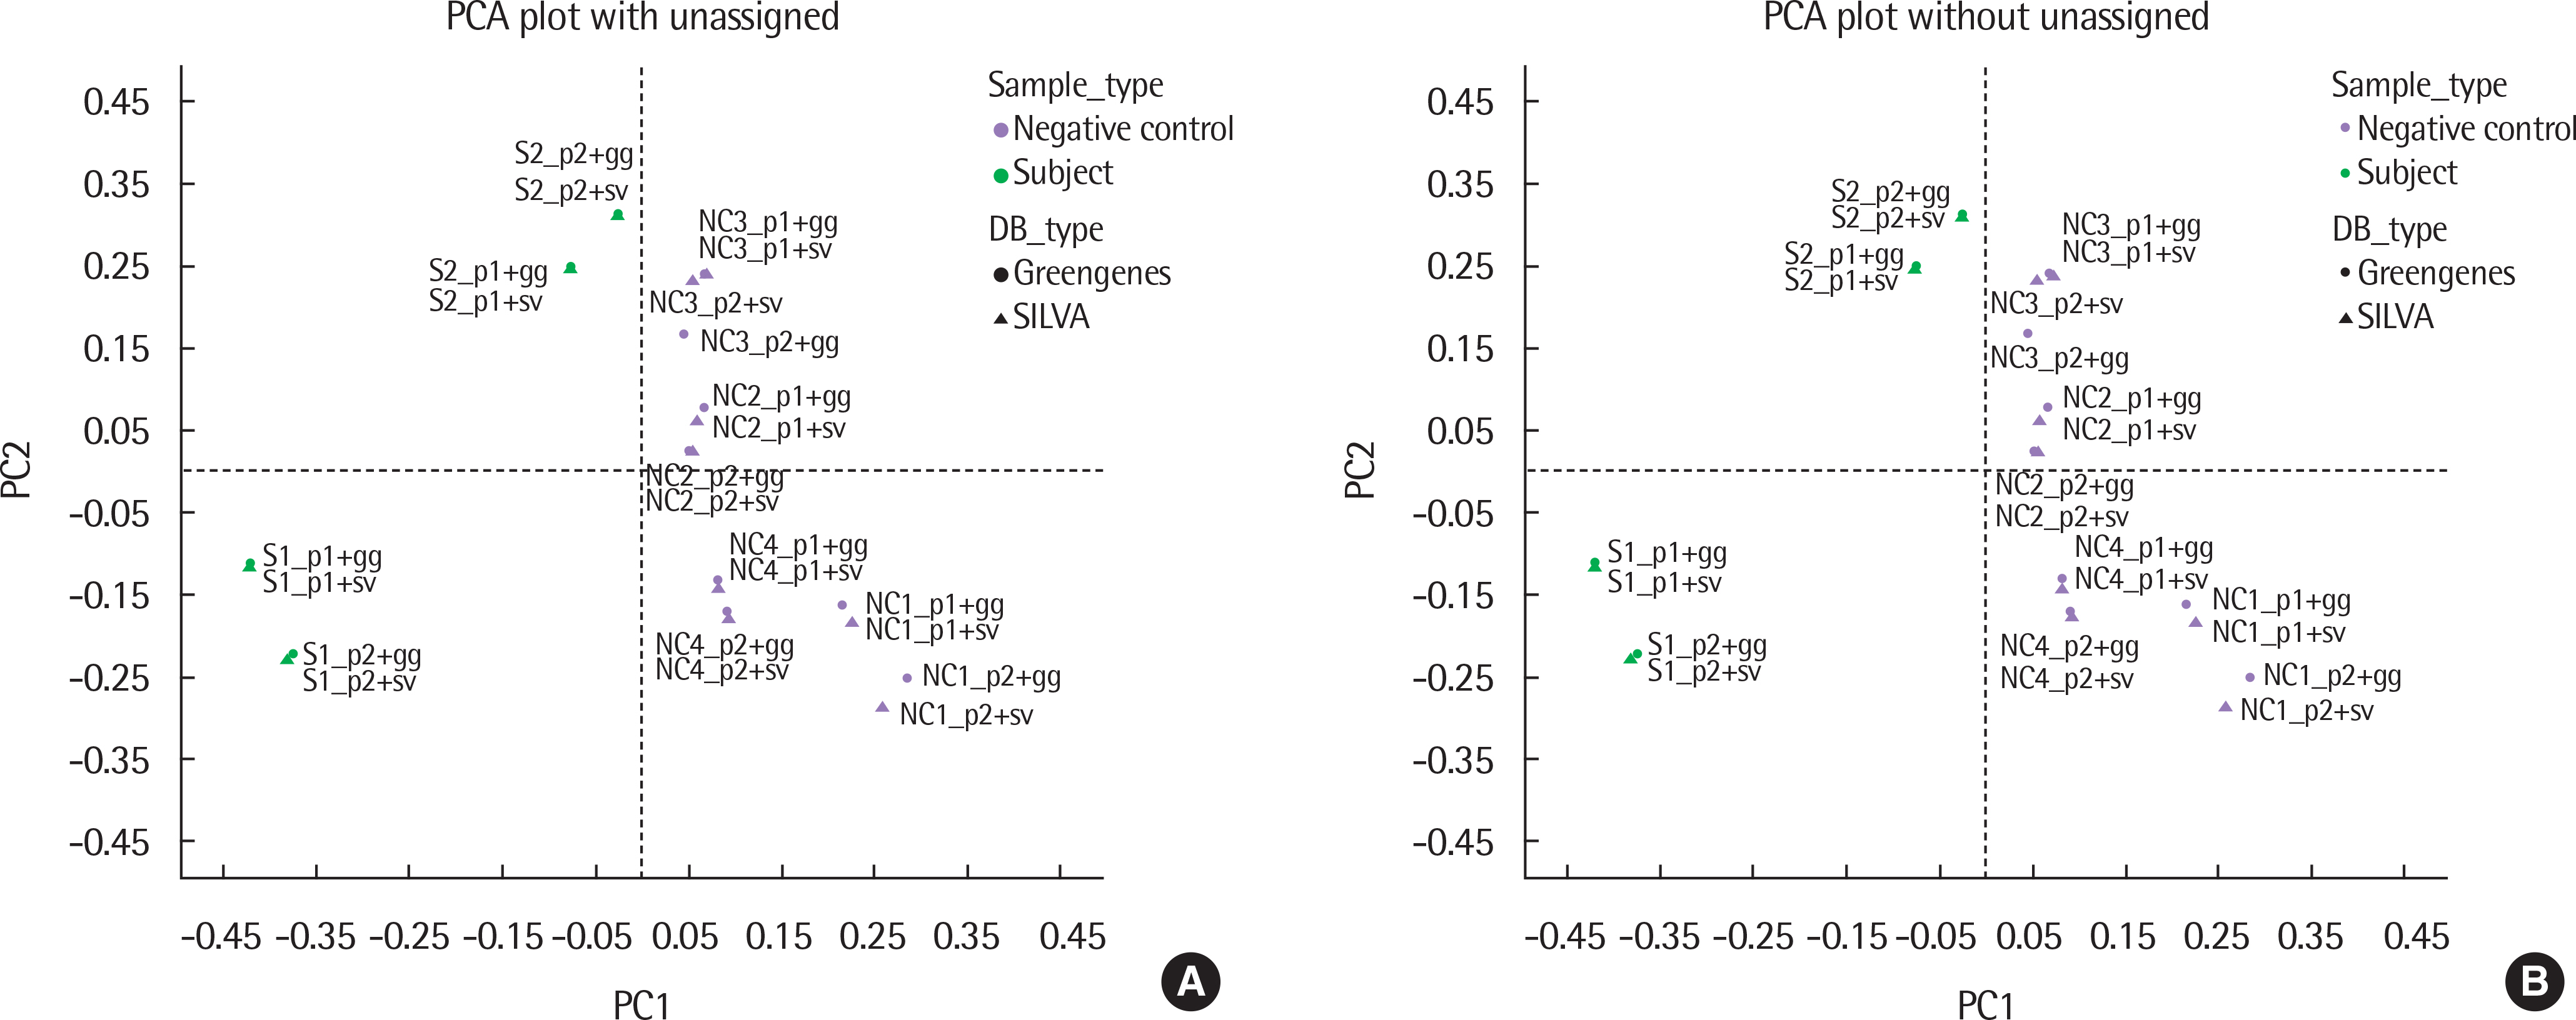
Fig. 3. Principle component analysis (PCA) plots of all samples using different pipelines and databases (with and without unassigned). NC and S are separable either with (A) or without unassigned portion (B). NC, negative control; S, subject sample. p1, Pipeline1; p2, Pipeline2; gg, Greengenes; sv, SILVA.
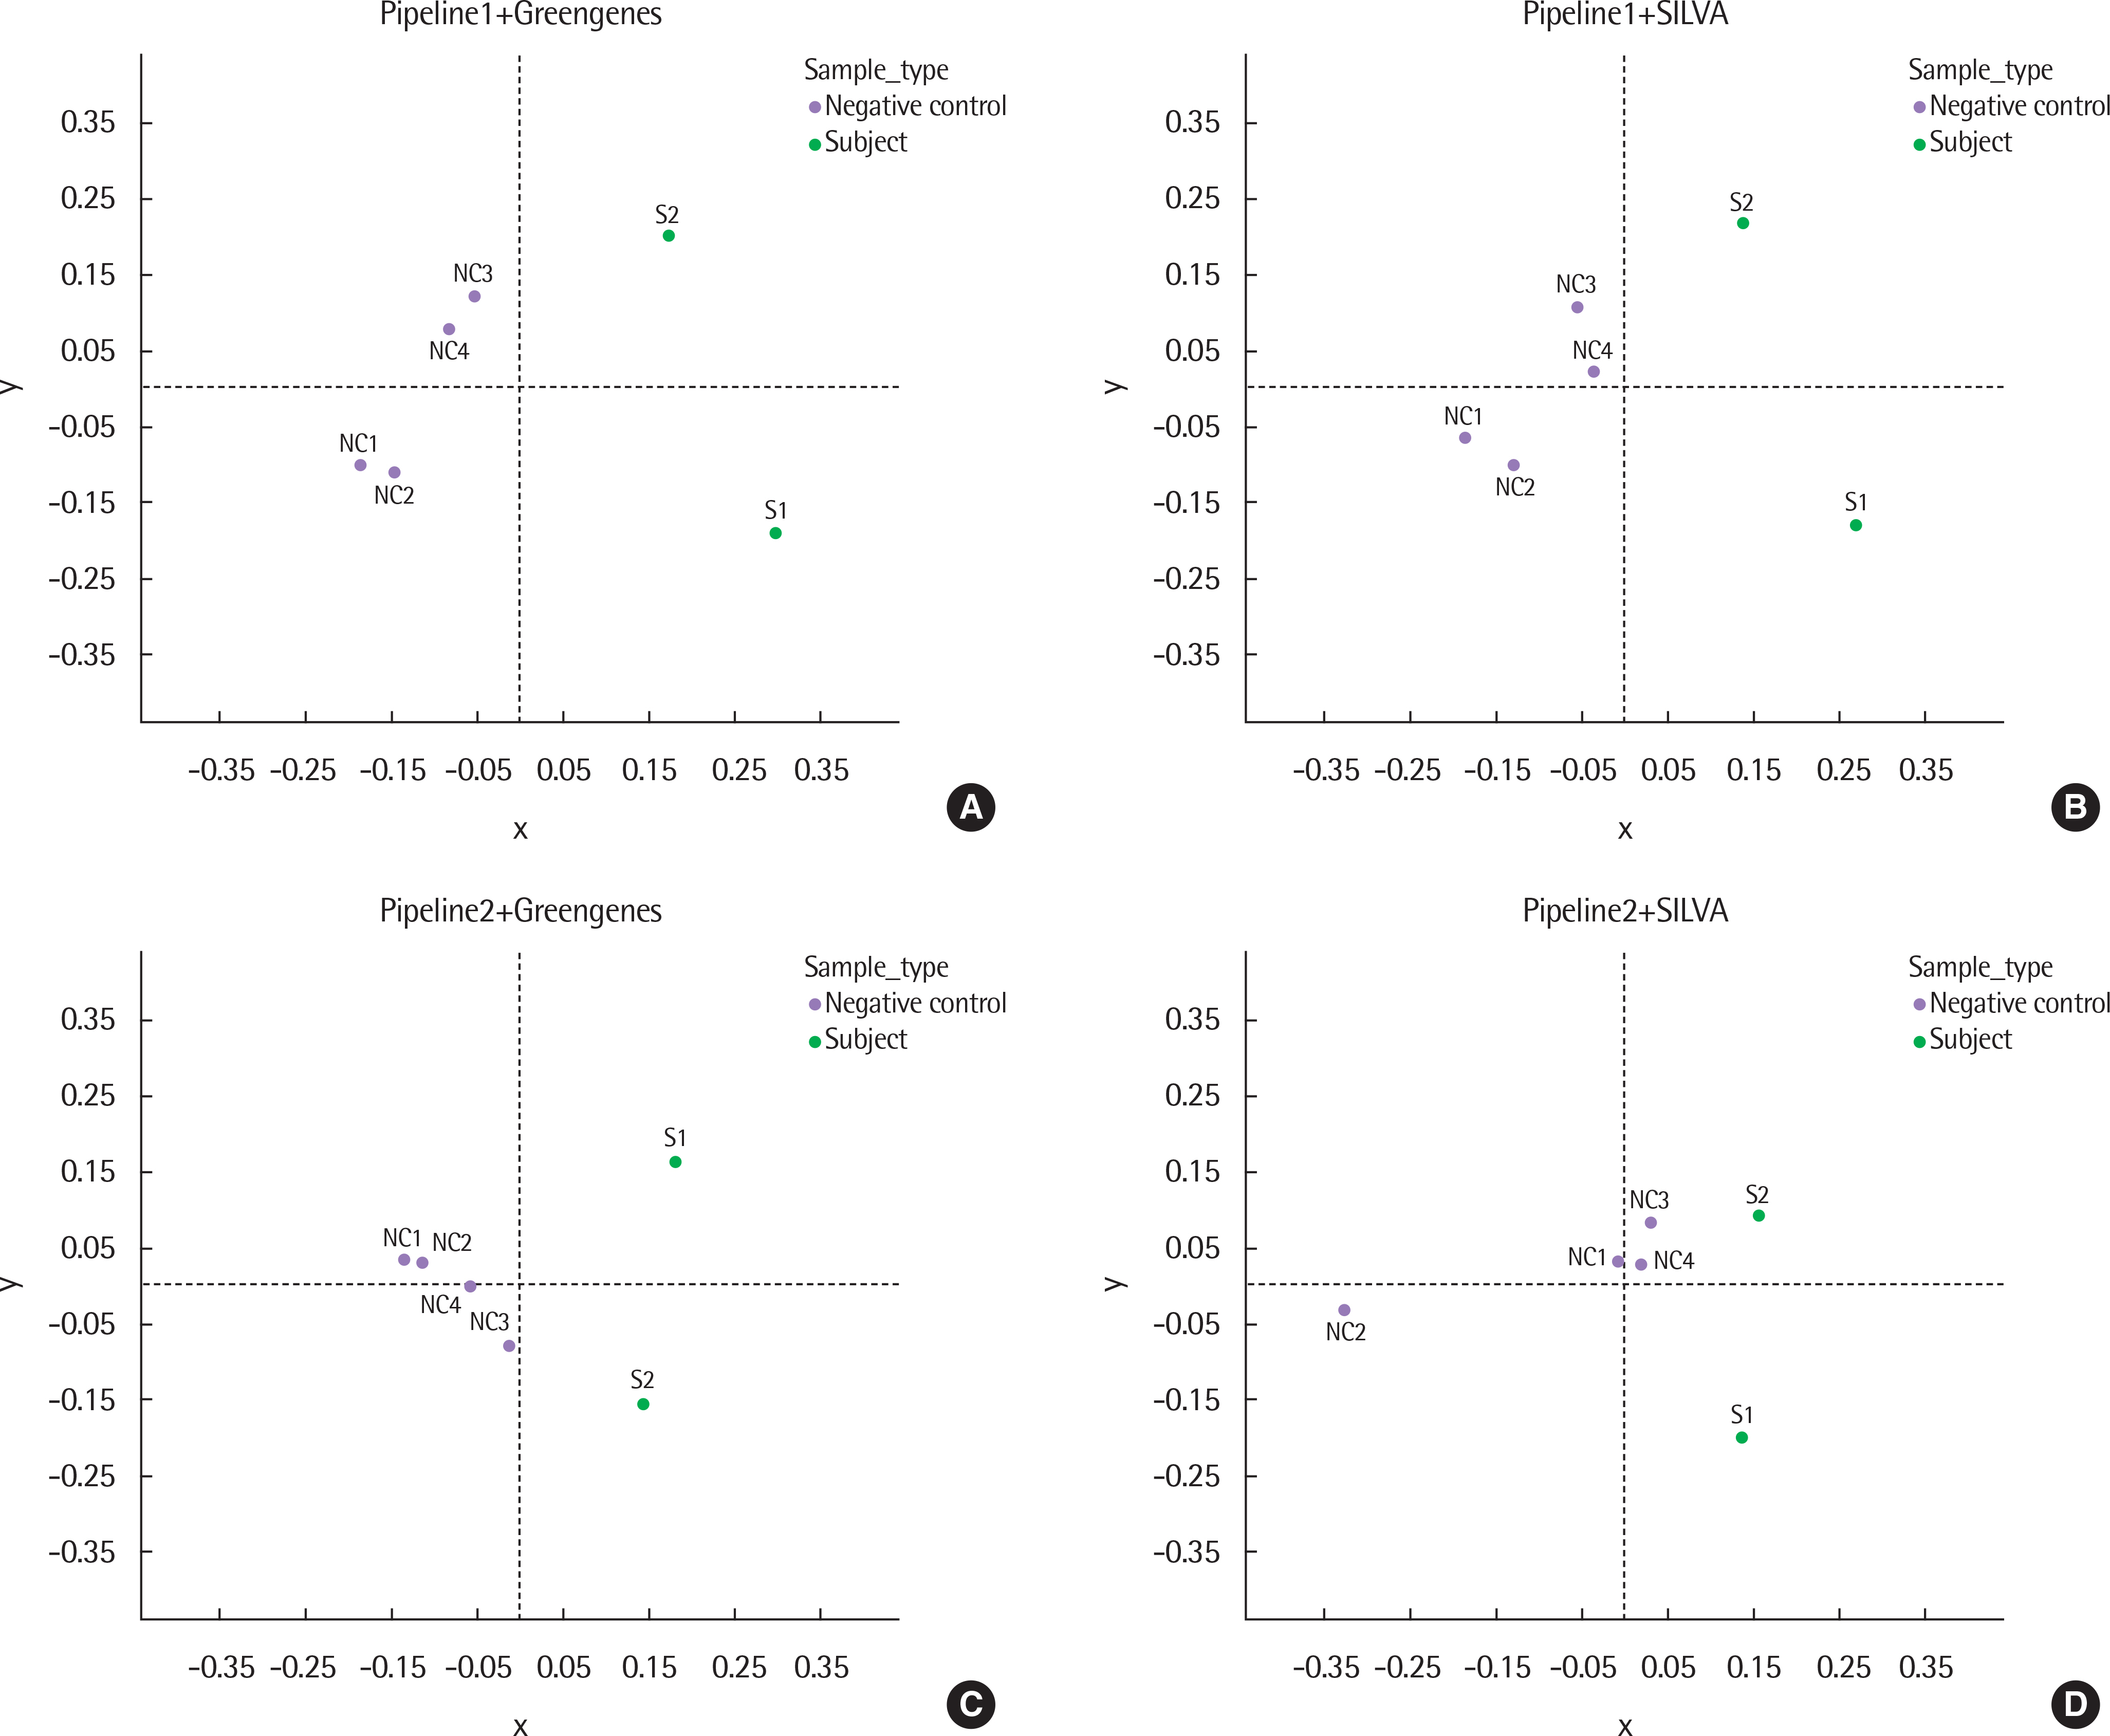
Fig. 4. Multidimensional scaling (MDS) plots of 6 samples from each configuration of pipelines and databases based on the weighted-UniFrac distance. Pipeline1 with Greengenes (A), Pipeline1 with SILVA (B), Pipeline2 with Greengenes (C), and Pipeline2 with SILVA (D). NC, negative control; S, subject sample.
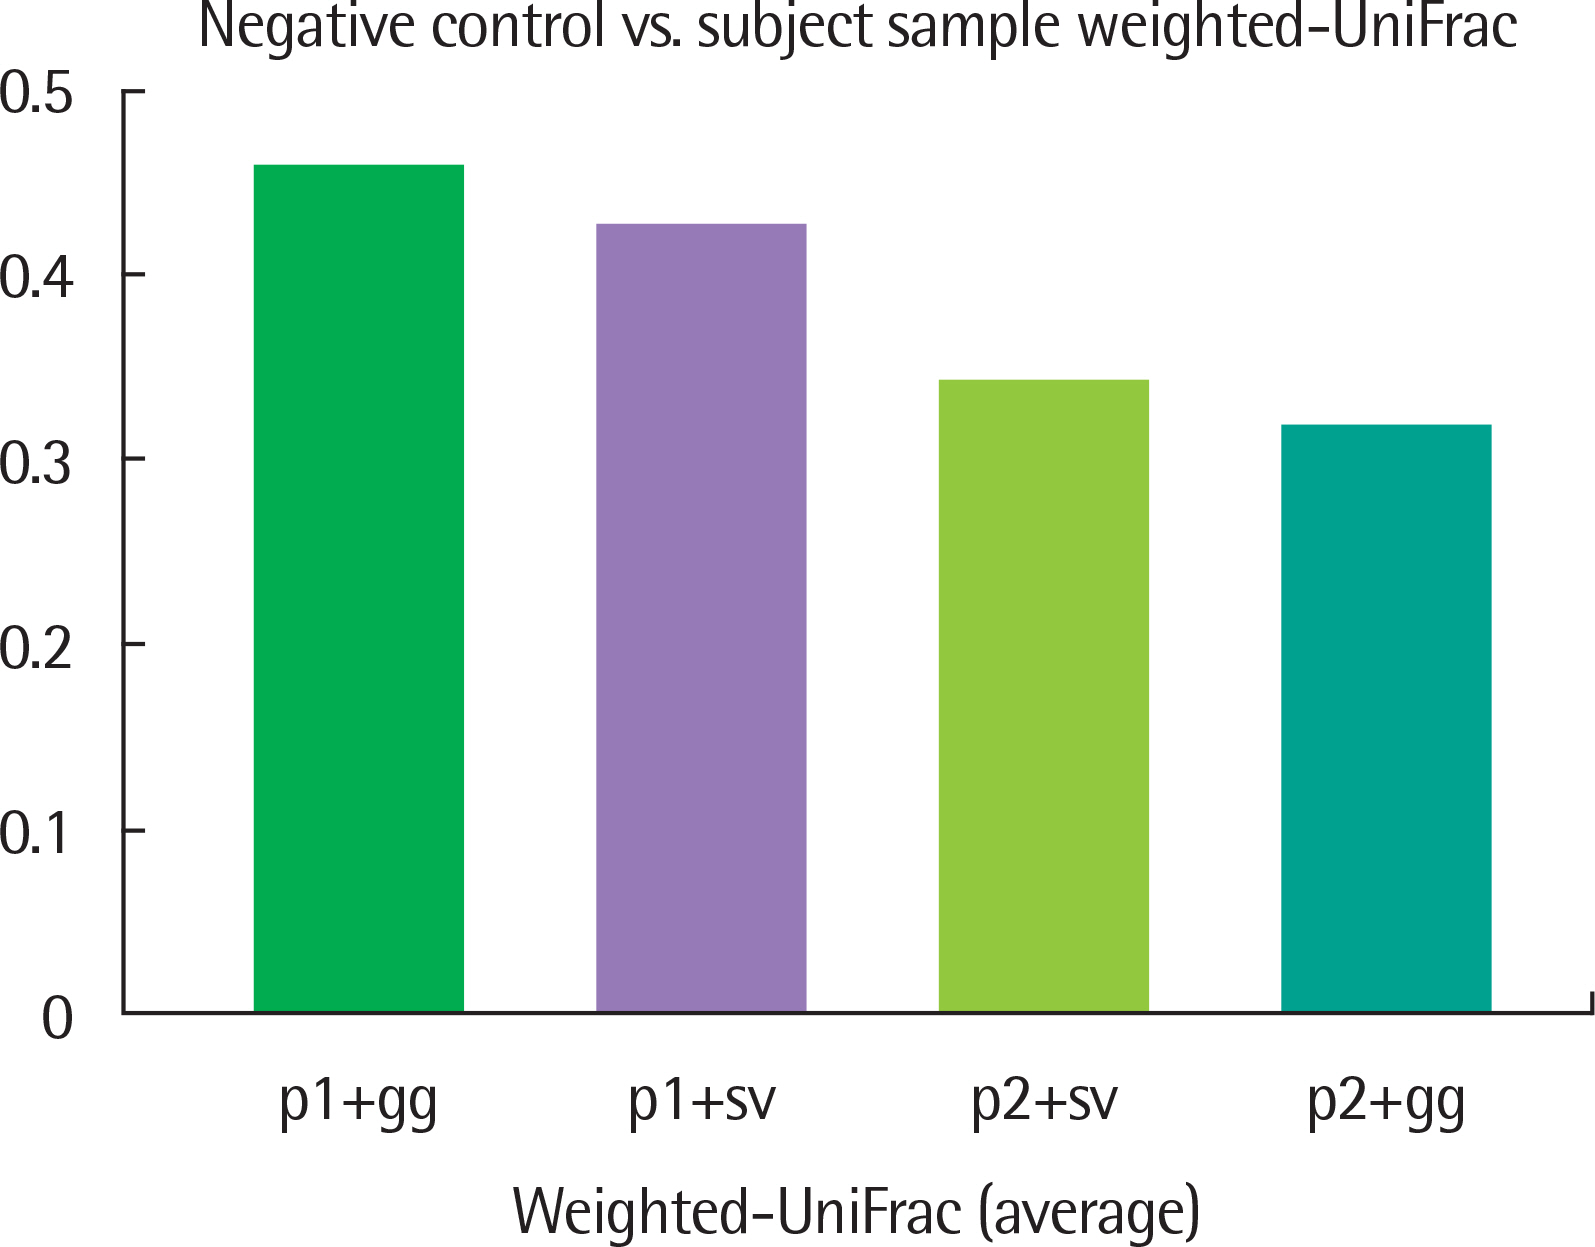
Fig. 5. Average weighted-UniFrac distance. The average of weighted-UniFrac distance between negative control and subject sample were sorted in descend-ing order. p1, Pipeline1; p2, Pipeline2; gg, Greengenes; sv, SILVA.
Reference
-
1. Staley JT, Konopka A. Measurement of in situ activities of nonphotosyn-thetic microorganisms in aquatic and terrestrial habitats. Annu Rev Microbiol. 1985; 39:321–46.
Article2. Zoetendal EG, Collier CT, Koike S, Mackie RI, Gaskins HR. Molecular ecological analysis of the gastrointestinal microbiota: a review. J Nutr. 2004; 134:465–72.
Article3. NIH HMP Working Group. Peterson J, Garges S, Giovanni M, McInnes P, Wang L, et al. The NIH Human Microbiome Project. Genome Res. 2009; 19:2317–23.4. Ley RE, Peterson DA, Gordon JI. Ecological and evolutionary forces shap-ing microbial diversity in the human intestine. Cell. 2006; 124:837–48.
Article5. Clemente JC, Ursell LK, Parfrey LW, Knight R. The impact of the gut microbiota on human health: an integrative view. Cell. 2012; 148:1258–70.
Article6. Lederberg J, McCray AT. ‘Ome sweet’ omics: a genealogical treasury of words. Scientist. 2001; 15:8–10.7. Grice EA, Segre JA. The human microbiome: our second genome. Annu Rev Genomics Hum Genet. 2012; 13:151–70.
Article8. Weinstock GM. Genomic approaches to studying the human microbiota. Nature. 2012; 489:250–6.
Article9. Morgan XC, Huttenhower C. Chapter 12: human microbiome analysis. PLoS Comput Biol. 2012; 8:e1002808.
Article10. Armougom F, Raoult D. Exploring microbial diversity using 16S rRNA high-throughput methods. J Comput Sci Syst Biol. 2009; 2:74–92.
Article11. Clarridge JE 3rd. Impact of 16S rRNA gene sequence analysis for identification of bacteria on clinical microbiology and infectious diseases. Clin Microbiol Rev. 2004; 17:840–62.
Article12. Balvociute M, Huson DH. SILVA, RDP, Greengenes, NCBI and OTT - how do these taxonomies compare? BMC Genomics. 2017; 18(Suppl 2):114.
Article13. Schloss PD. Application of a database-independent approach to assess the quality of operational taxonomic unit picking methods. mSystems. 2016; 1(2):pii: e00027-16.
Article14. Plummer E, Twin J, Bulach DM, Garland SM, Tabrizi SN. A comparison of three bioinformatics pipelines for the analysis of preterm gut microbiota using 16S rRNA gene sequencing data. J Proteomics Bioinform. 2015; 8:283–91.
Article15. Masella AP, Bartram AK, Truszkowski JM, Brown DG, Neufeld JD. PAN-DAseq: paired-end assembler for illumina sequences. BMC Bioinformatics. 2012; 13:31.
Article16. Rognes T, Flouri T, Nichols B, Quince C, Mahe F. VSEARCH: a versatile open source tool for metagenomics. PeerJ. 2016; 4:e2584.
Article17. Caporaso JG, Kuczynski J, Stombaugh J, Bittinger K, Bushman FD, Costel-lo EK, et al. QIIME allows analysis of high-throughput community sequencing data. Nat Methods. 2010; 7:335–6.
Article18. Edgar RC. Search and clustering orders of magnitude faster than BLAST. Bioinformatics. 2010; 26:2460–1.
Article19. DeSantis TZ, Hugenholtz P, Larsen N, Rojas M, Brodie EL, Keller K, et al. Greengenes, a chimera-checked 16S rRNA gene database and workbench compatible with ARB. Appl Environ Microbiol. 2006; 72:5069–72.
Article20. Quast C, Pruesse E, Yilmaz P, Gerken J, Schweer T, Yarza P, et al. The SIL-VA ribosomal RNA gene database project: improved data processing and web-based tools. Nucleic Acids Res. 2013; 41(Database issue):D590–6.
Article21. Magoc T, Salzberg SL. FLASH: fast length adjustment of short reads to improve genome assemblies. Bioinformatics. 2011; 27:2957–63.
Article22. Li W, Godzik A. Cd-hit: a fast program for clustering and comparing large sets of protein or nucleotide sequences. Bioinformatics. 2006; 22:1658–9.
Article23. Lozupone C, Knight R. UniFrac: a new phylogenetic method for comparing microbial communities. Appl Environ Microbiol. 2005; 71:8228–35.
Article
- Full Text Links
-
- Actions
-
Cited
- CITED
-
- Close
- Share
-
- Similar articles
-
- Gender-Specific Differences in Gut Microbiota Composition Associated with Microbial Metabolites for Patients with Acne Vulgaris
- Study of Conjunctival Microbial Flora in Patients of Intensive Care Unit
- Comparison of the oral microbial composition between healthy individuals and periodontitis patients in different oral sampling sites using 16S metagenome profiling
- Microbial Contamination of Reusable Suction Container and Cost Analysis of Reusable Suction Container and Disposable Suction Container
- Predictions of Sampling Site Based on Microbial Compositions Using a Decision Tree-based Method
