Comparative analysis of basal locomotor activity-related metabolic phenotypes between C57BL/6 mice and ICR mice substrains derived from three different sources
- Affiliations
-
- 1Exercise Biochemistry Laboratory, Korea National Sport University, 88-15 Oryun-dong, Songpa-gu, Seoul 138-763, Korea. chojy86@knsu.ac.kr
- 2Department of Microbiology and Immunology, INJE University College of Medicine, Busan 47392, Korea.
- 3College of Veterinary Medicine, Kyungpook National University, Daegu 41566, Korea.
- 4College of Pharmacy, Pusan National University, Busan 46241, Korea.
- 5Department of Biomaterials Science, College of Natural Resources & Life Science/Life and Industry Convergence Research Institute, Pusan National University, Miryang 50463, Korea.
- KMID: 2407428
- DOI: http://doi.org/10.5625/lar.2017.33.2.140
Abstract
- Animal model, as an indispensable tool for scientific purposes of biomedical researches and clinical application, is a commonly used in various researches. Regarding to this, it is necessary to establish the metabolic phenotype of animal model to minimize spurious interpretations and ensure a level of accuracy and reliability adequate for experimental research. However, the metabolic phenotype-related analysis within rodent strains derived from different source is nonexistent, especially in C57BL/6Korl mice and Korl:ICR mice (a domestic mouse strain). To compare the physiological and metabolic phenotypes over a period of time, we utilized the C57BL/6 mice (C57BL/6Korl, A:C57BL/6, and B:C57BL/6) and ICR mice (Korl:ICR, A:ICR, and B:ICR) derived from three different sources. Our data showed that average body weight, body temperature, food intake, and water consumption have a similar tendency among the C57BL/6 and ICR groups, except for the higher body weight of C57BL/6Korl mice over a period of time. Moreover, some significant differences was observed in adipose tissue mass and adipocyte size among the groups, with a higher tendency of C57BL/6Korl mice and Korl:ICR mice. Most importantly, resting metabolic rate (RMR) serves as an approximation of the metabolic phenotype showed no significant difference among the groups of C57BL/6 mice and ICR mice, except for the lower oxygen uptake of C57BL/6Korl mice compare to the A:C57BL/6 mice. Taken together, our data suggest that C57BL/6 mice and ICR mice derived from three different sources have an overall similar feature of physiological and metabolic phenotypes.
MeSH Terms
Figure
-

Figure 1 Comparative analysis of the physiological features of three C57BL/6 subgroups and three ICR subgroups. (A) Body weight changes over a period of time in C57BL/6 mice. (B, C) Average body weight and body temperature of C57BL/6 mice. (D, E) Changes in food intake and water consumption over a period of time in C57BL/6 mice. F) Body weight changes over a period of time in ICR mice. (G, H) Average body weight and body temperature in ICR mice. (I, J) Changes in food intake and water consumption over a period of time in ICR mice. Values are presented as mean±SD (5 mice per subgroup); *P<0.05 versus the C57BL/6Korl subgroup.

Figure 2 Comparative analysis of adipose tissue mass and adipocyte size among three C57BL/6 subgroups. (A) Epididymal adipose tissue mass. B) Retroperitoneal adipose tissue mass. (C, D) Histological analysis of epididymal and retroperitoneal adipose tissue. (E) Epididymal adipocyte size. (F) Retroperitoneal adipocyte size. Scale bar: 200 µm. Values for each subgroup are presented as mean±SD from 5 mice.

Figure 3 Comparative analysis of adipose tissue mass and adipocyte size among three ICR subgroups. (A) Epididymal adipose tissue mass. B) Retroperitoneal adipose tissue mass. (C, D) Histological analysis of epididymal and retroperitoneal adipose tissue. (E) Epididymal adipocyte size. (F) Retroperitoneal adipocyte size. Scale bar: 200 µm. Values for each subgroup are presented as mean±SD from 5 mice.
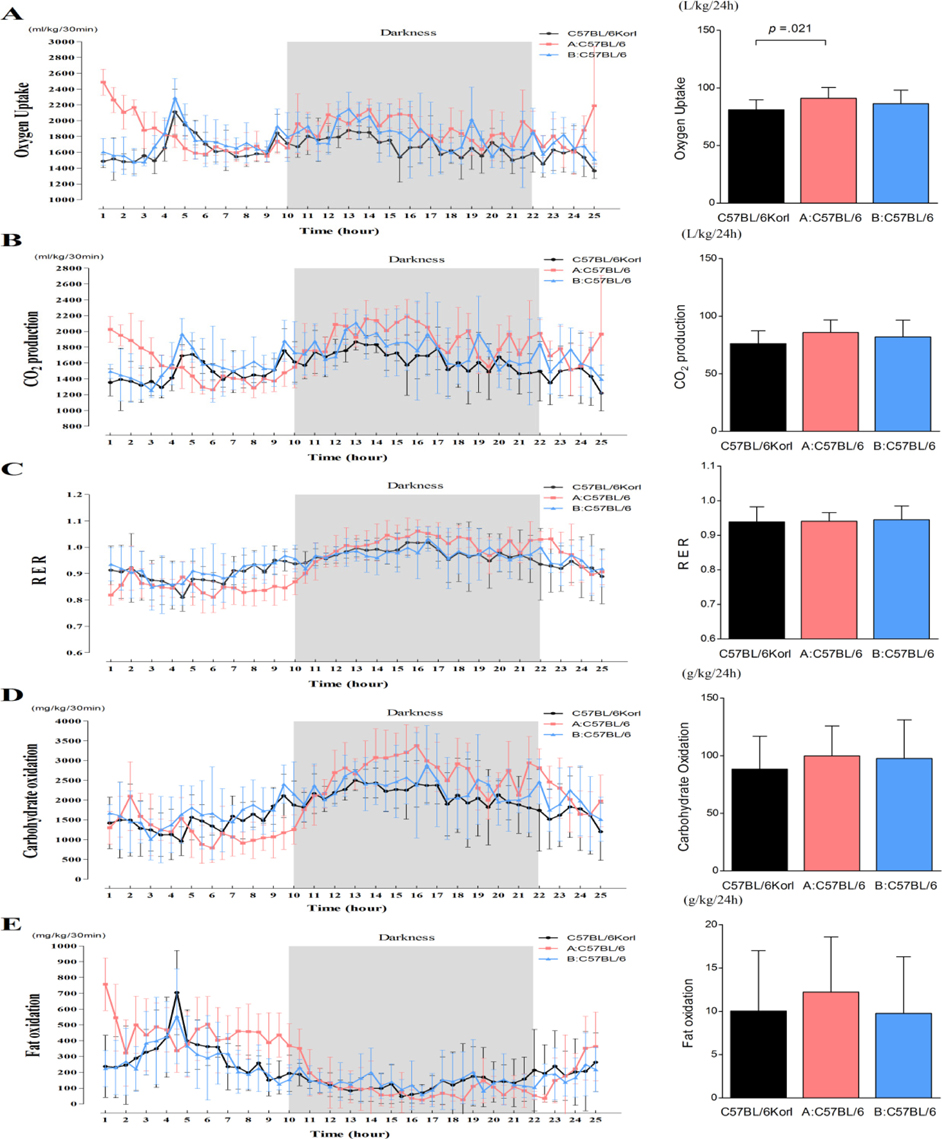
Figure 4 Comparative analysis of the metabolic phenotypes of three C57BL/6 subgroups during a period of 24 hours at RMR. (A) Changes of oxygen uptake (left) and total oxygen uptake (right), (B) Changes in CO2 production (left) and total oxygen uptake (right), (C) Changes of RER value (left) and average RER (right), (D) Changes of carbohydrate oxidation (left) and total carbohydrate oxidation (right), and (E) Changes of fat oxidation (left) and total fat oxidation (right). Values are presented as mean±SD; each subgroup consisted of 4-5 mice.

Figure 5 Comparative analysis of the metabolic phenotypes of three ICR subgroups during a period of 24 hours at RMR. (A) Changes of oxygen uptake (left) and total oxygen uptake (right), (B) Changes in CO2 production (left) and total oxygen uptake (right), (C) Changes of RER value (left) and average RER (right), (D) Changes of carbohydrate oxidation (left) and total carbohydrate oxidation (right), and (E) Changes of fat oxidation (left) and total fat oxidation (right). Values are presented as mean±SD; each subgroup consisted of 4-5 mice.
Reference
-
1. Ericsson AC, Crim MJ, Franklin CL. A brief history of animal modeling. Mo Med. 2013; 110(3):201–205.2. Azzu V, Valencak TG. Energy Metabolism and Ageing in the Mouse: A Mini-Review. Gerontology. 2017; 63(4):327–336.3. Ellenbroek B, Youn J. Rodent models in neuroscience research: is it a rat race? Dis Model Mech. 2016; 9(10):1079–1087.4. Duarte LC, Speakman JR. Low resting metabolic rate is associated with greater lifespan because of a confounding effect of body fatness. Age (Dordr). 2014; 36(6):9731.5. Manini TM. Energy expenditure and aging. Ageing Res Rev. 2010; 9(1):1–11.6. Hulbert AJ, Else PL. Basal metabolic rate: history, composition, regulation, and usefulness. Physiol Biochem Zool. 2004; 77(6):869–876.7. Van Klinken JB, van den Berg SA, Havekes LM, Willems Van Dijk K. Estimation of activity related energy expenditure and resting metabolic rate in freely moving mice from indirect calorimetry data. PLoS One. 2012; 7(5):e36162.8. Wone B, Sears MW, Labocha MK, Donovan ER, Hayes JP. Genetic variances and covariances of aerobic metabolic rates in laboratory mice. Proc Biol Sci. 2009; 276(1673):3695–3704.9. Song SH, Kim JE, Go J, Koh EK, Sung JE, Lee HA, Choi KM, Kim HD, Jung YS, Kim KS, Hwang DY. Comparison of the response using ICR mice derived from three different sources to ethanol/hydrochloric acid-induced gastric injury. Lab Anim Res. 2016; 32(1):56–64.10. Chia R, Achilli F, Festing MF, Fisher EM. The origins and uses of mouse outbred stocks. Nat Genet. 2005; 37(11):1181–1186.11. Selman C, Lumsden S, Bünger L, Hill WG, Speakman JR. Resting metabolic rate and morphology in mice (Mus musculus) selected for high and low food intake. J Exp Biol. 2001; 204(Pt 4):777–784.12. Speakman JR. Measuring energy metabolism in the mouse-theoretical, practical, and analytical considerations. Front Physiol. 2013; 4:34.13. Gim MN, Choi JH. The effects of weekly exercise time on VO2max and resting metabolic rate in normal adults. J Phys Ther Sci. 2016; 28(4):1359–1363.14. Kim JE, Yun WB, Sung JE, Lee HA, Choi JY, Choi YS, Jung YS, Kim KS, Hwang DY. Characterization the response of Korl:ICR mice to loperamide induced constipation. Lab Anim Res. 2016; 32(4):231–240.15. Parlee SD, Lentz SI, Mori H, MacDougald OA. Quantifying size and number of adipocytes in adipose tissue. Methods Enzymol. 2014; 537:93–122.16. Kim J, Park J, Kim B, Lee CH, Lim K, Suh H. Effects of Silk Peptides Administration on Fat Utilization Over a Whole Day in Mice. J Exerc Nutr Biochem. 2016; 20(4):53–59.17. Angus DJ, Hargreaves M, Dancey J, Febbraio MA. Effect of carbohydrate or carbohydrate plus medium-chain triglyceride ingestion on cycling time trial performance. J Appl Physiol (1985). 2000; 88(1):113–119.18. Ishihara K, Oyaizu S, Onuki K, Lim K, Fushiki T. Chronic (-)-hydroxycitrate administration spares carbohydrate utilization and promotes lipid oxidation during exercise in mice. J Nutr. 2000; 130(12):2990–2995.19. Talan M. Body temperature of C57BL/6J mice with age. Exp Gerontol. 1984; 19(1):25–29.20. Hunter JE, Butterworth J, Perkins ND, Bateson M, Richardson CA. Using body temperature, food and water consumption as biomarkers of disease progression in mice with Eμ-myc lymphoma. Br J Cancer. 2014; 110(4):928–934.21. Talan MI, Engel BT. Temporal decrease of body temperature in middle-aged C57BL/6J mice. J Gerontol. 1986; 41(1):8–12.22. Yang Y, Smith DL Jr, Keating KD, Allison DB, Nagy TR. Variations in body weight, food intake and body composition after long-term high-fat diet feeding in C57BL/6J mice. Obesity (Silver Spring). 2014; 22(10):2147–2155.23. Mekada K, Abe K, Murakami A, Nakamura S, Nakata H, Moriwaki K, Obata Y, Yoshiki A. Genetic differences among C57BL/6 substrains. Exp Anim. 2009; 58(2):141–149.24. Chiu CL, Morgan CT, Lupton SJ, Lind JM. Parent of origin influences the cardiac expression of vascular endothelial growth factor (Vegfa). BMC Med Genet. 2013; 14:43.25. Santos WJ, Melige M, Chakraborty N, Meyerhoff J, Hammamieh R, Jett M. Strain differences in response to stress: Territorial urine markings, body weight, and temperature. FASEB J. 2012; 26:1 Supplement. 798.24.26. Coelho M, Oliveira T, Fernandes R. Biochemistry of adipose tissue: an endocrine organ. Arch Med Sci. 2013; 9(2):191–200.27. Trayhurn P, Beattie JH. Physiological role of adipose tissue: white adipose tissue as an endocrine and secretory organ. Proc Nutr Soc. 2001; 60(3):329–339.28. Rydén M, Andersson DP, Bergström IB, Arner P. Adipose tissue and metabolic alterations: regional differences in fat cell size and number matter, but differently: a cross-sectional study. J Clin Endocrinol Metab. 2014; 99(10):E1870–E1876.29. Jansson E, Kaijser L. Substrate utilization and enzymes in skeletal muscle of extremely endurance-trained men. J Appl Physiol (1985). 1987; 62(3):999–1005.30. Kane SL, Garland T Jr, Carter PA. Basal metabolic rate of aged mice is affected by random genetic drift but not by selective breeding for high early-age locomotor activity or chronic wheel access. Physiol Biochem Zool. 2008; 81(3):288–300.
- Full Text Links
-
- Actions
-
Cited
- CITED
-
- Close
- Share
-
- Similar articles
-
- Erratum: Comparative analysis of basal locomotor activity-related metabolic phenotypes between C57BL/6 mice and ICR mice substrains derived from three different sources
- Comparative analysis of restraint stress-induced depressive-like phenotypes in C57BL/6N mice derived from three different sources
- Comparison of humoral and cell-mediated immunity in three different C57BL/6N mouse substrains
- Comparative study of the immunological characteristics of three different C57BL/6N mouse substrains
- Immunohistochemical Study on the Distribution of Neuropeptide Yand NADPH-Diaphorase Positive Neurons in the Cerebral Cortex of Mice
