The advantage of topographic prominence-adopted filter for the detection of short-latency spikes of retinal ganglion cells
- Affiliations
-
- 1Department of Physiology, Chungbuk National University School of Medicine, Cheongju 28644, Korea. ysgoo@chungbuk.ac.kr
- 2Department of Biomedical Engineering, University of Ulsan, Ulsan 44610, Korea. kikoo@ulsan.ac.kr
- 3Department of Electronics and Control Engineering, Hanbat National University, Daejeon 34158, Korea.
- 4Ajman University School of Medicine, PO Box 346, Ajman, United Arab Emirates.
- 5Department of Electrical and Computer Engineering, Seoul National University, Seoul 08826, Korea.
- KMID: 2388700
- DOI: http://doi.org/10.4196/kjpp.2017.21.5.555
Abstract
- Electrical stimulation through retinal prosthesis elicits both short and long-latency retinal ganglion cell (RGC) spikes. Because the short-latency RGC spike is usually obscured by electrical stimulus artifact, it is very important to isolate spike from stimulus artifact. Previously, we showed that topographic prominence (TP) discriminator based algorithm is valid and useful for artifact subtraction. In this study, we compared the performance of forward backward (FB) filter only vs. TP-adopted FB filter for artifact subtraction. From the extracted retinae of rd1 mice, we recorded RGC spikes with 8×8 multielectrode array (MEA). The recorded signals were classified into four groups by distances between the stimulation and recording electrodes on MEA (200-400, 400-600, 600-800, 800-1000 µm). Fifty cathodic phase-1(st) biphasic current pulses (duration 500 µs, intensity 5, 10, 20, 30, 40, 50, 60 µA) were applied at every 1 sec. We compared false positive error and false negative error in FB filter and TP-adopted FB filter. By implementing TP-adopted FB filter, short-latency spike can be detected better regarding sensitivity and specificity for detecting spikes regardless of the strength of stimulus and the distance between stimulus and recording electrodes.
Keyword
MeSH Terms
Figure
-
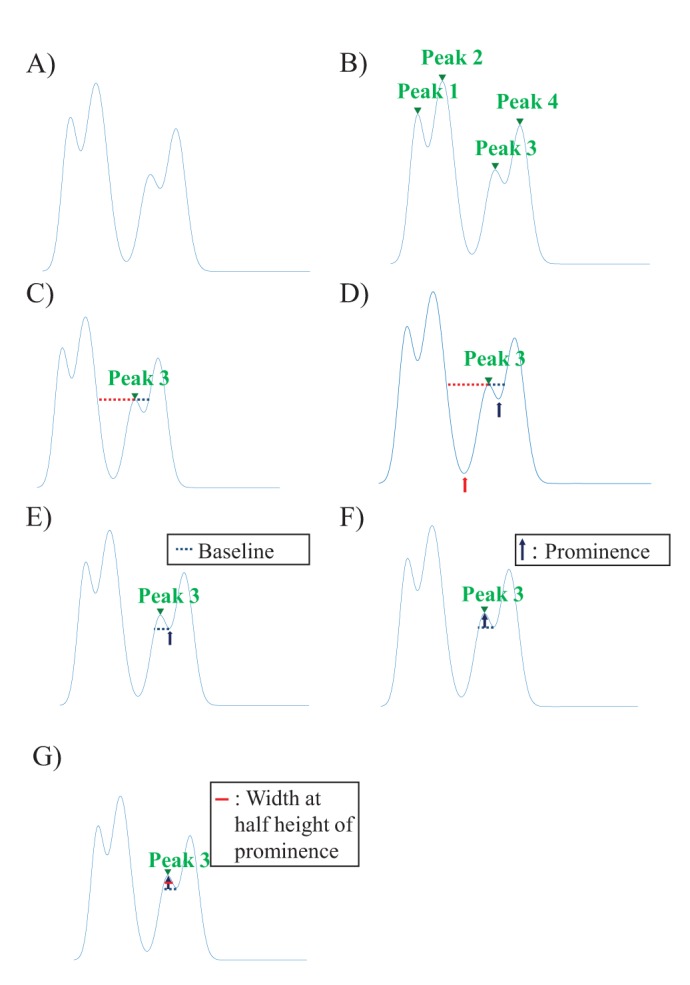
Fig. 1 Concept of the width at the half height of the prominence.(A) The raw data which could be any kind of data, for example, recorded neuronal signal, geological height information, etc. (B) The process of finding local peaks of the signal. (C) Extending horizontal lines from the peak found (peak 3, green arrow head) toward the left (red colored dotted line) and right direction (black colored dotted line). (D) Finding the minimum point of each valley below each horizontal line. (E) Selecting the baseline of peak 3. (F) Defining the height of the prominence (black arrow) of peak 3. (G) Calculating the width at the half height of the prominence.

Fig. 2 Flow chart of artifact subtraction.The depegging step changes saturated artifact value to zero. After the depegging, the remaining signals are filtered with 100 Hz high pass for baseline stabilization. In the process of TP-adopted FB filtering, residual artifacts (over 1.6 ms duration) are separately examined. If the duration at the half height of prominence is under 0.4 ms or if the full duration of the wave is under 1.6 ms, the signal is processed with 500 Hz high pass filtering for spike detection. The signal containing the spike-candidates is then thresholded for spike detection.

Fig. 3 MEA recording and electrical stimulation.(A) One electrode was used for stimulation (asterisk in the center), while all the others for recording. The recorded signals were classified into four groups by distances between the stimulus and recording electrodes on MEA (200~400, 400~600, 600~800, 800~1000 µm). (B) The stimuli consists of cathodic phase-1st biphasic current pulses (Duration (D): 500 µs, Amplitude intensity (A): 5, 10, 20, 30, 40, 50, 60 µA, Inter-stimulus interval (I): 1000 ms, Repetition (R): 50 times).
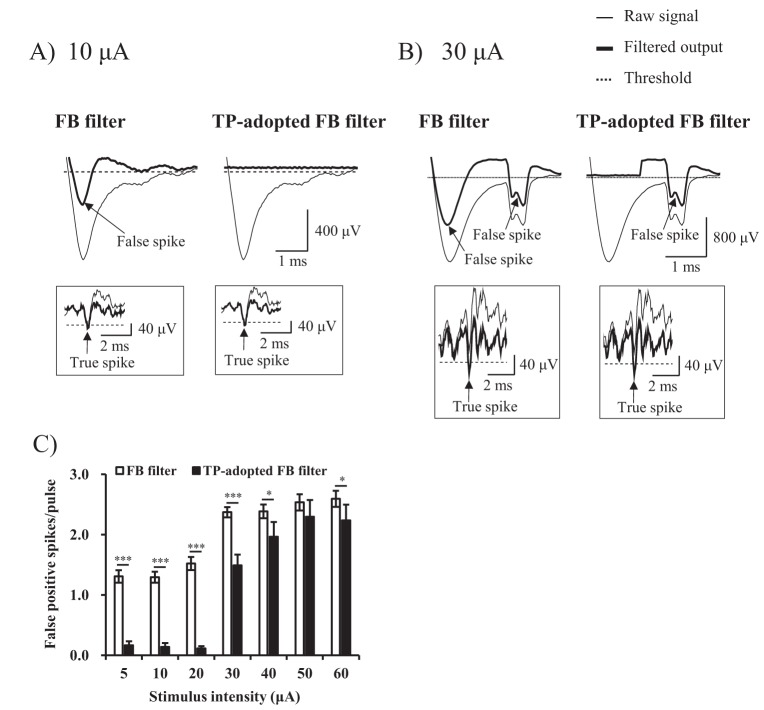
Fig. 4 Comparison of false positive error at 200~400 µm inter-electrode distance.(A, B) The performance of two algorithms at stimulus intensity of 10 µA and 30 µA were shown respectively. The thin and thick lines represent raw signal, and filtered output (artifact-subtracted) signal respectively. The dotted line represents threshold value for sorting RGC spikes from noise. The arrows indicate false positive spikes (Inset: true positive spike). (C) False positive error rates (false positive spikes/pulse) of two algorithms were statistically analyzed at all stimulus intensities.
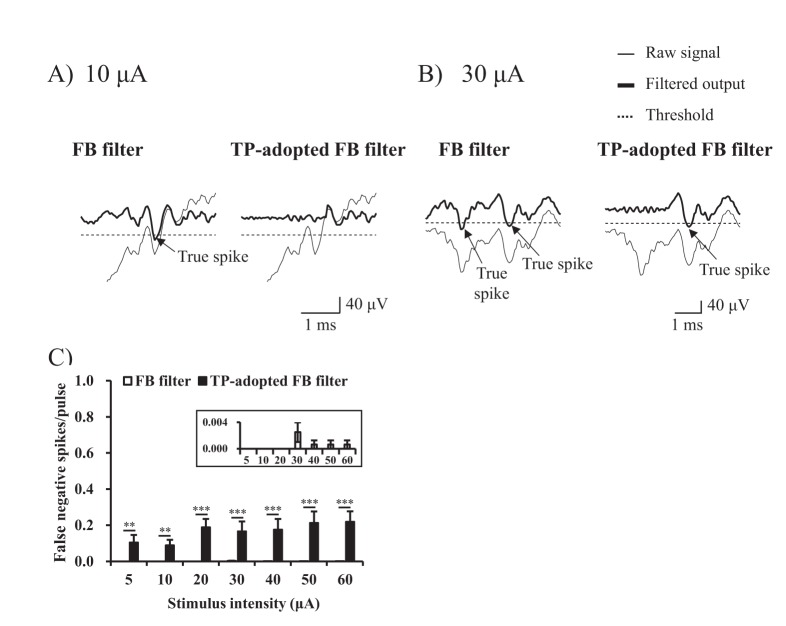
Fig. 5 Comparison of false negative error at 200~400 µm inter-electrode distance.(A, B) The performance of two algorithms at stimulus intensity of 10 µA and 30 µA were shown respectively. The thin and thick lines represent raw signal, and filtered output (artifact-subtracted) signal respectively. The dotted line represents threshold value for sorting RGC spikes from noise (Symbols: arrow=true positive spike). (C) False negative error rates (false negative spikes/pulse) of two algorithms were statistically analyzed at all stimulus intensities (Inset: To view false negative error rates of FB filter, the scale was zoomed in).

Fig. 6 Comparison of false positive error according to incremental distances of electrodes.(A, B) The performance of two algorithms at stimulus intensity of 10 µA and 30 µA were shown respectively at 600~800 µm inter-electrode distance. The thin and thick lines represent raw signal, and filtered output (artifact-subtracted) signal respectively. The dotted line represents threshold value for sorting RGC spikes from noise. The arrows indicate false positive spikes (Inset: true positive spike). (C~E) False positive error rates (false positive spikes/pulse) of two algorithms at all stimulus intensities were statistically analyzed in terms of inter-electrode distance.
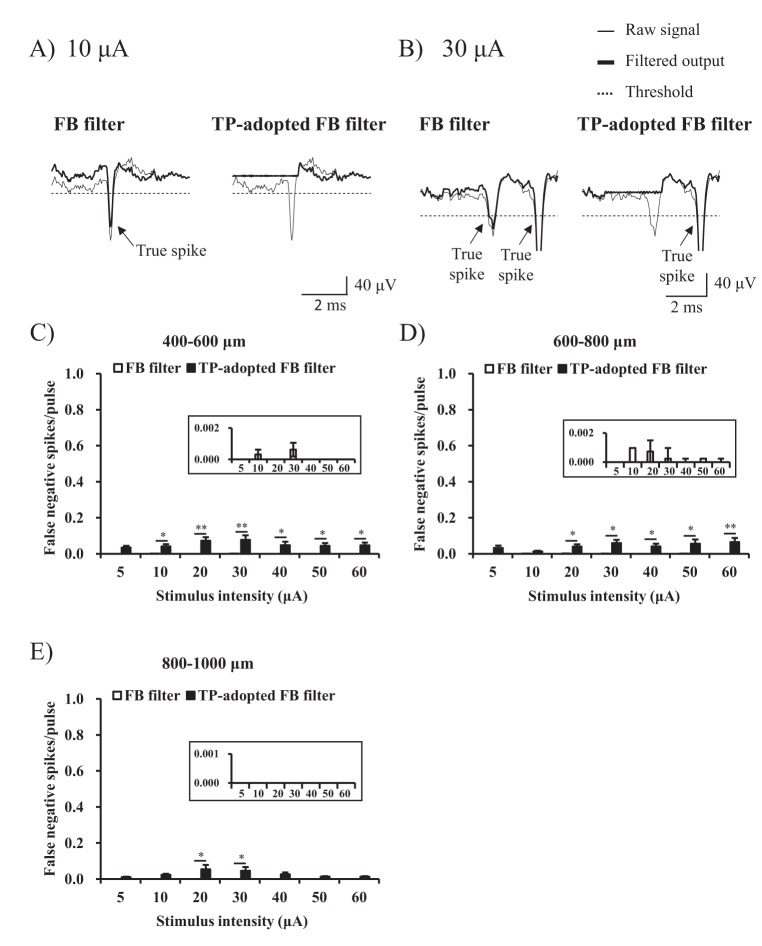
Fig. 7 Comparison of false negative error according to incremental distances of electrodes.(A, B) The performance of two algorithms at stimulus intensity of 10 µA and 30 µA were shown respectively at 600~800 µm inter-electrode distance. The thin and thick lines represent raw signal, and filtered output (artifact-subtracted) signal respectively. The dotted line represents threshold value for sorting RGC spikes from noise (Symbols: arrow=true positive spike). (C~E) False negative error rates (false negative spikes/pulse) of two algorithms at all stimulus intensities were statistically analyzed in terms of inter-electrode distance (Inset: To view false negative error rates of FB filter, the scales were zoomed in).
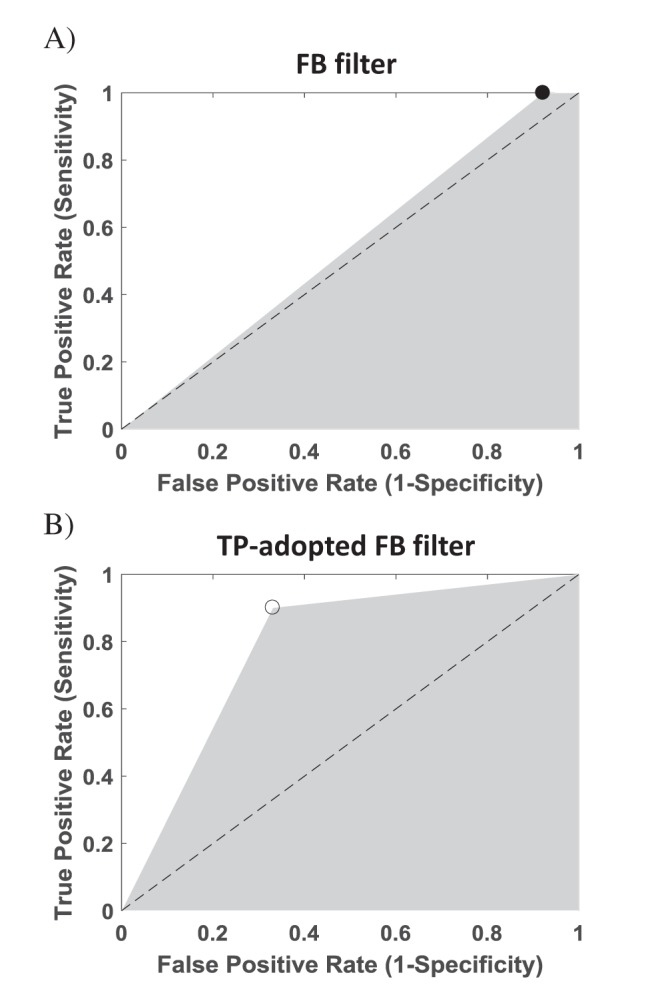
Fig. 8 Area under the curve (AUC ) graph.(A, B) The AUC graphs of two algorithms were displayed. The areas of grey quadrangle represent AUC value.
Cited by 1 articles
-
Multiple consecutive-biphasic pulse stimulation improves spatially localized firing of retinal ganglion cells in the degenerate retina
Jungryul Ahn, Yongseok Yoo, Yong Sook Goo
Korean J Physiol Pharmacol. 2023;27(6):541-553. doi: 10.4196/kjpp.2023.27.6.541.
Reference
-
1. Shintani K, Shechtman DL, Gurwood AS. Review and update: current treatment trends for patients with retinitis pigmentosa. Optometry. 2009; 80:384–401. PMID: 19545852.
Article3. Kim SY, Sadda S, Pearlman J, Humayun MS, de Juan E Jr, Melia BM, Green WR. Morphometric analysis of the macula in eyes with disciform age-related macular degeneration. Retina. 2002; 22:471–477. PMID: 12172115.
Article4. Mazzoni F, Novelli E, Strettoi E. Retinal ganglion cells survive and maintain normal dendritic morphology in a mouse model of inherited photoreceptor degeneration. J Neurosci. 2008; 28:14282–14292. PMID: 19109509.
Article5. Santos A, Humayun MS, de Juan E Jr, Greenburg RJ, Marsh MJ, Klock IB, Milam AH. Preservation of the inner retina in retinitis pigmentosa A morphometric analysis. Arch Ophthalmol. 1997; 115:511–515. PMID: 9109761.6. Stone JL, Barlow WE, Humayun MS, de Juan E Jr, Milam AH. Morphometric analysis of macular photoreceptors and ganglion cells in retinas with retinitis pigmentosa. Arch Ophthalmol. 1992; 110:1634–1639. PMID: 1444925.
Article7. Stingl K, Bartz-Schmidt KU, Besch D, Chee CK, Cottriall CL, Gekeler F, Groppe M, Jackson TL, MacLaren RE, Koitschev A, Kusnyerik A, Neffendorf J, Nemeth J, Naeem MA, Peters T, Ramsden JD, Sachs H, Simpson A, Singh MS, Wilhelm B, Wong D, Zrenner E. Subretinal visual implant alpha IMS−clinical trial interim report. Vision Res. 2015; 111:149–160. PMID: 25812924.8. Luo YH, da Cruz L. The argus® II retinal prosthesis system. Prog Retin Eye Res. 2016; 50:89–107. PMID: 26404104.
Article9. Ahn KN, Ahn JY, Kim JH, Cho K, Koo KI, Senok SS, Goo YS. Effect of stimulus waveform of biphasic current pulse on retinal ganglion cell responses in retinal degeneration (rd1) mice. Korean J Physiol Pharmacol. 2015; 19:167–175. PMID: 25729279.
Article10. Boinagrov D, Pangratz-Fuehrer S, Goetz G, Palanker D. Selectivity of direct and network-mediated stimulation of the retinal ganglion cells with epi-, sub- and intraretinal electrodes. J Neural Eng. 2014; 11:026008. PMID: 24608166.
Article11. Jensen RJ, Ziv OR, Rizzo JF 3rd. Thresholds for activation of rabbit retinal ganglion cells with relatively large, extracellular microelectrodes. Invest Ophthalmol Vis Sci. 2005; 46:1486–1496. PMID: 15790920.
Article12. Lee SW, Eddington DK, Fried SI. Responses to pulsatile subretinal electric stimulation: effects of amplitude and duration. J Neurophysiol. 2013; 109:1954–1968. PMID: 23343891.
Article13. Sekirnjak C, Hottowy P, Sher A, Dabrowski W, Litke AM, Chichilnisky EJ. Electrical stimulation of mammalian retinal ganglion cells with multielectrode arrays. J Neurophysiol. 2006; 95:3311–3327. PMID: 16436479.
Article14. Stett A, Barth W, Weiss S, Haemmerle H, Zrenner E. Electrical multisite stimulation of the isolated chicken retina. Vision Res. 2000; 40:1785–1795. PMID: 10814763.
Article15. Im M, Fried SI. Indirect activation elicits strong correlations between light and electrical responses in ON but not OFF retinal ganglion cells. J Physiol. 2015; 593:3577–3596. PMID: 26033477.
Article16. Grumet AE. Electric stimulation parameters for an epi-retinal prosthesis. (dissertation). Department of Electrical Engineering and Computer Science, Cambridge, MA: Massachusetts Institute of Technology;1999.17. Nagel JH. Biopotential amplifiers. In : Bronzino JD, editor. The biomedical engineering handbook. Boca Raton: CRC Press;1995. p. 1185–1195.18. Fried SI, Hsueh HA, Werblin FS. A method for generating precise temporal patterns of retinal spiking using prosthetic stimulation. J Neurophysiol. 2006; 95:970–978. PMID: 16236780.
Article19. Ryu SB, Ye JH, Lee JS, Goo YS, Kim CH, Kim KH. Electrically-evoked neural activities of rd1 mice retinal ganglion cells by repetitive pulse stimulation. Korean J Physiol Pharmacol. 2009; 13:443–448. PMID: 20054490.
Article20. Miller CA, Abbas PJ, Robinson BK, Rubinstein JT, Matsuoka AJ. Electrically evoked single-fiber action potentials from cat: responses to monopolar, monophasic stimulation. Hear Res. 1999; 130:197–218. PMID: 10320109.
Article21. Heffer LF, Fallon JB. A novel stimulus artifact removal technique for high-rate electrical stimulation. J Neurosci Methods. 2008; 170:277–284. PMID: 18339428.
Article22. Erickson JC, Velasco-Castedo R, Obioha C, Cheng LK, Angeli TR, O'Grady G. Automated algorithm for GI spike burst detection and demonstration of efficacy in ischemic small intestine. Ann Biomed Eng. 2013; 41:2215–2228. PMID: 23612912.
Article23. Killian NJ, Vernekar VN, Potter SM, Vukasinovic J. A device for long-term perfusion, imaging, and electrical interfacing of brain tissue in vitro. Front Neurosci. 2016; 10:135. PMID: 27065793.
Article24. Pan L, Alagapan S, Franca E, Leondopulos SS, DeMarse TB, Brewer GJ, Wheeler BC. An in vitro method to manipulate the direction and functional strength between neural populations. Front Neural Circuits. 2015; 9:32. PMID: 26236198.
Article25. Choi MH, Ahn J, Park DJ, Lee SM, Kim K, Cho DD, Senok SS, Koo KI, Goo YS. Topographic prominence discriminator for the detection of short-latency spikes of retinal ganglion cells. J Neural Eng. 2017; 14:016017. PMID: 28045002.
Article26. Llobera M. Building past landscape perception with GIS: understanding topographic prominence. J Archaeol Sci. 2001; 28:1005–1014.
Article27. Bullock TH, Horridge AG. Structure and function in the nervous systems of invertebrates. San Francisco, London: W. H. Freeman & Co.;1965.28. Wagenaar DA, Potter SM. Real-time multi-channel stimulus artifact suppression by local curve fitting. J Neurosci Methods. 2002; 120:113–120. PMID: 12385761.
Article29. Fawcett T. An introduction to ROC analysis. Pattern Recognit Lett. 2006; 27:861–874.
Article30. Kuffler SW. Discharge patterns and functional organization of mammalian retina. J Neurophysiol. 1953; 16:37–68. PMID: 13035466.
Article31. Margolis DJ, Newkirk G, Euler T, Detwiler PB. Functional stability of retinal ganglion cells after degeneration-induced changes in synaptic input. J Neurosci. 2008; 28:6526–6536. PMID: 18562624.
Article
- Full Text Links
-
- Actions
-
Cited
- CITED
-
- Close
- Share
-
- Similar articles
-
- Spontaneous Oscillatory Rhythm in Retinal Activities of Two Retinal Degeneration (rd1 and rd10) Mice
- Comparison of Retinal Waveform between Normal and rd/rd Mouse
- NF-kappa B activation following optic nerve transection
- The Changes of the Retinal Ganglional Cells in the Pressure-induced Ischemic Rabbit Retina
- Multiple consecutive-biphasic pulse stimulation improves spatially localized firing of retinal ganglion cells in the degenerate retina
