Multiple consecutive-biphasic pulse stimulation improves spatially localized firing of retinal ganglion cells in the degenerate retina
- Affiliations
-
- 1Department of Physiology, Chungbuk National University School of Medicine, Cheongju 28644, Korea
- 2School of Computer Science and Engineering, Soongsil University, Seoul 06978, Korea
- KMID: 2547320
- DOI: http://doi.org/10.4196/kjpp.2023.27.6.541
Abstract
- Retinal prostheses have shown some clinical success in restoring vision in patients with retinitis pigmentosa. However, the post-implantation visual acuity does not exceed that of legal blindness. The reason for the poor visual acuity might be that (1) degenerate retinal ganglion cells (RGCs) are less responsive to electrical stimulation than normal RGCs, and (2) electrically-evoked RGC spikes show a more widespread not focal response. The single-biphasic pulse electrical stimulation, commonly used in artificial vision, has limitations in addressing these issues. In this study, we propose the benefit of multiple consecutive-biphasic pulse stimulation. We used C57BL/6J mice and C3H/HeJ (rd1) mice for the normal retina and retinal degeneration model. An 8 × 8 multi-electrode array was used to record electrically-evoked RGC spikes. We compared RGC responses when increasing the amplitude of a single biphasic pulse versus increasing the number of consecutive biphasic pulses at the same stimulus charge. Increasing the amplitude of a single biphasic pulse induced more RGC spike firing while the spatial resolution of RGC populations decreased. For multiple consecutive-biphasic pulse stimulation, RGC firing increased as the number of pulses increased, and the spatial resolution of RGC populations was well preserved even up to 5 pulses. Multiple consecutive-biphasic pulse stimulation using two or three pulses in degenerate retinas induced as much RGC spike firing as in normal retinas. These findings suggest that the newly proposed multiple consecutive-biphasic pulse stimulation can improve the visual acuity in prosthesis-implanted patients.
Keyword
Figure
-

Fig. 1 Stimulus protocols used in the experiment. (A) Single-pulse stimulation. Pulse amplitudes range from 10 to 50 μA with pulse duration fixed at 250 μs are applied once per second. (B) Burst stimulation. The number of pulses per burst ranges from 1 to 5, with pulse duration fixed at 250 μs. (C) Burst stimulation. 1–20 pulses per burst. Pulse amplitude: 30 μA. Pulse duration: 100 μs. (D) Burst stimulation. 1–3 pulses per burst. Pulse amplitudes: 30 or 50 μA. Pulse duration: 100 μs.

Fig. 2 Comparison of electrically-evoked RGC spikes between single-pulse and burst stimulation in the WT retina. (A) Left inset: MEA positions of the stimulation (channel 26, marked with a red dot) and recording (channel 36, marked with a yellow dot) electrodes spaced 200 μm apart. Left panel: Typical responses of the WT RGC to single-pulse stimulation are shown as raster plots. Electrically-evoked RGC spikes are highlighted. The time window for the raster plots is set to ± 0.1 sec, with 0 sec representing the stimulus onset (red dashed line). For each raster plot (10 trials), the pulse amplitude increases from top to bottom (10–50 μA). The pulse duration is fixed at 250 μs/phase. Middle panel: Typical responses of the WT RGC to burst stimulation are shown as raster plots. For each raster plot, the pulse number increases from top to bottom (#1–#5). Right panel: RGC response curves to single-pulse and burst stimulation in WT RGCs located 200 μm away from the stimulation electrode. Error bars represent the standard error of the mean (SEM). Statistical differences in response curves are indicated by asterisks (*p < 0.05). (B) Left and Middle panels: same representative raster plots of WT RGCs located 600 μm away from the stimulation electrode. Right panel: RGC response curves to single-pulse and burst stimulation in WT RGCs located 600 μm away from the stimulation electrode. Statistical differences in the graphs are indicated by asterisks (*p < 0.05, ***p < 0.001). (C) Changes in normalized responses with the distance between stimulation and recording electrodes. Left panel: single-pulse stimulation. The inset (spatial MEA color map) shows the normalized RGC responses in one representative retinal patch upon electrical stimulation with a pulse amplitude of 50 μA. The red dot indicates the location of the stimulation electrode. Right panel: burst stimulation. The inset (spatial MEA color map) shows the normalized RGC responses in one representative retinal patch upon electrical stimulation with five pulses per burst. RGC, retinal ganglion cell; WT, wild-type; MEA, multi-electrode array.

Fig. 3 Comparison of electrically-evoked RGC spikes between single-pulse and burst stimulation in the RD retina. (A) Left inset: MEA positions of the stimulation (channel 52, marked with a red dot) and recording (channel 53, marked with a yellow dot) electrodes spaced 200 μm apart. Left panel: Typical responses of the RD RGC to single-pulse stimulation are shown as raster plots. Electrically-evoked RGC spikes are highlighted. The time window for the raster plots is set to ± 0.1 sec, with 0 sec representing the stimulus onset (red dashed line). For each raster plot (10 trials), the pulse amplitude increases from top to bottom (10–50 μA). The pulse duration is fixed at 250 μs/phase. Middle panel: Typical responses of the RD RGC to burst stimulation are shown as raster plots. For each raster plot, the pulse number increases from top to bottom (#1–#5). Right panel: RGC response curves to single-pulse and burst stimulation in RD RGCs located 200 μm away from the stimulation electrode. Error bars represent the standard error of the mean (SEM). Statistical differences in response curves are indicated by asterisks (*p < 0.05, **p < 0.01). (B) Left and Middle panels: same representative raster plots of RD RGCs located 600 μm away from the stimulation electrode. Right panel: RGC response curves to single-pulse and burst stimulation in RD RGCs located 600 μm away from the stimulation electrode. Statistical differences in the graphs are indicated by asterisks (*p < 0.05, **p < 0.01). (C) Changes in normalized responses with the distance between stimulation and recording electrodes. Left panel: single-pulse stimulation. The inset (spatial MEA color map) shows the normalized RGC responses in one representative retinal patch upon electrical stimulation with a pulse amplitude of 50 μA. The red dot indicates the location of the stimulation electrode. Right panel: burst stimulation. The inset (spatial MEA color map) shows the normalized RGC responses in one representative retinal patch upon electrical stimulation with five pulses per burst. RGC, retinal ganglion cell; RD, retinal degenerate; MEA, multi-electrode array.

Fig. 4 Increasing the number of pulses per burst in the WT retina. (A) Typical responses of the WT RGC to burst stimulation are shown as raster plots. Electrically-evoked RGC spikes are highlighted. The time window of the raster plot is set to ± 0.1 sec, with 0 sec representing the stimulus onset (red dashed line). In each raster plot (10 trials), the pulse number increases from top to bottom (#1–#5, #9–#13, #16–#20). The pulse amplitude and pulse duration are fixed with 30 μA and 100 μs/phase. Only RGCs closest 200 μm to the stimulation electrode were analyzed. (B) RGC response curves as a function of pulse number. Error bars represent the standard error of the mean (SEM). Statistical differences in the graphs are indicated by asterisks (*p < 0.05). RGC, retinal ganglion cell; WT, wild-type.
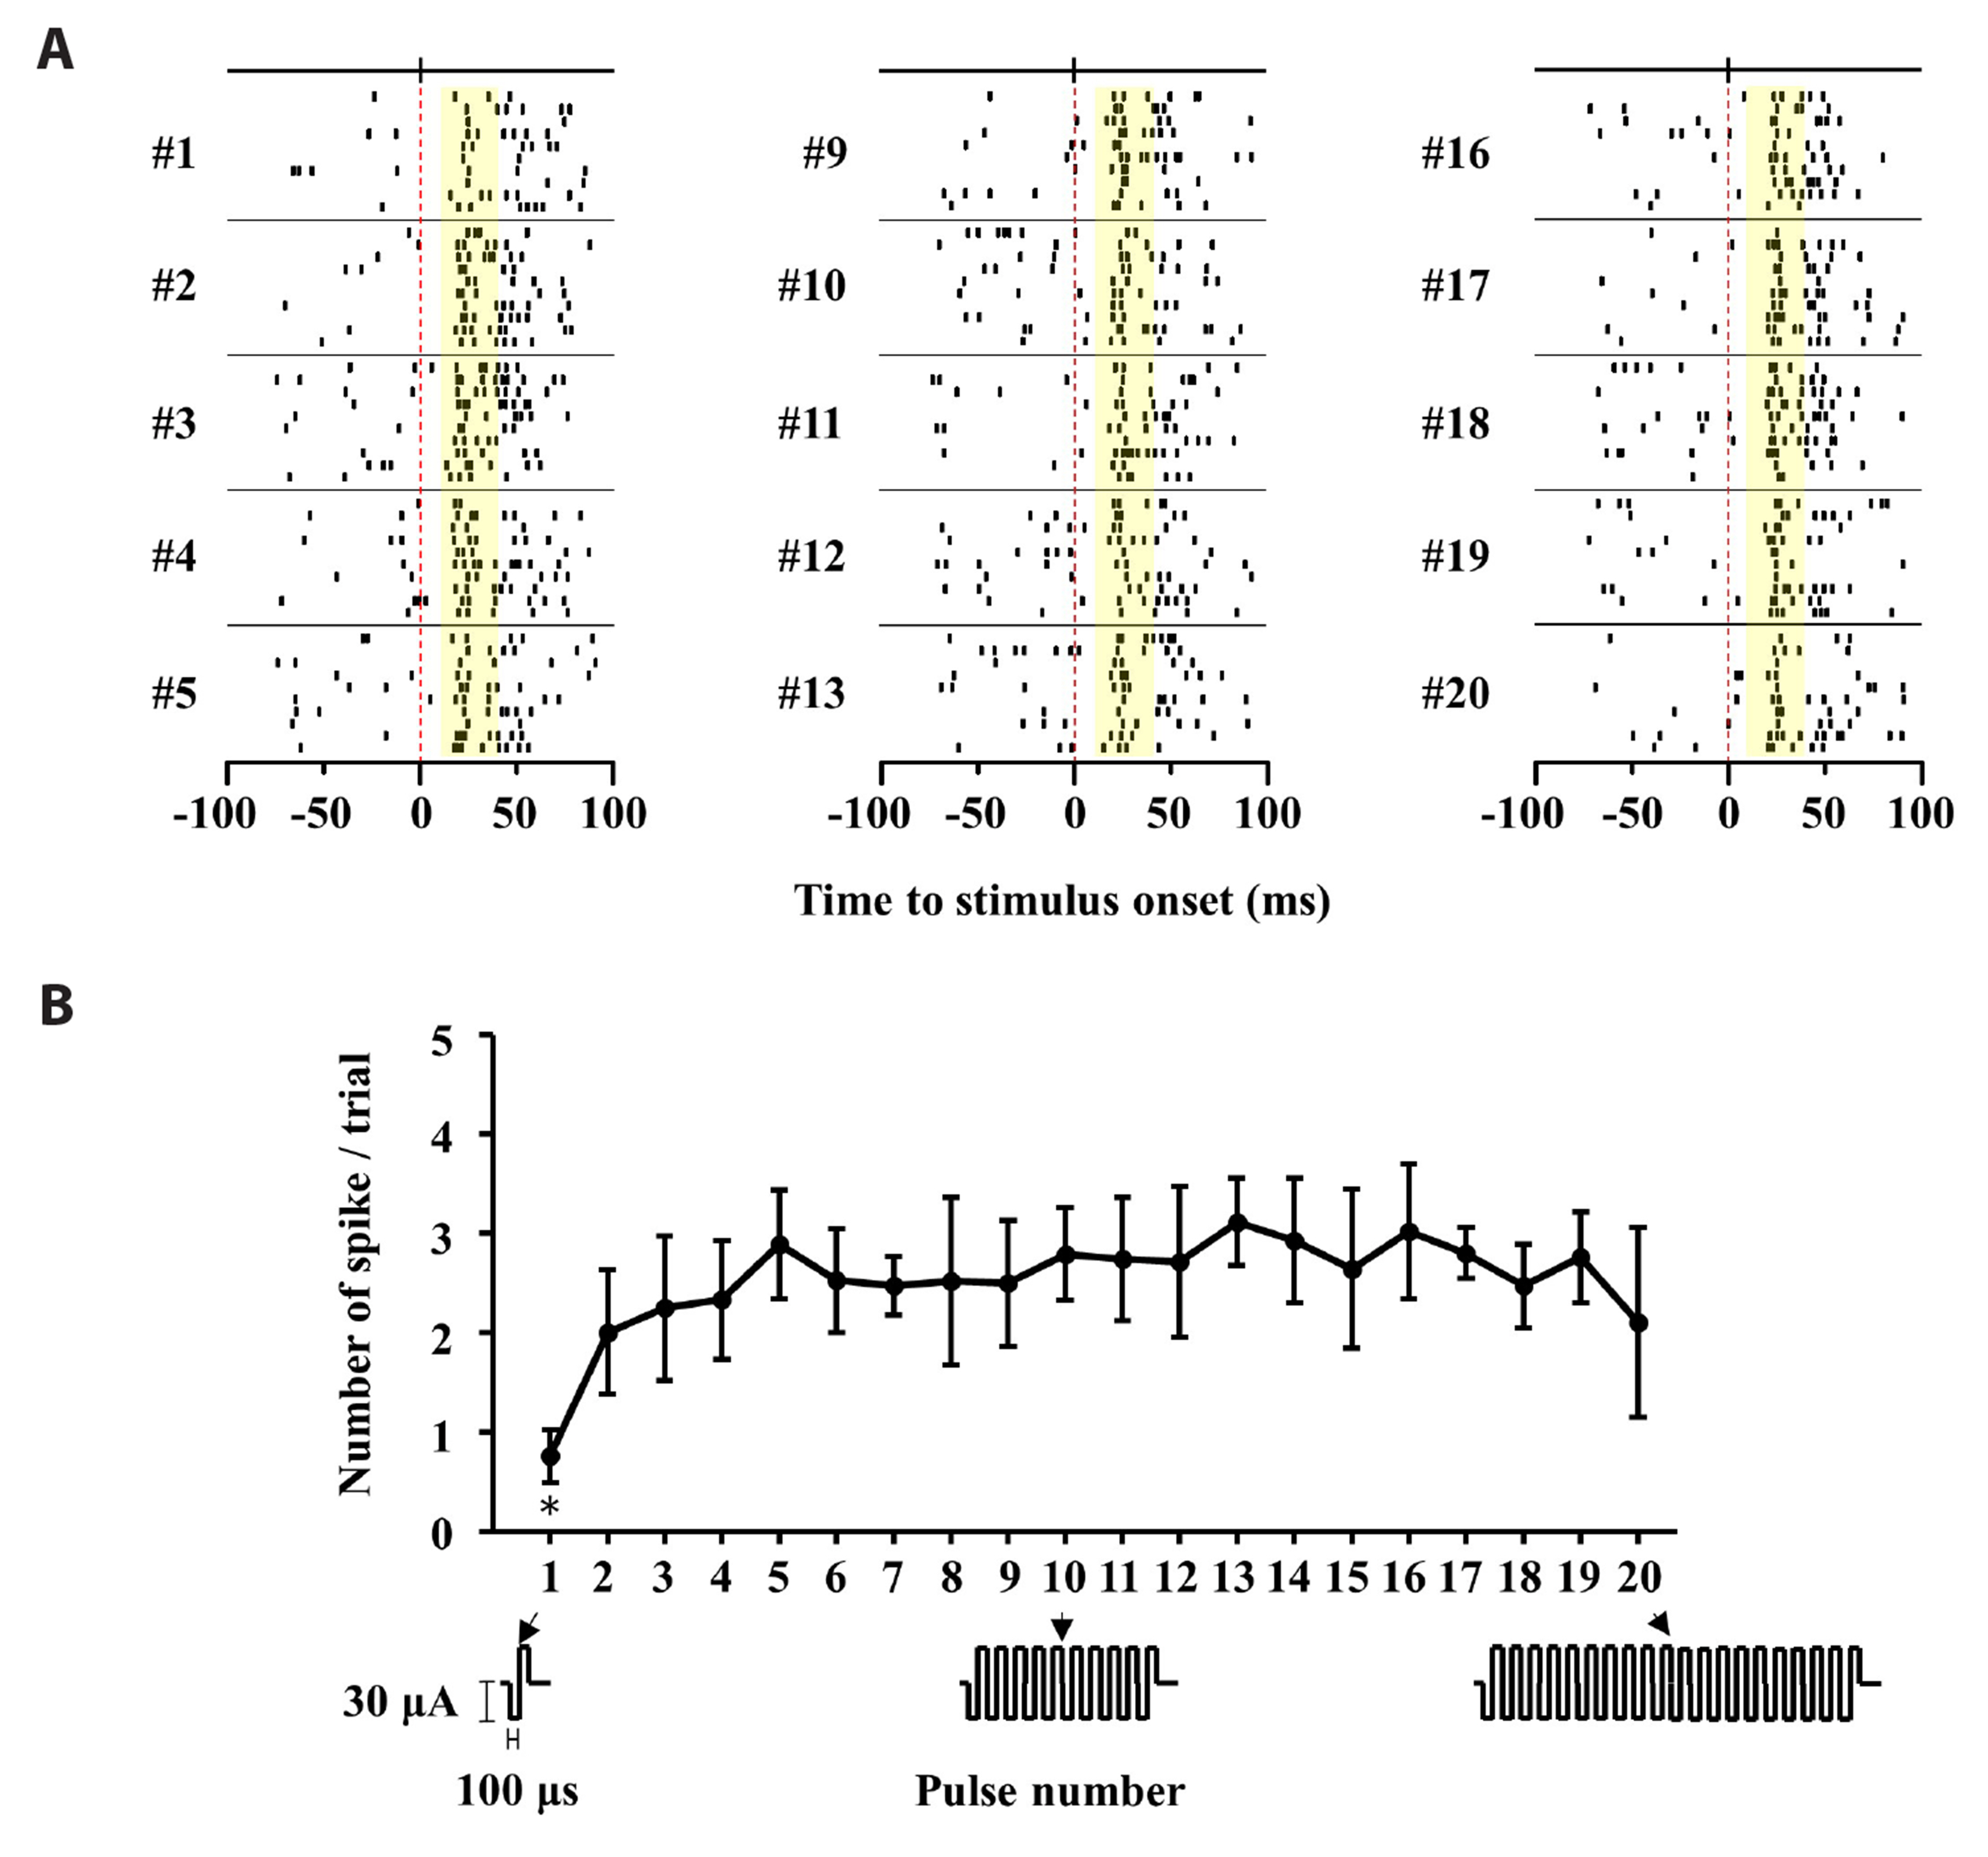
Fig. 5 Increasing the number of pulses per burst in the RD retina. (A) Typical responses of the RD RGC to burst stimulation are shown as raster plots. Electrically-evoked RGC spikes are highlighted. The time window of the raster plot is set to ± 0.1 sec, with 0 sec representing the stimulus onset (red dashed line). In each raster plot (10 trials), the pulse number increases from top to bottom (#1–#5, #9–#13, #16–#20). The pulse amplitude and pulse duration are fixed with 30 μA and 100 μs/phase. Only RGCs closest 200 μm to the stimulation electrode were analyzed. (B) RGC response curves as a function of pulse number. Error bars represent the standard error of the mean (SEM). Statistical differences in the graphs are indicated by asterisks (*p < 0.05). RGC, retinal ganglion cell; RD, retinal degenerate.

Fig. 6 Comparison of the number of electrically-evoked spikes between WT and RD RGCs for single-pulse and doublet or triplet pulse stimulation. Statistical differences in the graphs are indicated by asterisks (*p < 0.05). RGC, retinal ganglion cell; WT, wild-type; RD, retinal degenerate.
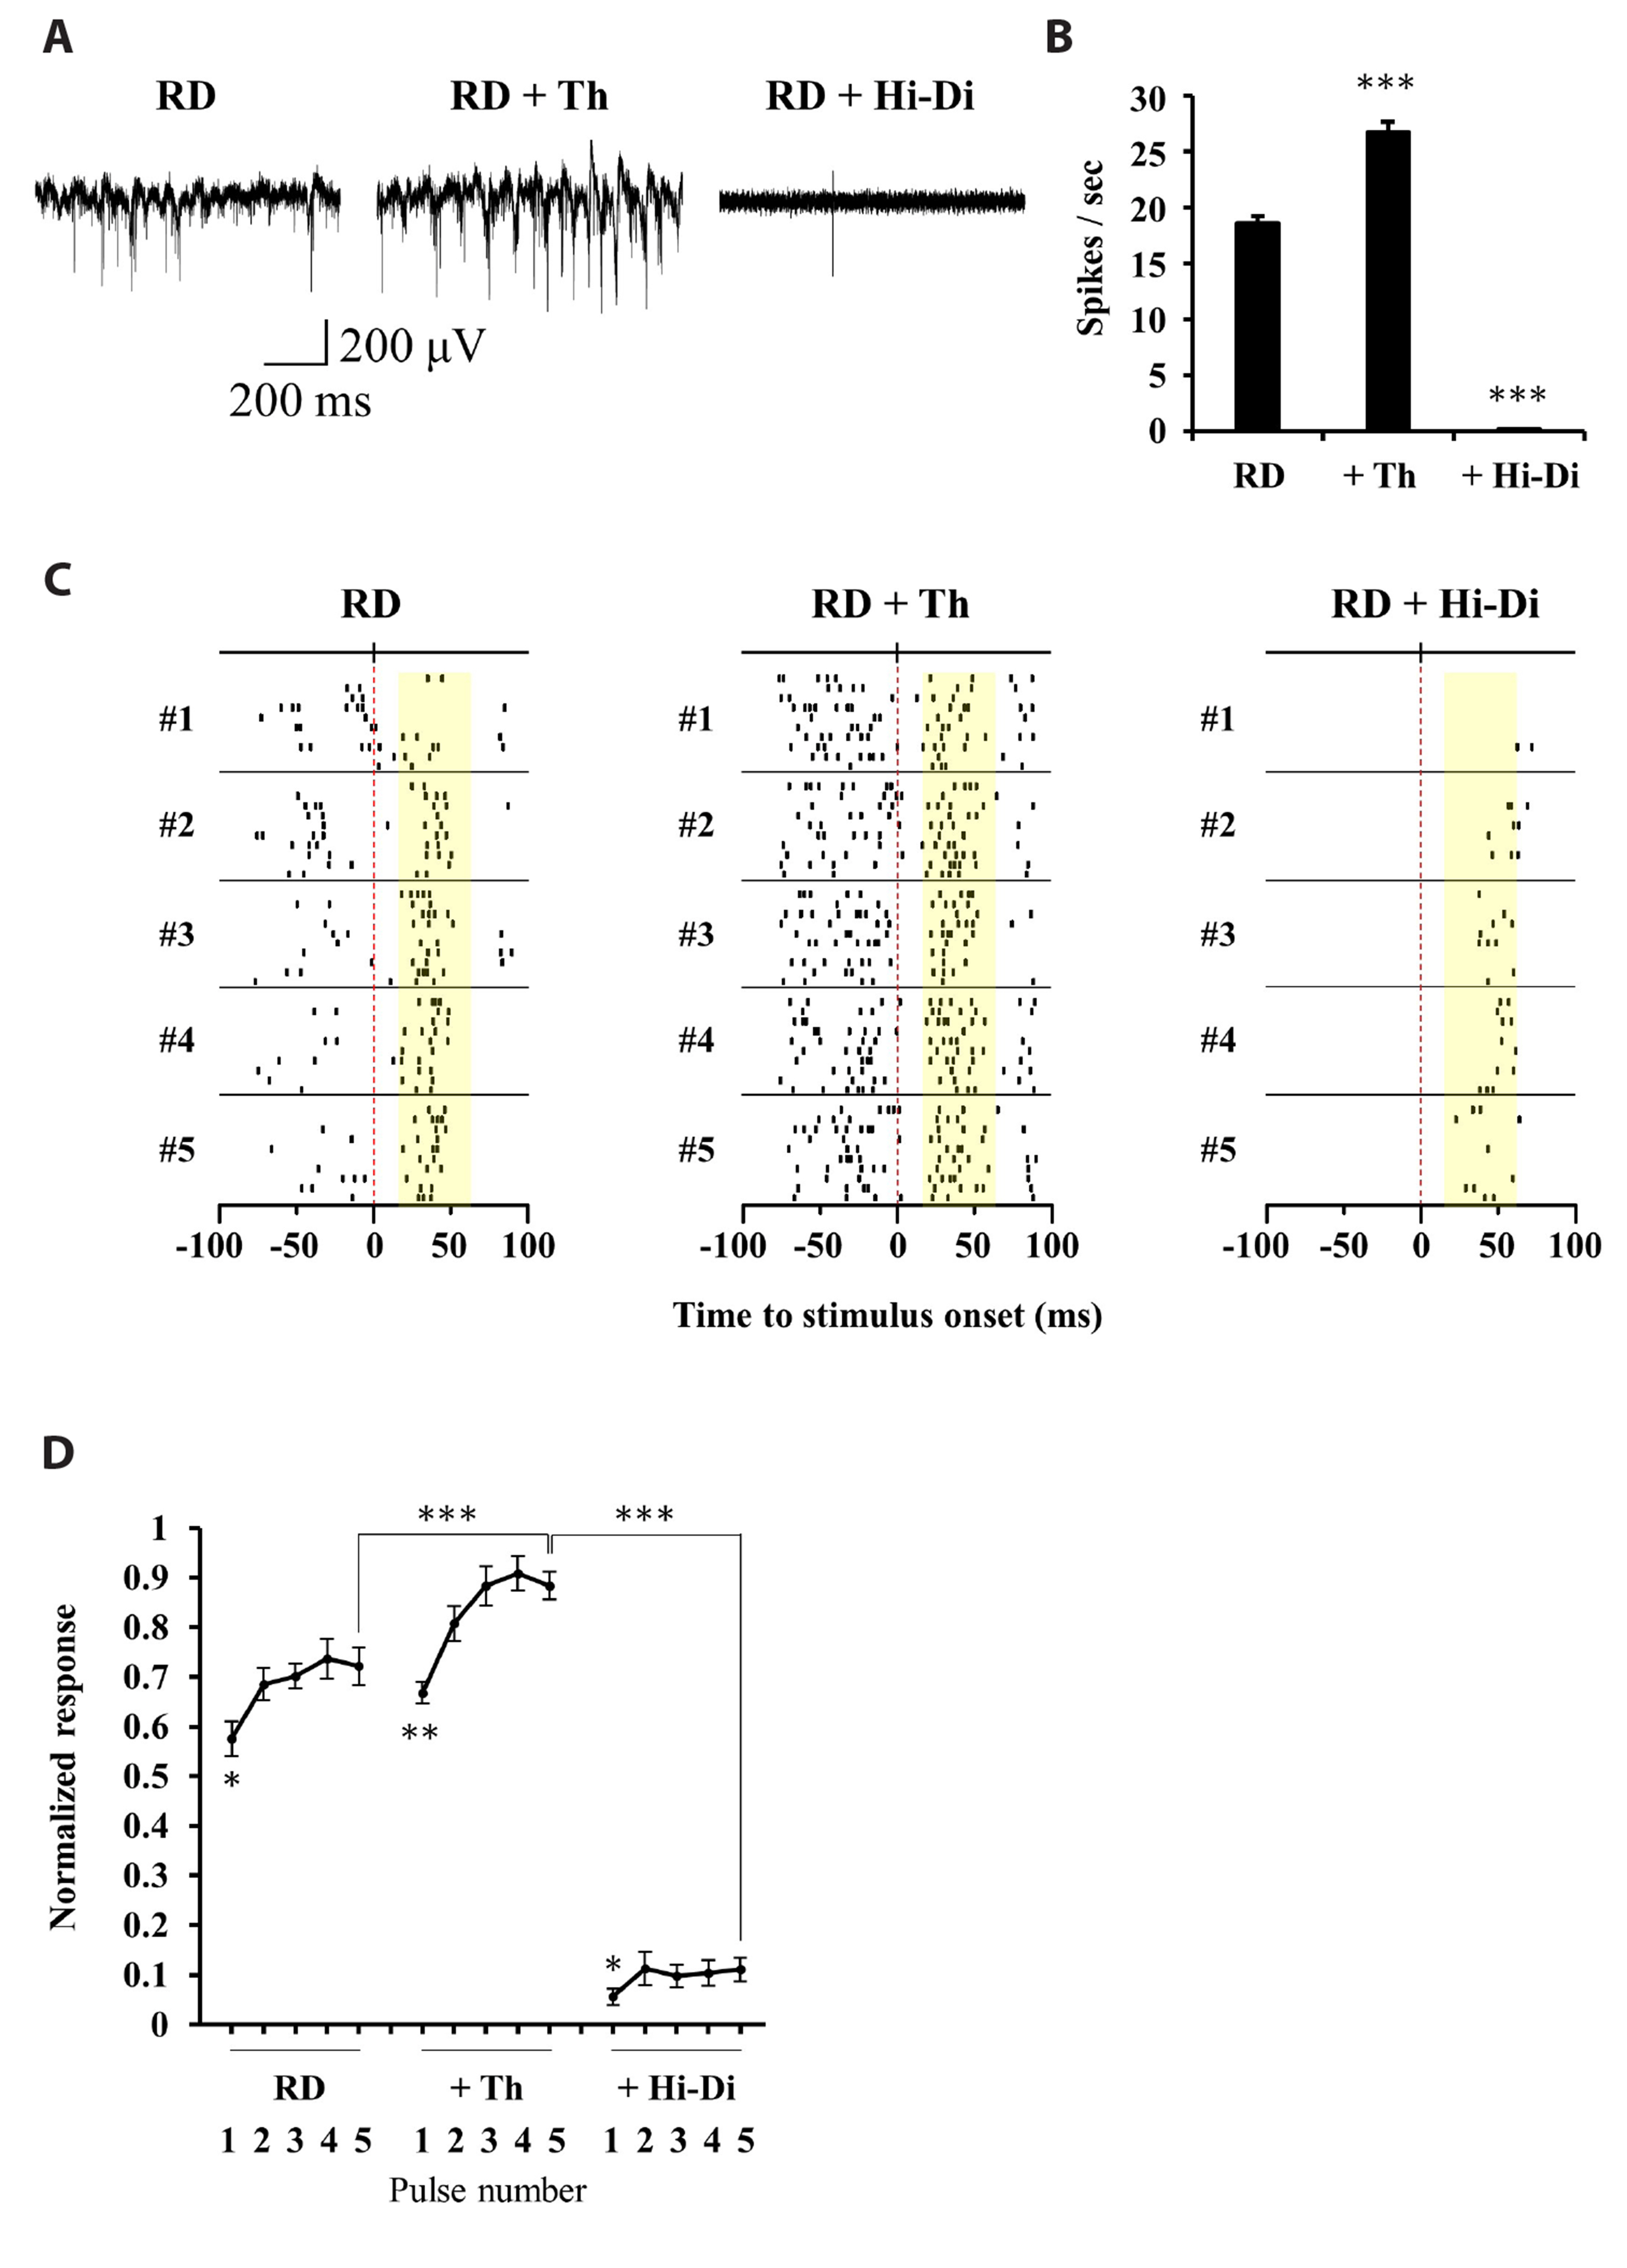
Fig. 7 Calcium-mediated RGC responses to burst stimulation in the RD retina. (A) Representative 1-second raw traces of RGCs in the RD retina without and with thapsigargin (Th) or Hi-Di solution. (B) Spontaneous firing rates of RGCs for RD, RD + Th, and RD + Hi-Di. Statistical differences in the graphs are indicated by asterisks (***p < 0.001). (C) Typical responses of RD RGCs to burst stimulation are shown as raster plots. Electrically-evoked RGC spikes are highlighted. The time window of the raster plot is set to ± 0.1 sec, with 0 sec representing the stimulus onset (red dashed line). In each raster plot (10 trials), the pulse number increases from top to bottom (#1–#5). The pulse amplitude and pulse duration are fixed with 30 μA and 100 μs/phase. Only RGCs 200 μm closest to the stimulation electrode are analyzed. (D) Normalized RGC response curves to burst stimulation. Error bars represent the standard error of the mean (SEM). Statistical differences in the response curves are indicated by asterisks (*p < 0.05, **p < 0.01, ***p < 0.001). RGC, retinal ganglion cell; RD, retinal degenerate; Hi-Di, high-divalent.
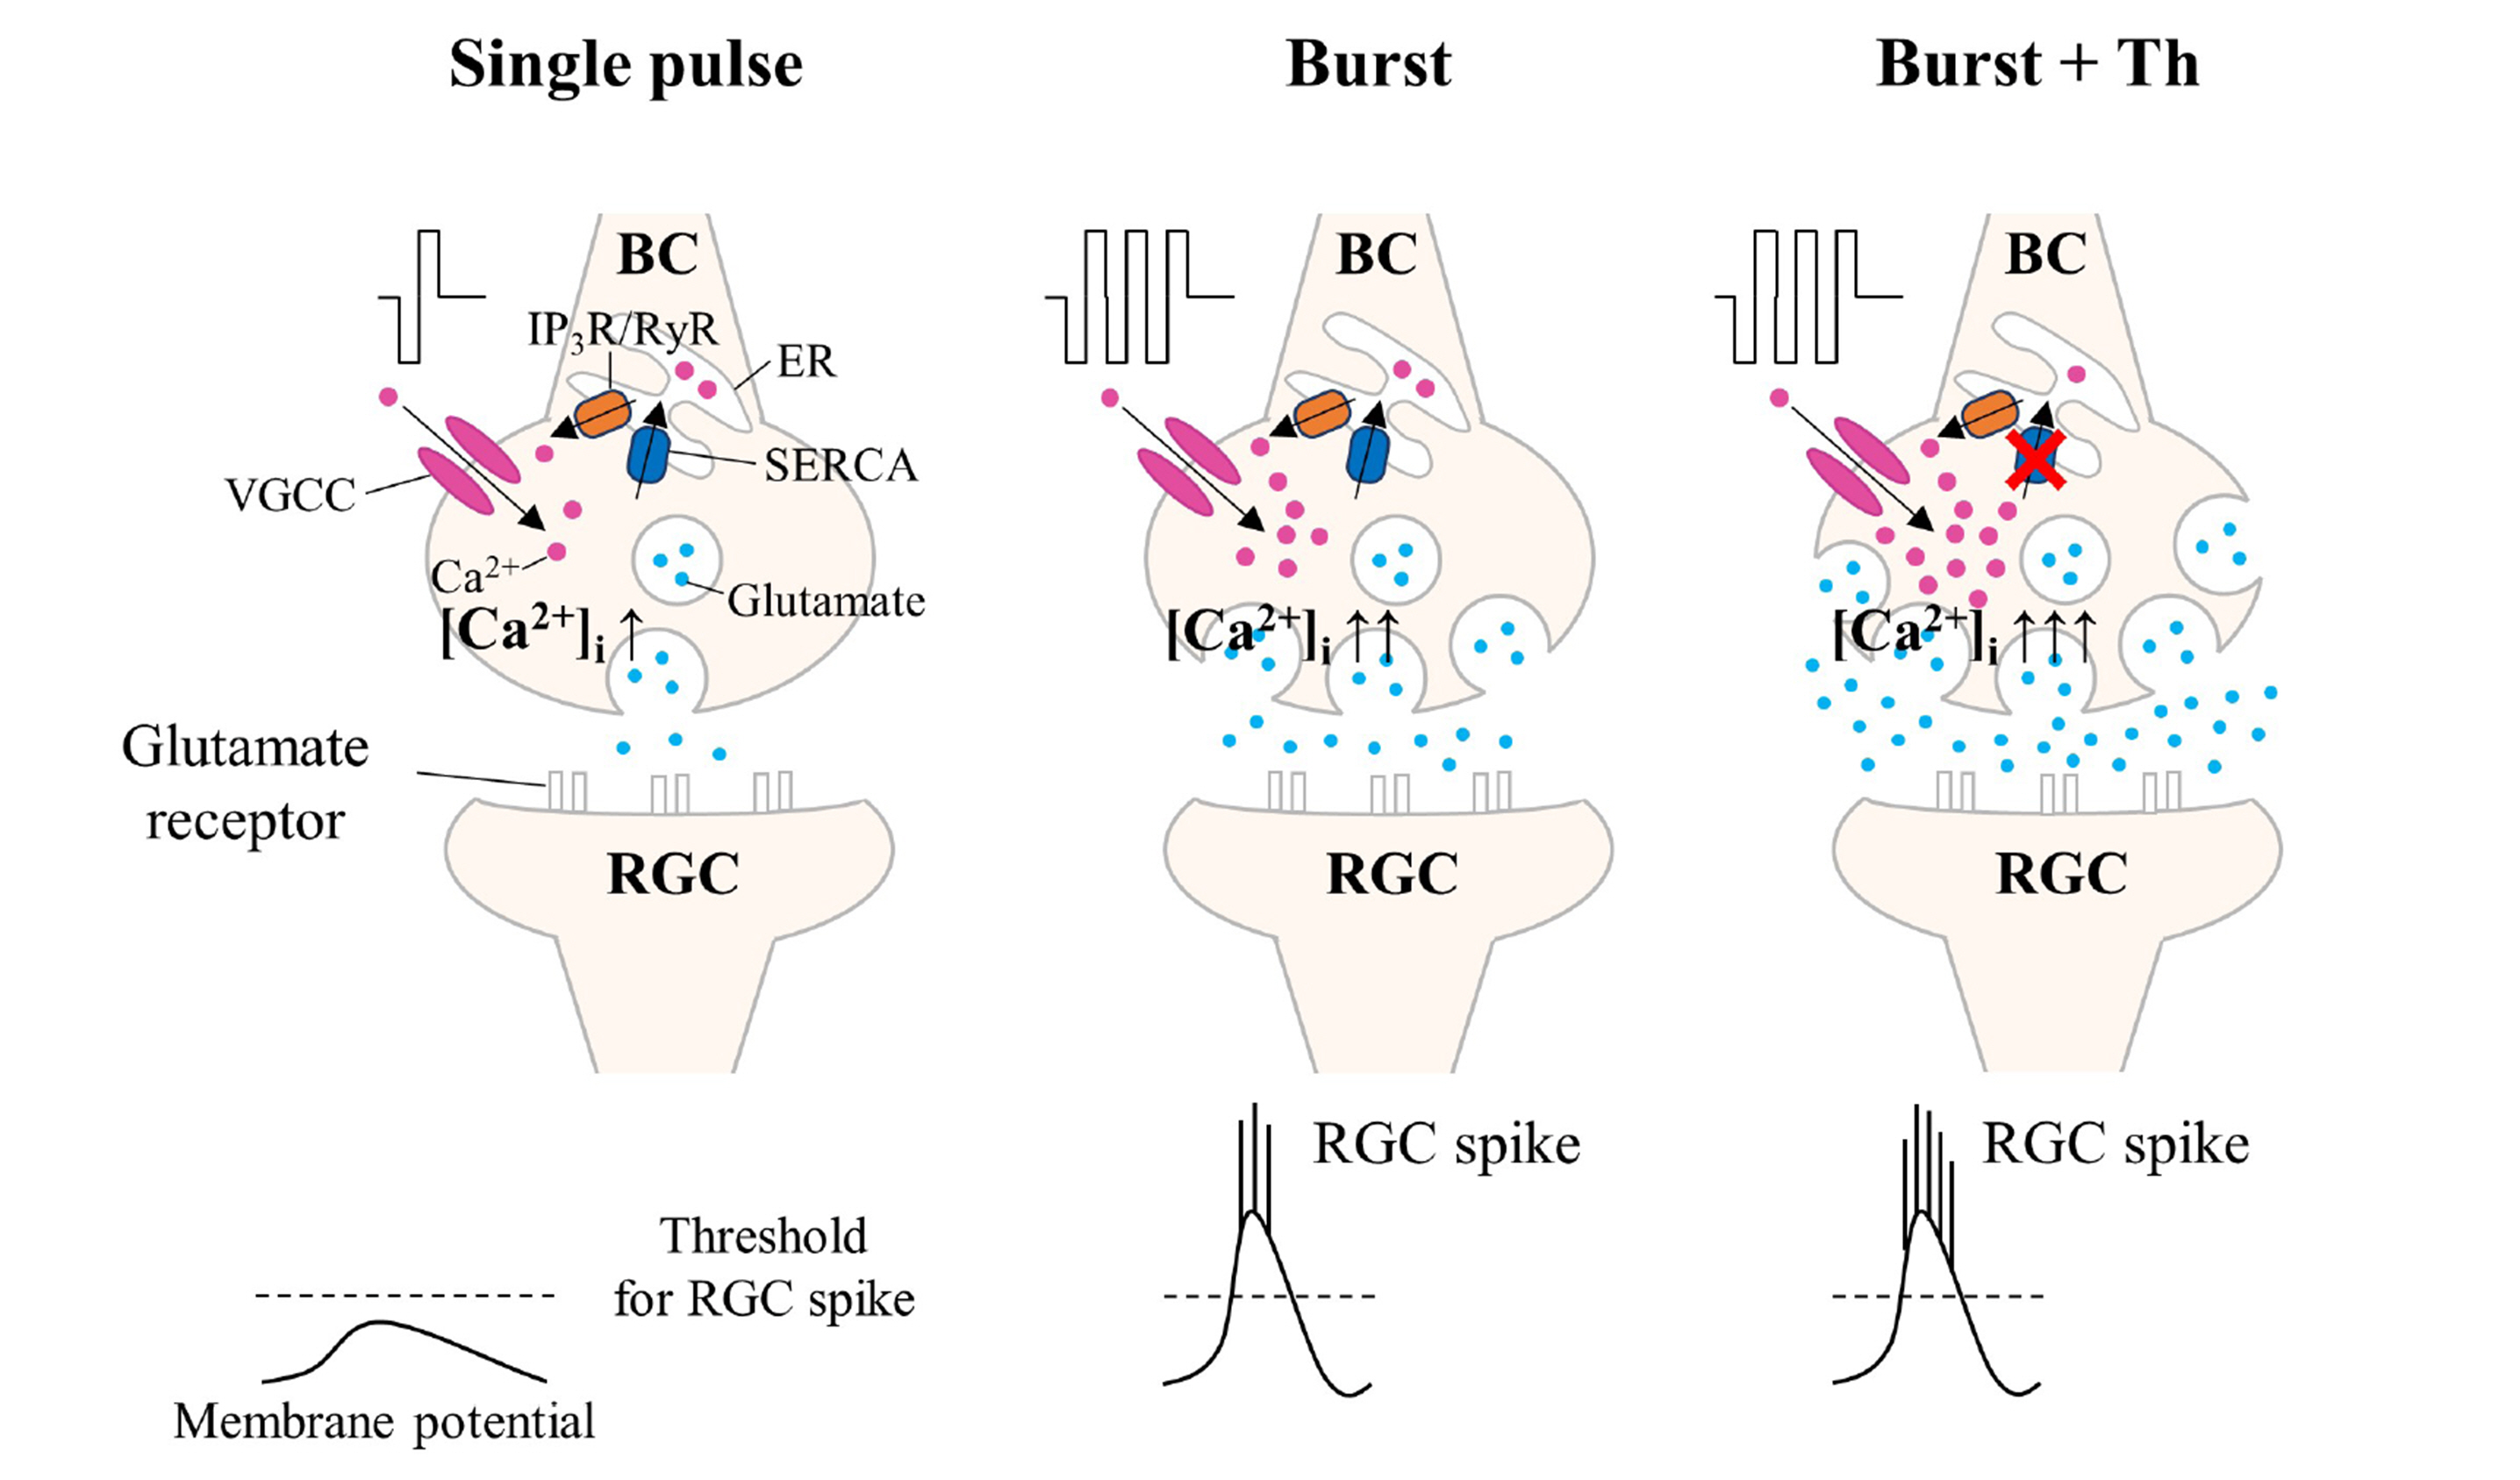
Fig. 8 Schematic diagram of calcium-mediated RGC firing to the burst stimulation. The burst stimulation strategy depends on an increase of intracellular calcium concentration, regulated by voltage-gated calcium channels (VGCCs) for calcium influx and sarco/endoplasmic reticulum Ca2+–ATPase (SERCA) for calcium reuptake. Burst stimulation activates VGCCs at bipolar cell (BC) synapses, boosting calcium influx and then glutamate release from the BC, therefore increasing RGC firing. Thapsigargin (Th) inhibits SERCA, preventing calcium reuptake, raising intracellular calcium concentration ([Ca2+]i), and then releasing glutamate from the bipolar cell, thus enhancing RGC firing. RGC, retinal ganglion cell; IP3R/RyR, inositol–1,4,5–triphosphate receptors/ryanodine receptors; ER, endoplasmic reticulum.
Reference
-
1. Bloch E, Luo Y, da Cruz L. 2019; Advances in retinal prosthesis systems. Ther Adv Ophthalmol. 11:2515841418817501. DOI: 10.1177/2515841418817501. PMID: 30729233. PMCID: PMC6350159. PMID: 0bb0901bb6764d15ab67ace5fd9d73fc.
Article2. Caras IW, Littman N, Abo A. 2014; Proceedings: debilitating eye diseases. Stem Cells Transl Med. 3:1393–1397. DOI: 10.5966/sctm.2014-0221. PMID: 25378652. PMCID: PMC4250220.
Article3. Santos A, Humayun MS, de Juan E Jr, Greenburg RJ, Marsh MJ, Klock IB, Milam AH. 1997; Preservation of the inner retina in retinitis pigmentosa. A morphometric analysis. Arch Ophthalmol. 115:511–515. DOI: 10.1001/archopht.1997.01100150513011. PMID: 9109761.
Article4. Ayton LN, Barnes N, Dagnelie G, Fujikado T, Goetz G, Hornig R, Jones BW, Muqit MMK, Rathbun DL, Stingl K, Weiland JD, Petoe MA. 2020; An update on retinal prostheses. Clin Neurophysiol. 131:1383–1398. DOI: 10.1016/j.clinph.2019.11.029. PMID: 31866339. PMCID: PMC7198351.
Article5. Grosberg LE, Ganesan K, Goetz GA, Madugula SS, Bhaskhar N, Fan V, Li P, Hottowy P, Dabrowski W, Sher A, Litke AM, Mitra S, Chichilnisky EJ. 2017; Activation of ganglion cells and axon bundles using epiretinal electrical stimulation. J Neurophysiol. 118:1457–1471. DOI: 10.1152/jn.00750.2016. PMID: 28566464. PMCID: PMC5596129.
Article6. Ahn J, Cha S, Choi KE, Kim SW, Yoo Y, Goo YS. 2022; Correlated activity in the degenerate retina inhibits focal response to electrical stimulation. Front Cell Neurosci. 16:889663. DOI: 10.3389/fncel.2022.889663. PMID: 35602554. PMCID: PMC9114441. PMID: 2a8730d0fd684c1d89dde7ade94055b0.
Article7. Ahn J, Jeong Y, Cha S, Lee JY, Yoo Y, Goo YS. 2023; High amplitude pulses on the same charge condition efficiently elicit bipolar cell-mediated retinal ganglion cell responses in the degenerate retina. Biomed Eng Lett. 13:129–140. DOI: 10.1007/s13534-023-00260-4. PMID: 37124107.
Article8. Haselier C, Biswas S, Rösch S, Thumann G, Müller F, Walter P. 2017; Correlations between specific patterns of spontaneous activity and stimulation efficiency in degenerated retina. PLoS One. 12:e0190048. DOI: 10.1371/journal.pone.0190048. PMID: 29281713. PMCID: PMC5744965. PMID: 36800c7058134573a3c140ea46488015.
Article9. Stutzki H, Helmhold F, Eickenscheidt M, Zeck G. 2016; Subretinal electrical stimulation reveals intact network activity in the blind mouse retina. J Neurophysiol. 116:1684–1693. DOI: 10.1152/jn.01095.2015. PMID: 27486110. PMCID: PMC5144714.
Article10. Margolis DJ, Newkirk G, Euler T, Detwiler PB. 2008; Functional stability of retinal ganglion cells after degeneration-induced changes in synaptic input. J Neurosci. 28:6526–6536. DOI: 10.1523/JNEUROSCI.1533-08.2008. PMID: 18562624. PMCID: PMC3050548.
Article11. Baden T, Berens P, Franke K, Román Rosón M, Bethge M, Euler T. 2016; The functional diversity of retinal ganglion cells in the mouse. Nature. 529:345–350. DOI: 10.1038/nature16468. PMID: 26735013. PMCID: PMC4724341.
Article12. Elstrott J, Feller MB. 2010; Direction-selective ganglion cells show symmetric participation in retinal waves during development. J Neurosci. 30:11197–11201. DOI: 10.1523/JNEUROSCI.2302-10.2010. PMID: 20720127. PMCID: PMC2928560.
Article13. Krieger B, Qiao M, Rousso DL, Sanes JR, Meister M. 2017; Four alpha ganglion cell types in mouse retina: Function, structure, and molecular signatures. PLoS One. 12:e0180091. DOI: 10.1371/journal.pone.0180091. PMID: 28753612. PMCID: PMC5533432. PMID: 9e2a43d6665444e3a77aac6e313e089b.
Article14. Goo YS, Ye JH, Lee S, Nam Y, Ryu SB, Kim KH. 2011; Retinal ganglion cell responses to voltage and current stimulation in wild-type and rd1 mouse retinas. J Neural Eng. 8:035003. DOI: 10.1088/1741-2560/8/3/035003. PMID: 21593549.15. Jensen RJ, Rizzo JF 3rd. 2008; Activation of retinal ganglion cells in wild-type and rd1 mice through electrical stimulation of the retinal neural network. Vision Res. 48:1562–1568. DOI: 10.1016/j.visres.2008.04.016. PMID: 18555890.
Article16. Kalloniatis M, Nivison-Smith L, Chua J, Acosta ML, Fletcher EL. 2016; Using the rd1 mouse to understand functional and anatomical retinal remodelling and treatment implications in retinitis pigmentosa: a review. Exp Eye Res. 150:106–121. DOI: 10.1016/j.exer.2015.10.019. PMID: 26521764.
Article17. Haq W, Dietter J, Zrenner E. 2018; Electrical activation of degenerated photoreceptors in blind mouse retina elicited network-mediated responses in different types of ganglion cells. Sci Rep. 8:16998. DOI: 10.1038/s41598-018-35296-5. PMID: 30451928. PMCID: PMC6243018.
Article18. Stett A, Barth W, Weiss S, Haemmerle H, Zrenner E. 2000; Electrical multisite stimulation of the isolated chicken retina. Vision Res. 40:1785–1795. DOI: 10.1016/S0042-6989(00)00005-5. PMID: 10814763.
Article19. Lewicki MS. 1998; A review of methods for spike sorting: the detection and classification of neural action potentials. Network. 9:R53–78. DOI: 10.1088/0954-898X_9_4_001. PMID: 10221571.
Article20. Butterwick A, Vankov A, Huie P, Freyvert Y, Palanker D. 2007; Tissue damage by pulsed electrical stimulation. IEEE Trans Biomed Eng. 54:2261–2267. DOI: 10.1109/TBME.2007.908310. PMID: 18075042.
Article21. Ahn KN, Ahn JY, Kim JH, Cho K, Koo KI, Senok SS, Goo YS. 2015; Effect of stimulus waveform of biphasic current pulse on retinal ganglion cell responses in retinal degeneration (rd1) mice. Korean J Physiol Pharmacol. 19:167–175. DOI: 10.4196/kjpp.2015.19.2.167. PMID: 25729279. PMCID: PMC4342737.
Article22. Nakamura S, Takizawa H, Shimazawa M, Hashimoto Y, Sugitani S, Tsuruma K, Hara H. 2013; Mild endoplasmic reticulum stress promotes retinal neovascularization via induction of BiP/GRP78. PLoS One. 8:e60517. DOI: 10.1371/journal.pone.0060517. PMID: 23544152. PMCID: PMC3609792. PMID: 95da29ccf30a4c5689576e84b64e2bf8.
Article23. Liao X, Walters ET. 2002; The use of elevated divalent cation solutions to isolate monosynaptic components of sensorimotor connections in Aplysia. J Neurosci Methods. 120:45–54. DOI: 10.1016/S0165-0270(02)00189-9. PMID: 12351206.
Article24. Boinagrov D, Pangratz-Fuehrer S, Goetz G, Palanker D. 2014; Selectivity of direct and network-mediated stimulation of the retinal ganglion cells with epi-, sub- and intraretinal electrodes. J Neural Eng. 11:026008. DOI: 10.1088/1741-2560/11/2/026008. PMID: 24608166. PMCID: PMC4082997.
Article25. Ahn J, Choi MH, Kim K, Senok SS, Cho DD, Koo KI, Goo Y. 2017; The advantage of topographic prominence-adopted filter for the detection of short-latency spikes of retinal ganglion cells. Korean J Physiol Pharmacol. 21:555–563. DOI: 10.4196/kjpp.2017.21.5.555. PMID: 28883759. PMCID: PMC5587605.
Article26. Chakravarthy K, Fishman MA, Zuidema X, Hunter CW, Levy R. 2019; Mechanism of action in burst spinal cord stimulation: review and recent advances. Pain Med. 20(Suppl 1):S13–S22. DOI: 10.1093/pm/pnz073. PMID: 31152180. PMCID: PMC6544550.
Article27. Weitz AC, Nanduri D, Behrend MR, Gonzalez-Calle A, Greenberg RJ, Humayun MS, Chow RH, Weiland JD. 2015; Improving the spatial resolution of epiretinal implants by increasing stimulus pulse duration. Sci Transl Med. 7:318ra203. DOI: 10.1126/scitranslmed.aac4877. PMID: 26676610. PMCID: PMC4698804.
Article28. Cogan SF, Ludwig KA, Welle CG, Takmakov P. 2016; Tissue damage thresholds during therapeutic electrical stimulation. J Neural Eng. 13:021001. DOI: 10.1088/1741-2560/13/2/021001. PMID: 26792176. PMCID: PMC5386002.
Article29. Merrill DR, Bikson M, Jefferys JG. 2005; Electrical stimulation of excitable tissue: design of efficacious and safe protocols. J Neurosci Methods. 141:171–198. DOI: 10.1016/j.jneumeth.2004.10.020. PMID: 15661300.
Article30. Sekirnjak C, Hottowy P, Sher A, Dabrowski W, Litke AM, Chichilnisky EJ. 2006; Electrical stimulation of mammalian retinal ganglion cells with multielectrode arrays. J Neurophysiol. 95:3311–3327. DOI: 10.1152/jn.01168.2005. PMID: 16436479.
Article31. Im M, Werginz P, Fried SI. 2018; Electric stimulus duration alters network-mediated responses depending on retinal ganglion cell type. J Neural Eng. 15:036010. DOI: 10.1088/1741-2552/aaadc1. PMID: 29415876. PMCID: PMC5927815.
Article32. Lee SW, Eddington DK, Fried SI. 2013; Responses to pulsatile subretinal electric stimulation: effects of amplitude and duration. J Neurophysiol. 109:1954–1968. DOI: 10.1152/jn.00293.2012. PMID: 23343891. PMCID: PMC3628003.
Article33. Chenais NAL, Airaghi Leccardi MJI, Ghezzi D. 2021; Naturalistic spatiotemporal modulation of epiretinal stimulation increases the response persistence of retinal ganglion cell. J Neural Eng. 18:016016. DOI: 10.1088/1741-2552/abcd6f. PMID: 33232947.
Article34. Freeman DK, Fried SI. 2011; Multiple components of ganglion cell desensitization in response to prosthetic stimulation. J Neural Eng. 8:016008. DOI: 10.1088/1741-2560/8/1/016008. PMID: 21248379. PMCID: PMC3048167.
Article35. Jensen RJ, Rizzo JF 3rd. 2007; Responses of ganglion cells to repetitive electrical stimulation of the retina. J Neural Eng. 4:S1–6. DOI: 10.1088/1741-2560/4/1/S01. PMID: 17325407.
Article36. Habib AG, Cameron MA, Suaning GJ, Lovell NH, Morley JW. 2013; Spatially restricted electrical activation of retinal ganglion cells in the rabbit retina by hexapolar electrode return configuration. J Neural Eng. 10:036013. DOI: 10.1088/1741-2560/10/3/036013. PMID: 23612906.
Article37. Tong W, Stamp M, Apollo NV, Ganesan K, Meffin H, Prawer S, Garrett DJ, Ibbotson MR. 2019; Improved visual acuity using a retinal implant and an optimized stimulation strategy. J Neural Eng. 17:016018. DOI: 10.1088/1741-2552/ab5299. PMID: 31665704.
Article38. Abramian M, Lovell NH, Habib A, Morley JW, Suaning GJ, Dokos S. 2014; Quasi-monopolar electrical stimulation of the retina: a computational modelling study. J Neural Eng. 11:025002. DOI: 10.1088/1741-2560/11/2/025002. PMID: 24556561.
Article39. Choi KE, Cha S, Yun C, Ahn J, Hwang S, Kim YJ, Jung H, Eom H, Shin D, Oh J, Goo YS, Kim SW. 2023; Outer retinal degeneration in a non-human primate model using temporary intravitreal tamponade with N-methyl-N-nitrosourea in cynomolgus monkeys. J Neural Eng. 20:015001. DOI: 10.1088/1741-2552/acb085. PMID: 36603218.
Article
- Full Text Links
-
- Actions
-
Cited
- CITED
-
- Close
- Share
-
- Similar articles
-
- Electrical Stimulation Parameters in Normal andDegenerate Rabbit Retina
- Comparison of Retinal Waveform between Normal and rd/rd Mouse
- Electrically-evoked Neural Activities of rd1 Mice Retinal Ganglion Cells by Repetitive Pulse Stimulation
- Spatiotemporal Analysis of Retinal Waveform using Independent Component Analysis in Normal and rd/rd Mouse
- Amplitude Modulation-based Electrical Stimulation for Encoding Multipixel Spatiotemporal Visual Information in Retinal Neural Activities
