Evaluation of Semi-automatic Segmentation Methods for Persistent Ground Glass Nodules on Thin-Section CT Scans
- Affiliations
-
- 1Biomedical Engineering Branch, Division of Precision Medicine and Cancer Informatics, Research Institute, National Cancer Center, Goyang, Korea. kimkg@ncc.re.kr
- 2Department of Plasma Bio Display, Kwangwoon University, Seoul, Korea.
- 3Department of Radiology, Seoul National University Hospital, Seoul, Korea.
- KMID: 2357385
- DOI: http://doi.org/10.4258/hir.2016.22.4.305
Abstract
OBJECTIVES
This work was a comparative study that aimed to find a proper method for accurately segmenting persistent ground glass nodules (GGN) in thin-section computed tomography (CT) images after detecting them.
METHODS
To do this, we first applied five types of semi-automatic segmentation methods (i.e., level-set-based active contour model, localized region-based active contour model, seeded region growing, K-means clustering, and fuzzy C-means clustering) to preprocessed GGN images, respectively. Then, to measure the similarities, we calculated the Dice coefficient of the segmented area using each semiautomatic method with the result of the manually segmented area by two radiologists.
RESULTS
Comparison experiments were performed using 40 persistent GGNs. In our experiment, the mean Dice coefficient for each semiautomatic segmentation tool with manually segmented area was 0.808 for the level-set-based active contour model, 0.8001 for the localized region-based active contour model, 0.629 for seeded region growing, 0.7953 for K-means clustering, and 0.7999 for fuzzy C-means clustering, respectively.
CONCLUSIONS
The level-set-based active contour model algorithm showed the best performance, which was most similar to the result of manual segmentation by two radiologists. From the differentiation between the normal parenchyma and the nodule, it was also the most efficient. Effective segmentation methods will be essential for the development of computer-aided diagnosis systems for more accurate early diagnosis and prognosis of lung cancer in thin-section CT images.
Keyword
MeSH Terms
Figure
-

Figure 1 Overall procedure of the study.
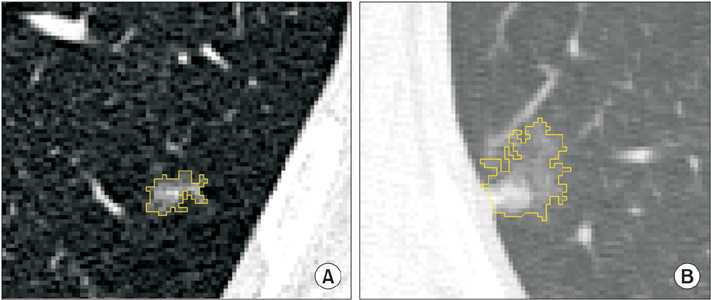
Figure 2 Two examples of manual segmentation in axial 1 mm section CT (computed tomography) images: (A) CT scan of a 64 year-old man and (B) another CT scan of a 70 year-old woman. All scans were magnified for the purpose of visualization.
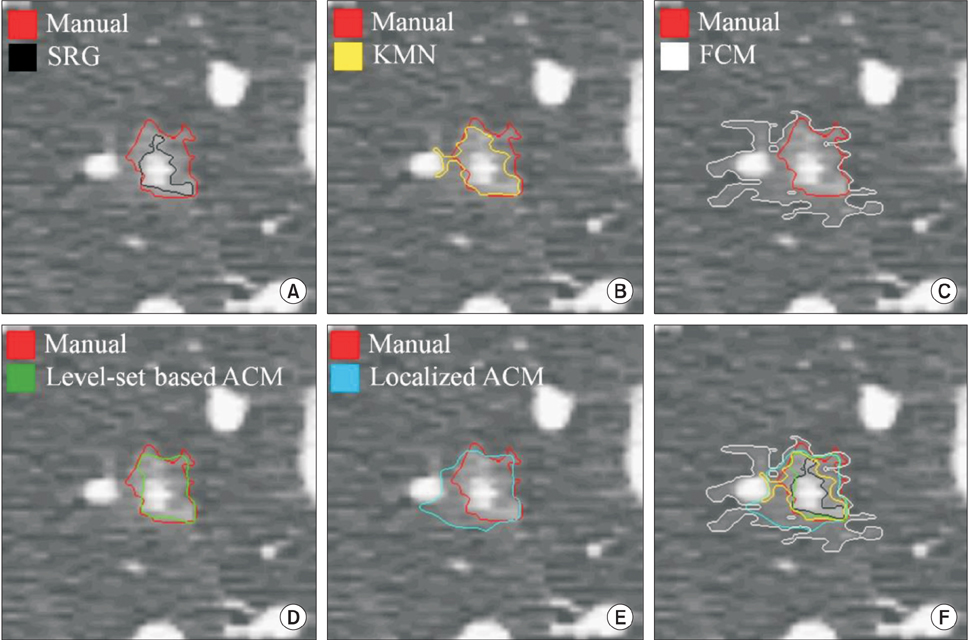
Figure 3 An example of evaluation for segmentation accuracy with the result of manual segmentation (red contour) #1. (A) Seeded region growing (SRG, black), (B) K-means clustering (KMN, yellow), (C) fuzzy C-means clustering (FCM, white), (D) level-set based active contour model (Level-set based ACM, green), (E) localized region-based active contour model (Localized ACM, blue), and (F) overall comparison of accuracy for each method with boundary overlay.
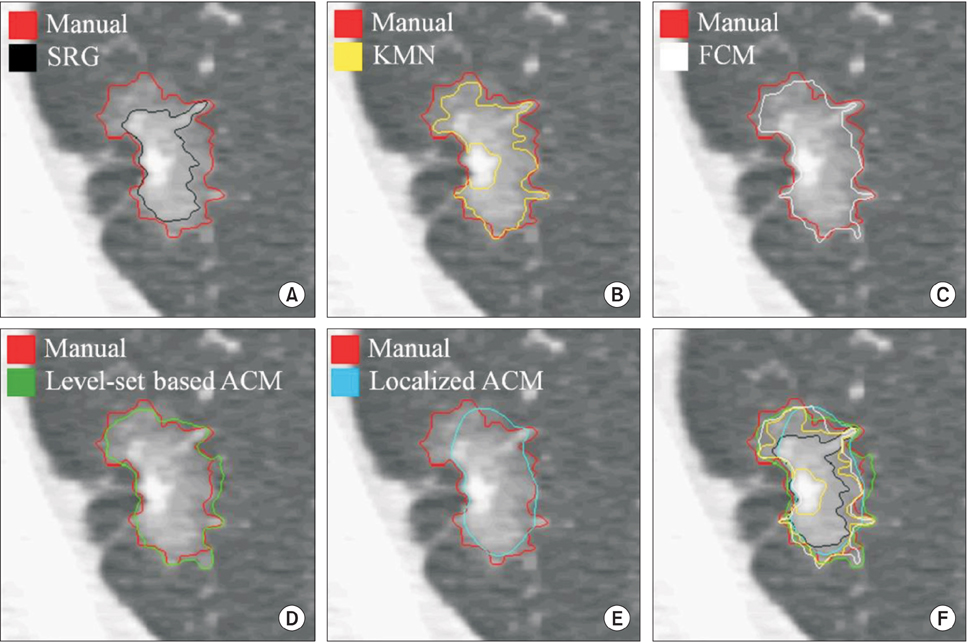
Figure 4 An example of evaluation for segmentation accuracy with the result of manual segmentation (red contour) #2. (A) Seeded region growing (SRG, black), (B) K-means clustering (KMN, yellow), (C) fuzzy C-means clustering (FCM, white), (D) level-set based active contour model (Level-set based ACM, green), (E) localized region-based active contour model (Localized ACM, blue), and (F) overall comparison of accuracy for each method with boundary overlay.
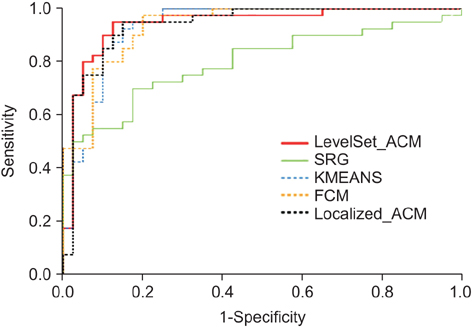
Figure 5 The result of the ROC analysis. Each line is represented in different colors according to the method as follows: the level-set based active contour model (LevelSet_ACM, red), the localized region-based active contour model (Localized_ACM, black dotted), the seeded region growing (SRG, green), the K-means clustering (KMEANS, blue dotted), and the fuzzy C-means clustering (FCM, yellow dotted).
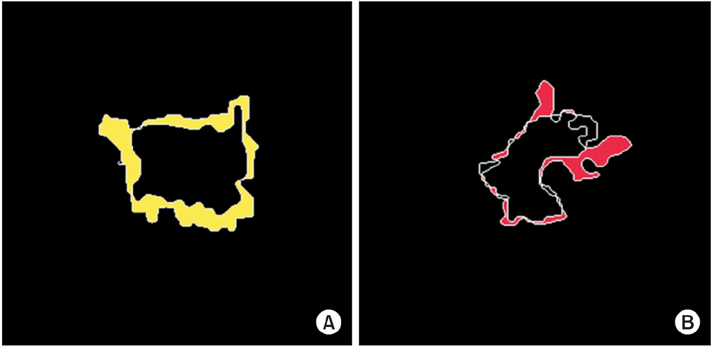
Figure 6 An example of over-segmentation and under-segmentation: (A) under segmented region in the segmentation with the level-set based active contour model (yellow regions); (B) over segmented region in the segmentation with the seeded region growing (red regions).
Reference
-
1. Siegel R, Ward E, Brawley O, Jemal A. Cancer statistics, 2011: the impact of eliminating socioeconomic and racial disparities on premature cancer deaths. CA Cancer J Clin. 2011; 61(4):212–236.2. Song JS, Kim SY, Jo HJ, Lee KK, Shin JH, Shin SN, et al. The role and significance of biomarker for plasma G-CSF in patients with primary lung cancer. Tuberc Respir Dis. 2009; 66(6):444–450.
Article3. Nakata M, Saeki H, Takata I, Segawa Y, Mogami H, Mandai K, et al. Focal ground-glass opacity detected by low-dose helical CT. Chest. 2002; 121(5):1464–1467.
Article4. Beasley MB, Brambilla E, Travis WD. The 2004 World Health Organization classification of lung tumors. Semin Roentgenol. 2005; 40(2):90–97.
Article5. Park CM, Goo JM, Lee HJ, Lee CH, Chun EJ, Im JG. Nodular ground-glass opacity at thin-section CT: histologic correlation and evaluation of change at follow-up. Radiographics. 2007; 27(2):391–408.
Article6. Lee HY, Lee KS. Ground-glass opacity nodules: histopathology, imaging evaluation, and clinical implications. J Thorac Imaging. 2011; 26(2):106–118.7. Godoy MC, Naidich DP. Subsolid pulmonary nodules and the spectrum of peripheral adenocarcinomas of the lung: recommended interim guidelines for assessment and management. Radiology. 2009; 253(3):606–622.
Article8. Bastawrous HA, Nitta N, Tsudagawa M. A new CAD system for detecting localized ground glass opacity nodules in lung CT images using cross and coronary section images. In : Proceedings of IEEE International Workshop on Medical Measurement and Applications; 2006 Apr 20-21; Benevento, Italy. p. 54–57.9. Kim KG, Goo JM, Kim JH, Lee HJ, Min BG, Bae KT, et al. Computer-aided diagnosis of localized ground-glass opacity in the lung at CT: initial experience. Radiology. 2005; 237(2):657–661.
Article10. Li Q, Li F, Doi K. Computerized detection of lung nodules in thin-section CT images by use of selective enhancement filters and an automated rule-based classifier. Acad Radiol. 2008; 15(2):165–175.
Article11. Kanazawa K, Kubo M, Niki N, Satoh H, Ohmatsu H, Eguchi K, et al. Computer assisted lung cancer diagnosis based on helical images. In : Proceedings of 3rd International Computer Science Conference; 1995 Dec 11-13; Hong Kong. p. 323–330.12. Okumura T, Miwa T, Kako JI, Yamamoto S, Matsumoto M, Tateno Y, et al. Image processing for computer-aided diagnosis of lung cancer screening system by CT (LSCT). Proc SPIE Int Soc Opt Eng. 1998; 3338:1314–1322.13. Zhou J, Chang S, Metaxas DN, Zhao B, Ginsberg MS, Schwartz LH. An automatic method for ground glass opacity nodule detection and segmentation from CT studies. Conf Proc IEEE Eng Med Biol Soc. 2006; 1:3062–3065.
Article14. Kim H, Katsumata Y, Tan JK, Ishikawa S. Automatic detection of GGO in CT lung images by using statistical features and neural networks. In : Proceedings of International Technical Conference on Circuits Systems, Computers and Communication (ITC-CSCC); 2009 Jul 5-8; Jeju, Korea. p. 705–708.15. Bastawrous HA, Fukumoto T, Nitta N, Tsudagawa M. Detection of ground glass opacities in lung CT images using Gabor filters and neural networks. In : Proceedings of IEEE Instrumentation and Measurement Technology Conference; 2005 May 16-19; Ottawa, Canada. p. 251–256.16. Ikeda K, Awai K, Mori T, Kawanaka K, Yamashita Y, Nomori H. Differential diagnosis of ground-glass opacity nodules: CT number analysis by three-dimensional computerized quantification. Chest. 2007; 132(3):984–990.
Article17. Tomasi C, Manduchi R. Bilateral filtering for gray and color images. In : Proceedings of 6th International Conference on Computer Vision; 1998 Jan 4-7; Bombay, India. p. 839–846.18. Barash D. Bilateral filtering and anisotropic diffusion: towards a unified viewpoint. In : Proceedings of 3rd International Conference on Scale-Space; 2001 Jul 7-8; Vancouver, Canada. p. 273–280.19. Caselles V, Catte F, Coll T, Dibos F. A geometric model for active contours in image processing. Numer Math. 1993; 66(1):1–31.
Article20. Sethian JA. A fast marching level set method for monotonically advancing fronts. Proc Natl Acad Sci U S A. 1996; 93(4):1591–1595.
Article21. Shyu KK, Pham VT, Tran TT, Lee PL. Global and local fuzzy energy-based active contours for image segmentation. Nonlinear Dyn. 2012; 67(2):1559–1578.
Article22. Li C, Xu C, Gui C, Fox MD. Level set evolution without re-initialization: a new variational formulation. In : Proceedings of 2005 IEEE Computer Society Conference on Computer Vision and Pattern Recognition; 2005 Jun 20-25; San Diego, CA. p. 430–436.23. Lankton S, Tannenbaum A. Localizing region-based active contours. IEEE Trans Image Process. 2008; 17(11):2029–2039.
Article24. Kaur J, Jindal A. Comparison of thyroid segmentation algorithms in ultrasound and scintigraphy images. Int J Comput Appl. 2012; 50(23):24–27.
Article25. Mingoti SA, Lima JO. Comparing SOM neural network with fuzzy C-means, k-means and traditional hierarchical clustering algorithms. Eur J Oper Res. 2006; 174(3):1742–1759.
Article26. Zijdenbos AP, Dawant BM, Margolin RA, Palmer AC. Morphometric analysis of white matter lesions in MR images: method and validation. IEEE Trans Med Imaging. 1994; 13(4):716–724.
Article27. Fawcett T. An introduction to ROC analysis. Pattern Recognit Lett. 2006; 27(8):861–874.
Article28. Kim HY, Shim YM, Lee KS, Han J, Yi CA, Kim YK. Persistent pulmonary nodular ground-glass opacity at thin-section CT: histopathologic comparisons. Radiology. 2007; 245(1):267–275.
Article29. Tang L, Kwon YH, Alward WL, Greenlee EC, Lee K, Garvin MK, et al. 3D reconstruction of the optic nerve head using stereo fundus images for computer-aided diagnosis of glaucoma. Proc SPIE Int Soc Opt Eng. 2010; 7624:76243.
Article30. Way TW, Hadjiiski LM, Sahiner B, Chan HP, Cascade PN, Kazerooni EA, et al. Computer-aided diagnosis of pulmonary nodules on CT scans: segmentation and classification using 3D active contours. Med Phys. 2006; 33(7):2323–2337.
Article
- Full Text Links
-
- Actions
-
Cited
- CITED
-
- Close
- Share
-
- Similar articles
-
- Squalene Aspiration Pneumonia: Thin-Section CT and Histopathologic Findings
- Pulmonary Manifestations of Fat Embolism on Thin-section CT: A Case Report
- Thin-Section CT Findings of Arc-Welders' Pneumoconiosis
- Hematogenous Candida Pneumonia in Major Burn Patients: Plain Chest Radiograph and Thin-section CT Findings
- Ground-Glass Nodule on Thin-Section CT: Differentiation among Adenocarcinoma In Situ, Minimally Invasive Adenocarcinoma and Lepidic Predominant Invasive Adenocarcinoma
