Value of Diffusion Tensor Imaging of Prostate Cancer: Comparison with Systemic Prostate Biopsy
- Affiliations
-
- 1Department of Radiology, Dong-A University, Medical Center, Korea. jedidw@naver.com
- 2Department of Occupational Medicine, Dong-A University, Medical Center, Korea.
- KMID: 2097935
- DOI: http://doi.org/10.3348/jksr.2011.64.2.179
Abstract
- PURPOSE
This study was performed to evaluate the usefulness of diffusion tensor imaging (DTI) and to correlate systemic twelve biopsy in prostate cancer.
MATERIALS AND METHODS
Thirty-one patients with suspected prostate cancer underwent MR imaging. DTI was performed prior to a prostate biopsy. We prospectively calculated the apparent diffusion coefficient (ADC) and fractional anisotropy (FA) value in each corresponding biopsy site.
RESULTS
Twenty-three of 31 patients had histopathologically proven adenocarcinoma. Among the 276 biopsy cores of 23 patients with prostate cancer, 109 cores showed positive results (39%). The ADC and FA value of positive cores were 1.31 +/- 0.34x10(-3) mm2/s and 0.68 +/- 0.07, and those of the negative cores were 1.74 +/- 0.45x10(-3) mm2/s and 0.54 +/- 0.09, respectively. Eight patients without carcinoma showed an ADC value of 1.83 +/- 0.26x10(-3) mm2/s and an FA value of 0.47 +/- 0.07. The ADC and FA value of positive cores were significantly lower and higher than those of negative cores and cancer-free patients, respectively (p < 0.05).
CONCLUSION
The ADC and FA values using DTI may provide useful diagnostic information in the differentiation of cancerous tissues, although there is overlap in some cases.
MeSH Terms
Figure
-
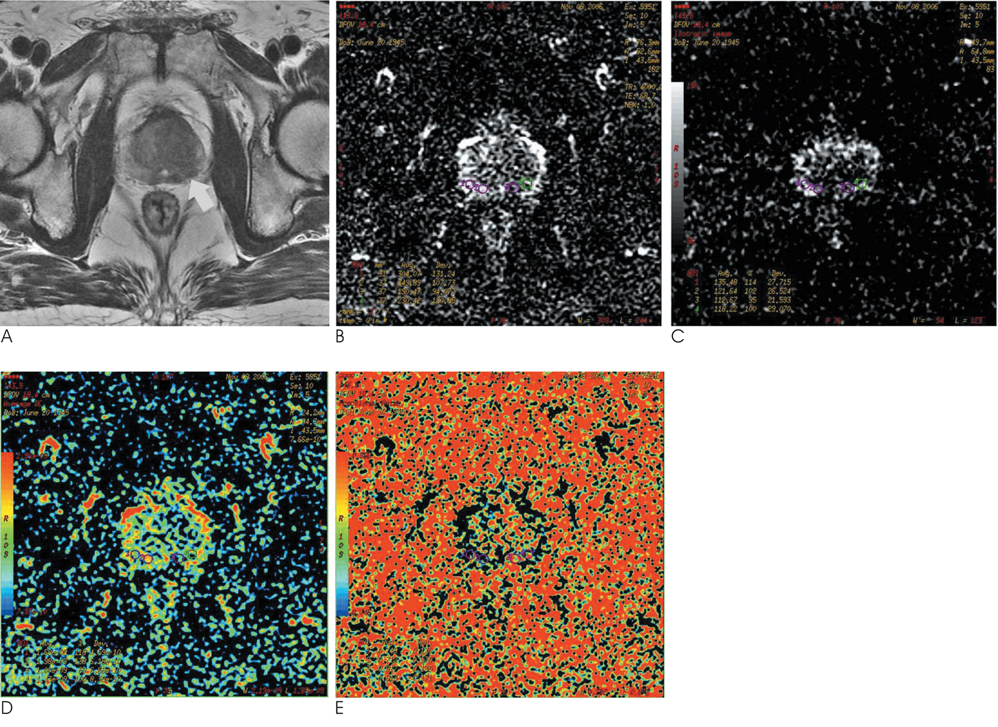
Fig. 1 T2-weighted image (A) shows low signal intensity (arrow) of the left peripheral zone in accordance with a positive biopsy result. We obtained b = 500 s/mm2 image (B) and isotropic image (C) using diffusion tensor imaging. The ADC (D) and FA (E) value shows corresponding decrease and increase in the same regions.

Fig. 2 Diagrams of the TRUS guided 12 biopsy site at the axial plane in 3 levels of the prostate glands (A-C).

Fig. 3 Receiver operating characteristics curve. Graph of the curve for ADC shows that the area under the curve is 0.914 for differentiating prostate cancer from non-cancerous tissue.

Fig. 4 Receiver operating characteristics curve. Graph of the curve for FA shows that the area under the curve is 0.983 for differentiating prostate cancer from non-cancerous tissue.
Reference
-
1. Sundgren PC, Dong Q, Gómez-Hassan D, Mukherji SK, Maly P, Welsh R. Diffusion tensor imaging of the brain: review of clinical applications. Neuroradiology. 2004; 46:339–350.2. Yang Q, Tress BM, Barber PA, Desmond PM, Darby DG, Gerraty RP, et al. Serial study of apparent diffusion coefficient and anisotropy in patients with acute stroke. Stoke. 1999; 30:2382–2390.3. Sato C, Naganawa S, Nakamura T, Kumada H, Miura S, Takizawa O, et al. Differentiation of noncancerous tissue and cancer lesions by apparent diffusion coefficient values in transition and peripheral zones of the prostate. J Magn Reson Imaging. 2005; 21:258–262.4. Kozlowski P, Chang SD, Jones EC, Berean KW, Chen H, Goldenberg SL. Combined diffusion-weighted and dynamic contrast-enhanced MRI for prostate cancer diagnosis-correlation with biopsy and histopathology. J Magn Reson Imaging. 2006; 24:108–113.5. Haider MA, van der Kwast TH, Tanguay J, Evans AJ, Hashmi AT, Lockwood G, et al. Combined T2-weighted and diffusion-weighted MRI for localization of prostate cancer. AJR Am J Roentgenol. 2007; 189:323–328.6. Tanimoto A, Nakashima J, Kohno H, Shinmoto H, Kuribayashi S. Prostate cancer screening: the clinical value of diffusion-weighted imaging and dynamic MR imaging in combination with T2-weighted imaging. J Magn Reson Imaging. 2007; 25:146–152.7. Tamada T, Sone T, Jo Y, Toshimitsu S, Yamashita T, Yamamoto A, et al. Apparent diffusion coefficient values in peripheral and transition zones of the prostate: comparison between normal and malignant prostatic tissues and correlation with histologic grade. J Magn Reson Imaging. 2008; 28:720–726.8. Kim JH, Kim JK, Park BW, Kim N, Cho KS. Apparent diffusion coefficient: prostate cancer versus noncancerous tissue according to anatomical region. J Magn Reson Imaging. 2008; 28:1173–1179.9. Sinha S, Sinha U. In vivo diffusion tensor imaging of the human prostate. Magn Reson Med. 2004; 52:530–537.10. Le Bihan D, Mangin JF, Poupon C, Clark CA, Pappata S, Molko N, et al. Diffusion tensor imaging: concepts and applications. J Magn Reson Imaging. 2001; 13:534–546.11. Gibbs P, Tozer DJ, Liney GP, Turnbull LW. Comparison of quantitative T2 mapping and diffusion-weighted imaging in the normal and pathologic prostate. Magn Reson Med. 2001; 46:1054–1058.12. Hoehn-Berlage M, Eis M, Schmitz B. Regional and directional anisotropy of apparent diffusion coefficient in rat brain. NMR Biomed. 1999; 12:45–50.13. Tamada T, Sone T, Toshimitsu S, Imai S, Jo Y, Yoshida K, et al. Age-related and zonal anatomical changes of apparent diffusion coefficient values in normal human prostatic tissues. J Magn Reson Imaging. 2008; 27:552–556.
- Full Text Links
-
- Actions
-
Cited
- CITED
-
- Close
- Share
-
- Similar articles
-
- Effectiveness of Bi-Parametric MR/US Fusion Biopsy for Detecting Clinically Significant Prostate Cancer in Prostate Biopsy Naïve Men
- How to use new transrectal ultrasound in prostate cancer detection and biopsy for beginners and experts
- Prostate Biopsy: General Consideration and Systematic Biopsy
- Multiparametric MRI in the Detection of Clinically Significant Prostate Cancer
- Medical imaging of prostate cancer
