Correlations of 3T DCE-MRI Quantitative Parameters with Microvessel Density in a Human-Colorectal-Cancer Xenograft Mouse Model
- Affiliations
-
- 1Department of Radiology and Research Institute of Radiological Science, College of Medicine, Yonsei University, Seoul 120-752, Korea. hotsong@yuhs.ac
- 2Department of Radiation Oncology, College of Medicine, Yonsei University, Seoul 120-752, Korea.
- KMID: 1101927
- DOI: http://doi.org/10.3348/kjr.2011.12.6.722
Abstract
OBJECTIVE
To investigate the correlation between quantitative dynamic contrast enhanced magnetic resonance imaging (DCE-MRI) parameters and microvascular density (MVD) in a human-colon-cancer xenograft mouse model using 3 Tesla MRI.
MATERIALS AND METHODS
A human-colon-cancer xenograft model was produced by subcutaneously inoculating 1 x 10⁶ DLD-1 human-colon-cancer cells into the right hind limbs of 10 mice. The tumors were allowed to grow for two weeks and then assessed using MRI. DCE-MRI was performed by tail vein injection of 0.3 mmol/kg of gadolinium. A region of interest (ROI) was drawn at the midpoints along the z-axes of the tumors, and a Tofts model analysis was performed. The quantitative parameters (Ktrans, Kep and Ve) from the whole transverse ROI and the hotspot ROI of the tumor were calculated. Immunohistochemical microvessel staining was performed and analyzed according to Weidner's criteria at the corresponding MRI sections. Additional Hematoxylin and Eosin staining was performed to evaluate tumor necrosis. The Mann-Whitney test and Spearman's rho correlation analysis were performed to prove the existence of a correlation between the quantitative parameters, necrosis, and MVD. RESULTS: Whole transverse ROI of the tumor showed no significant relationship between the MVD values and quantitative DCE-MRI parameters. In the hotspot ROI, there was a difference in MVD between low and high group of Ktrans and Kep that had marginally statistical significance (ps = 0.06 and 0.07, respectively). Also, Ktrans and Kep were found to have an inverse relationship with MVD (r = -0.61, p = 0.06 in Ktrans; r = -0.60, p = 0.07 in Kep).
CONCLUSION
Quantitative analysis of T1-weighted DCE-MRI using hotspot ROI may provide a better histologic match than whole transverse section ROI. Within the hotspots, Ktrans and Kep tend to have a reverse correlation with MVD in this colon cancer mouse model.
Keyword
MeSH Terms
-
Animals
Capillary Permeability
Colorectal Neoplasms/*blood supply/pathology
*Contrast Media
Female
Gadolinium/diagnostic use
Humans
Image Processing, Computer-Assisted
Immunohistochemistry
*Magnetic Resonance Imaging
Mice
Mice, Nude
Microvessels/*pathology
Neoplasm Transplantation
Neovascularization, Pathologic/diagnosis
Figure
-
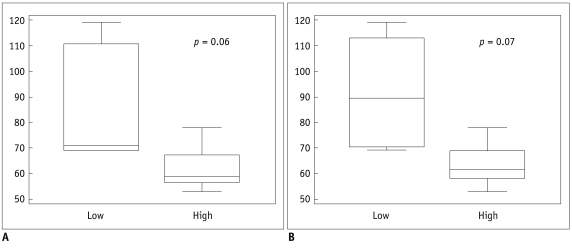
Fig. 1 Box whisker plot of microvascular density evaluating region of interest drawn on hotspots.Distribution of low and high groups is shown in Ktrans (A) and Kep (B).
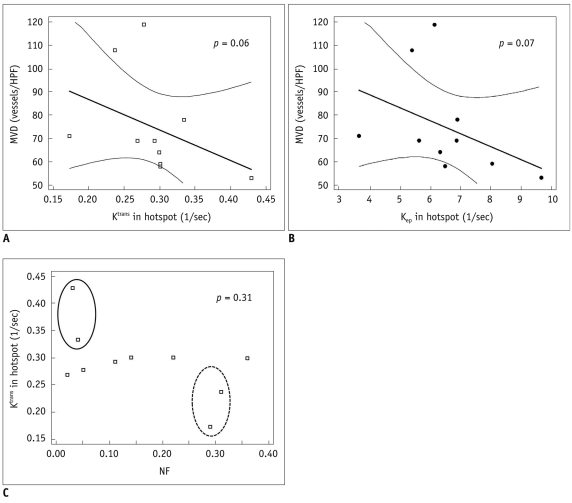
Fig. 2 Representative scatter diagrams showing relationships between microvascular density, necrotic fraction, and dynamic contrast enhanced MRI derived parameters from hotspots.A, B. Ktrans and microvascular density (Spearman's correlation = -0.61, p = 0.06) (A), Kep and microvascular density (Spearman's correlation = -0.60, p = 0.07) (B). Dashed line indicates 95% confidence interval. C. Necrotic fraction and Ktrans (Spearman's correlation = -0.34, p = 0.31). Solid circle represents group that shows low necrotic fraction and high Ktrans. Dashed circle represents group who showed high necrotic fraction and low Ktrans. MVD = microvascular density, NF = necrotic fraction
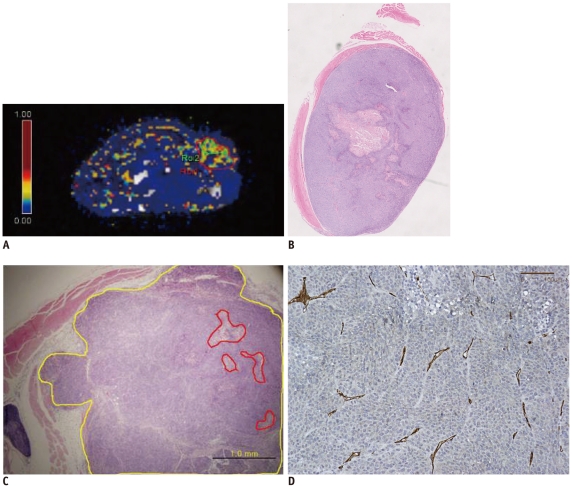
Fig. 3 Pixel-by-pixel analysis of Ktrans in tumor of representative mouse #2 evaluated by dynamic contrast enhanced MRI with Tofts model.A. Ktrans values of whole tumor (ROI 1) and hotspot (ROI 2) are 0.285/sec and 0.429/sec, respectively. ROI 1 and ROI 2 are marked by red and green solid lines. B. Hematoxylin and Eosin staining of corresponding section of mouse #2 (original magnification, × 2). Necrosis is noted in center of tumor. C. Hematoxylin and Eosin staining includes hotspot area. Tumor necrosis fraction is 0.03 (original magnification, × 40). Yellow line indicates tumor border and red line indicates area of necrosis. D. CD 31 staining of tumor from mouse #2. Microvascular density count is 53 (original magnification, × 200).
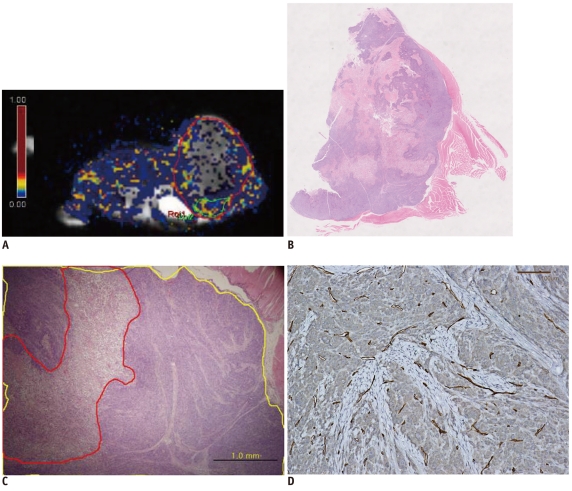
Fig. 4 Pixel by pixel analysis of Ktrans in tumor of another representative mouse (#10).A. Ktrans values of whole tumors and hotspots were 0.113/sec and 0.237/sec respectively. ROI 1 and ROI 2 are marked by red and green solid lines, respectively. B. Hematoxylin and Eosin staining of corresponding section of mouse #10. Large amount of necrosis is shown (original magnification, × 2). C. Hematoxylin and Eosin staining including hotspot region. Tumor necrotic fraction is 0.31 (original magnification, × 40). Yellow line indicates tumor border and red line indicates area of necrosis. D. CD 31 staining of tissue from mouse #10. Microvascular density count is 108 (original magnification, × 200).
Cited by 1 articles
-
Quantitative Assessment of Tumor Responses after Radiation Therapy in a DLD-1 Colon Cancer Mouse Model Using Serial Dynamic Contrast-Enhanced Magnetic Resonance Imaging
Sung Jun Ahn, Woong Sub Koom, Chan Sik An, Joon Seok Lim, Seung-Koo Lee, Jin-Suck Suh, Ho-Taek Song
Yonsei Med J. 2012;53(6):1147-1153. doi: 10.3349/ymj.2012.53.6.1147.
Reference
-
1. Folkman J. New perspectives in clinical oncology from angiogenesis research. Eur J Cancer. 1996; 32A:2534–2539. PMID: 9059344.
Article2. Rak JW, St Croix BD, Kerbel RS. Consequences of angiogenesis for tumor progression, metastasis and cancer therapy. Anticancer Drugs. 1995; 6:3–18. PMID: 7538829.
Article3. Vermeulen PB, Gasparini G, Fox SB, Toi M, Martin L, McCulloch P, et al. Quantification of angiogenesis in solid human tumours: an international consensus on the methodology and criteria of evaluation. Eur J Cancer. 1996; 32A:2474–2484. PMID: 9059336.
Article4. Deen S, Ball RY. Basement membrane and extracellular interstitial matrix components in bladder neoplasia--evidence of angiogenesis. Histopathology. 1994; 25:475–481. PMID: 7532615.
Article5. Nagy JA, Brown LF, Senger DR, Lanir N, Van de Water L, Dvorak AM, et al. Pathogenesis of tumor stroma generation: a critical role for leaky blood vessels and fibrin deposition. Biochim Biophys Acta. 1989; 948:305–326. PMID: 2465781.
Article6. Tofts PS, Brix G, Buckley DL, Evelhoch JL, Henderson E, Knopp MV, et al. Estimating kinetic parameters from dynamic contrast-enhanced T(1)-weighted MRI of a diffusable tracer: standardized quantities and symbols. J Magn Reson Imaging. 1999; 10:223–232. PMID: 10508281.
Article7. Hawighorst H, Knapstein PG, Weikel W, Knopp MV, Zuna I, Knof A, et al. Angiogenesis of uterine cervical carcinoma: characterization by pharmacokinetic magnetic resonance parameters and histological microvessel density with correlation to lymphatic involvement. Cancer Res. 1997; 57:4777–4786. PMID: 9354439.8. Hulka CA, Edmister WB, Smith BL, Tan L, Sgroi DC, Campbell T, et al. Dynamic echo-planar imaging of the breast: experience in diagnosing breast carcinoma and correlation with tumor angiogenesis. Radiology. 1997; 205:837–842. PMID: 9393545.
Article9. Collins DJ, Padhani AR. Dynamic magnetic resonance imaging of tumor perfusion. Approaches and biomedical challenges. IEEE Eng Med Biol Mag. 2004; 23:65–83. PMID: 15565801.10. de Lussanet QG, Backes WH, Griffioen AW, Padhani AR, Baeten CI, van Baardwijk A, et al. Dynamic contrast-enhanced magnetic resonance imaging of radiation therapy-induced microcirculation changes in rectal cancer. Int J Radiat Oncol Biol Phys. 2005; 63:1309–1315. PMID: 16125874.
Article11. Tuncbilek N, Karakas HM, Altaner S. Dynamic MRI in indirect estimation of microvessel density, histologic grade, and prognosis in colorectal adenocarcinomas. Abdom Imaging. 2004; 29:166–172. PMID: 15290941.
Article12. Zhang XM, Yu D, Zhang HL, Dai Y, Bi D, Liu Z, et al. 3D dynamic contrast-enhanced MRI of rectal carcinoma at 3T: correlation with microvascular density and vascular endothelial growth factor markers of tumor angiogenesis. J Magn Reson Imaging. 2008; 27:1309–1316. PMID: 18504761.
Article13. Ceelen W, Smeets P, Backes W, Van Damme N, Boterberg T, Demetter P, et al. Noninvasive monitoring of radiotherapy-induced microvascular changes using dynamic contrast enhanced magnetic resonance imaging (DCE-MRI) in a colorectal tumor model. Int J Radiat Oncol Biol Phys. 2006; 64:1188–1196. PMID: 16457965.
Article14. Weidner N, Semple JP, Welch WR, Folkman J. Tumor angiogenesis and metastasis--correlation in invasive breast carcinoma. N Engl J Med. 1991; 324:1–8. PMID: 1701519.15. Buadu LD, Murakami J, Murayama S, Hashiguchi N, Sakai S, Masuda K, et al. Breast lesions: correlation of contrast medium enhancement patterns on MR images with histopathologic findings and tumor angiogenesis. Radiology. 1996; 200:639–649. PMID: 8756909.
Article16. Cooper RA, Carrington BM, Loncaster JA, Todd SM, Davidson SE, Logue JP, et al. Tumour oxygenation levels correlate with dynamic contrast-enhanced magnetic resonance imaging parameters in carcinoma of the cervix. Radiother Oncol. 2000; 57:53–59. PMID: 11033189.
Article17. Stomper PC, Winston JS, Herman S, Klippenstein DL, Arredondo MA, Blumenson LE. Angiogenesis and dynamic MR imaging gadolinium enhancement of malignant and benign breast lesions. Breast Cancer Res Treat. 1997; 45:39–46. PMID: 9285115.
Article18. Schlemmer HP, Merkle J, Grobholz R, Jaeger T, Michel MS, Werner A, et al. Can pre-operative contrast-enhanced dynamic MR imaging for prostate cancer predict microvessel density in prostatectomy specimens? Eur Radiol. 2004; 14:309–317. PMID: 14531000.
Article19. Galban CJ, Chenevert TL, Meyer CR, Tsien C, Lawrence TS, Hamstra DA, et al. The parametric response map is an imaging biomarker for early cancer treatment outcome. Nat Med. 2009; 15:572–576. PMID: 19377487.
Article20. Sahani DV, Holalkere NS, Mueller PR, Zhu AX. Advanced hepatocellular carcinoma: CT perfusion of liver and tumor tissue--initial experience. Radiology. 2007; 243:736–743. PMID: 17517931.
- Full Text Links
-
- Actions
-
Cited
- CITED
-
- Close
- Share
-
- Similar articles
-
- Quantitative Assessment of Tumor Responses after Radiation Therapy in a DLD-1 Colon Cancer Mouse Model Using Serial Dynamic Contrast-Enhanced Magnetic Resonance Imaging
- Expression of Cyclooxygenase-2 and Tumor Microvessel Density in Colorectal Cancer
- Perfusion Parameters of Dynamic Contrast-Enhanced Magnetic Resonance Imaging in Patients with Rectal Cancer: Correlation with Microvascular Density and Vascular Endothelial Growth Factor Expression
- Correlation of Semi-Quantitative Breast-Specific Gamma Imaging Findings with Dynamic Contrast-Enhanced MRI Parameters Assessed by a Computer-Aided Evaluation Program for Breast Cancer
- Correlations of Dynamic Contrast-Enhanced Magnetic Resonance Imaging with Morphologic, Angiogenic, and Molecular Prognostic Factors in Rectal Cancer
