Expression of LONP1 Is High in Visceral Adipose Tissue in Obesity, and Is Associated with Glucose and Lipid Metabolism
- Lee JH
 1,2
1,2 - Jung SB2
- Lee SE2
- Kim JE2
- Kim JT2
- Kang YE1,2
- Kang SG2
- Yi HS1,2
- Ko YB3
- Lee KH3
- Ku BJ1,2
- Shong M1,2
- Kim HJ1,2
- Affiliations
-
- 1Department of Internal Medicine, Chungnam National University College of Medicine, Daejeon, Korea
- 2Research Center for Endocrine and Metabolic Diseases, Chungnam National University College of Medicine, Daejeon, Korea
- 3Department of Obstetrics and Gynecology, Chungnam National University College of Medicine, Daejeon, Korea
- KMID: 2517656
- DOI: http://doi.org/10.3803/EnM.2021.1023
Abstract
- Background
The nature and role of the mitochondrial stress response in adipose tissue in relation to obesity are not yet known. To determine whether the mitochondrial unfolded protein response (UPRmt) in adipose tissue is associated with obesity in humans and rodents.
Methods
Visceral adipose tissue (VAT) was obtained from 48 normoglycemic women who underwent surgery. Expression levels of mRNA and proteins were measured for mitochondrial chaperones, intrinsic proteases, and components of electron-transport chains. Furthermore, we systematically analyzed metabolic phenotypes with a large panel of isogenic BXD inbred mouse strains and Genotype-Tissue Expression (GTEx) data.
Results
In VAT, expression of mitochondrial chaperones and intrinsic proteases localized in inner and outer mitochondrial membranes was not associated with body mass index (BMI), except for the Lon protease homolog, mitochondrial, and the corresponding gene LONP1, which showed high-level expression in the VAT of overweight or obese individuals. Expression of LONP1 in VAT positively correlated with BMI. Analysis of the GTEx database revealed that elevation of LONP1 expression is associated with enhancement of genes involved in glucose and lipid metabolism in VAT. Mice with higher Lonp1 expression in adipose tissue had better systemic glucose metabolism than mice with lower Lonp1 expression.
Conclusion
Expression of mitochondrial LONP1, which is involved in the mitochondrial quality control stress response, was elevated in the VAT of obese individuals. In a bioinformatics analysis, high LONP1 expression in VAT was associated with enhanced glucose and lipid metabolism.
Keyword
Figure
-
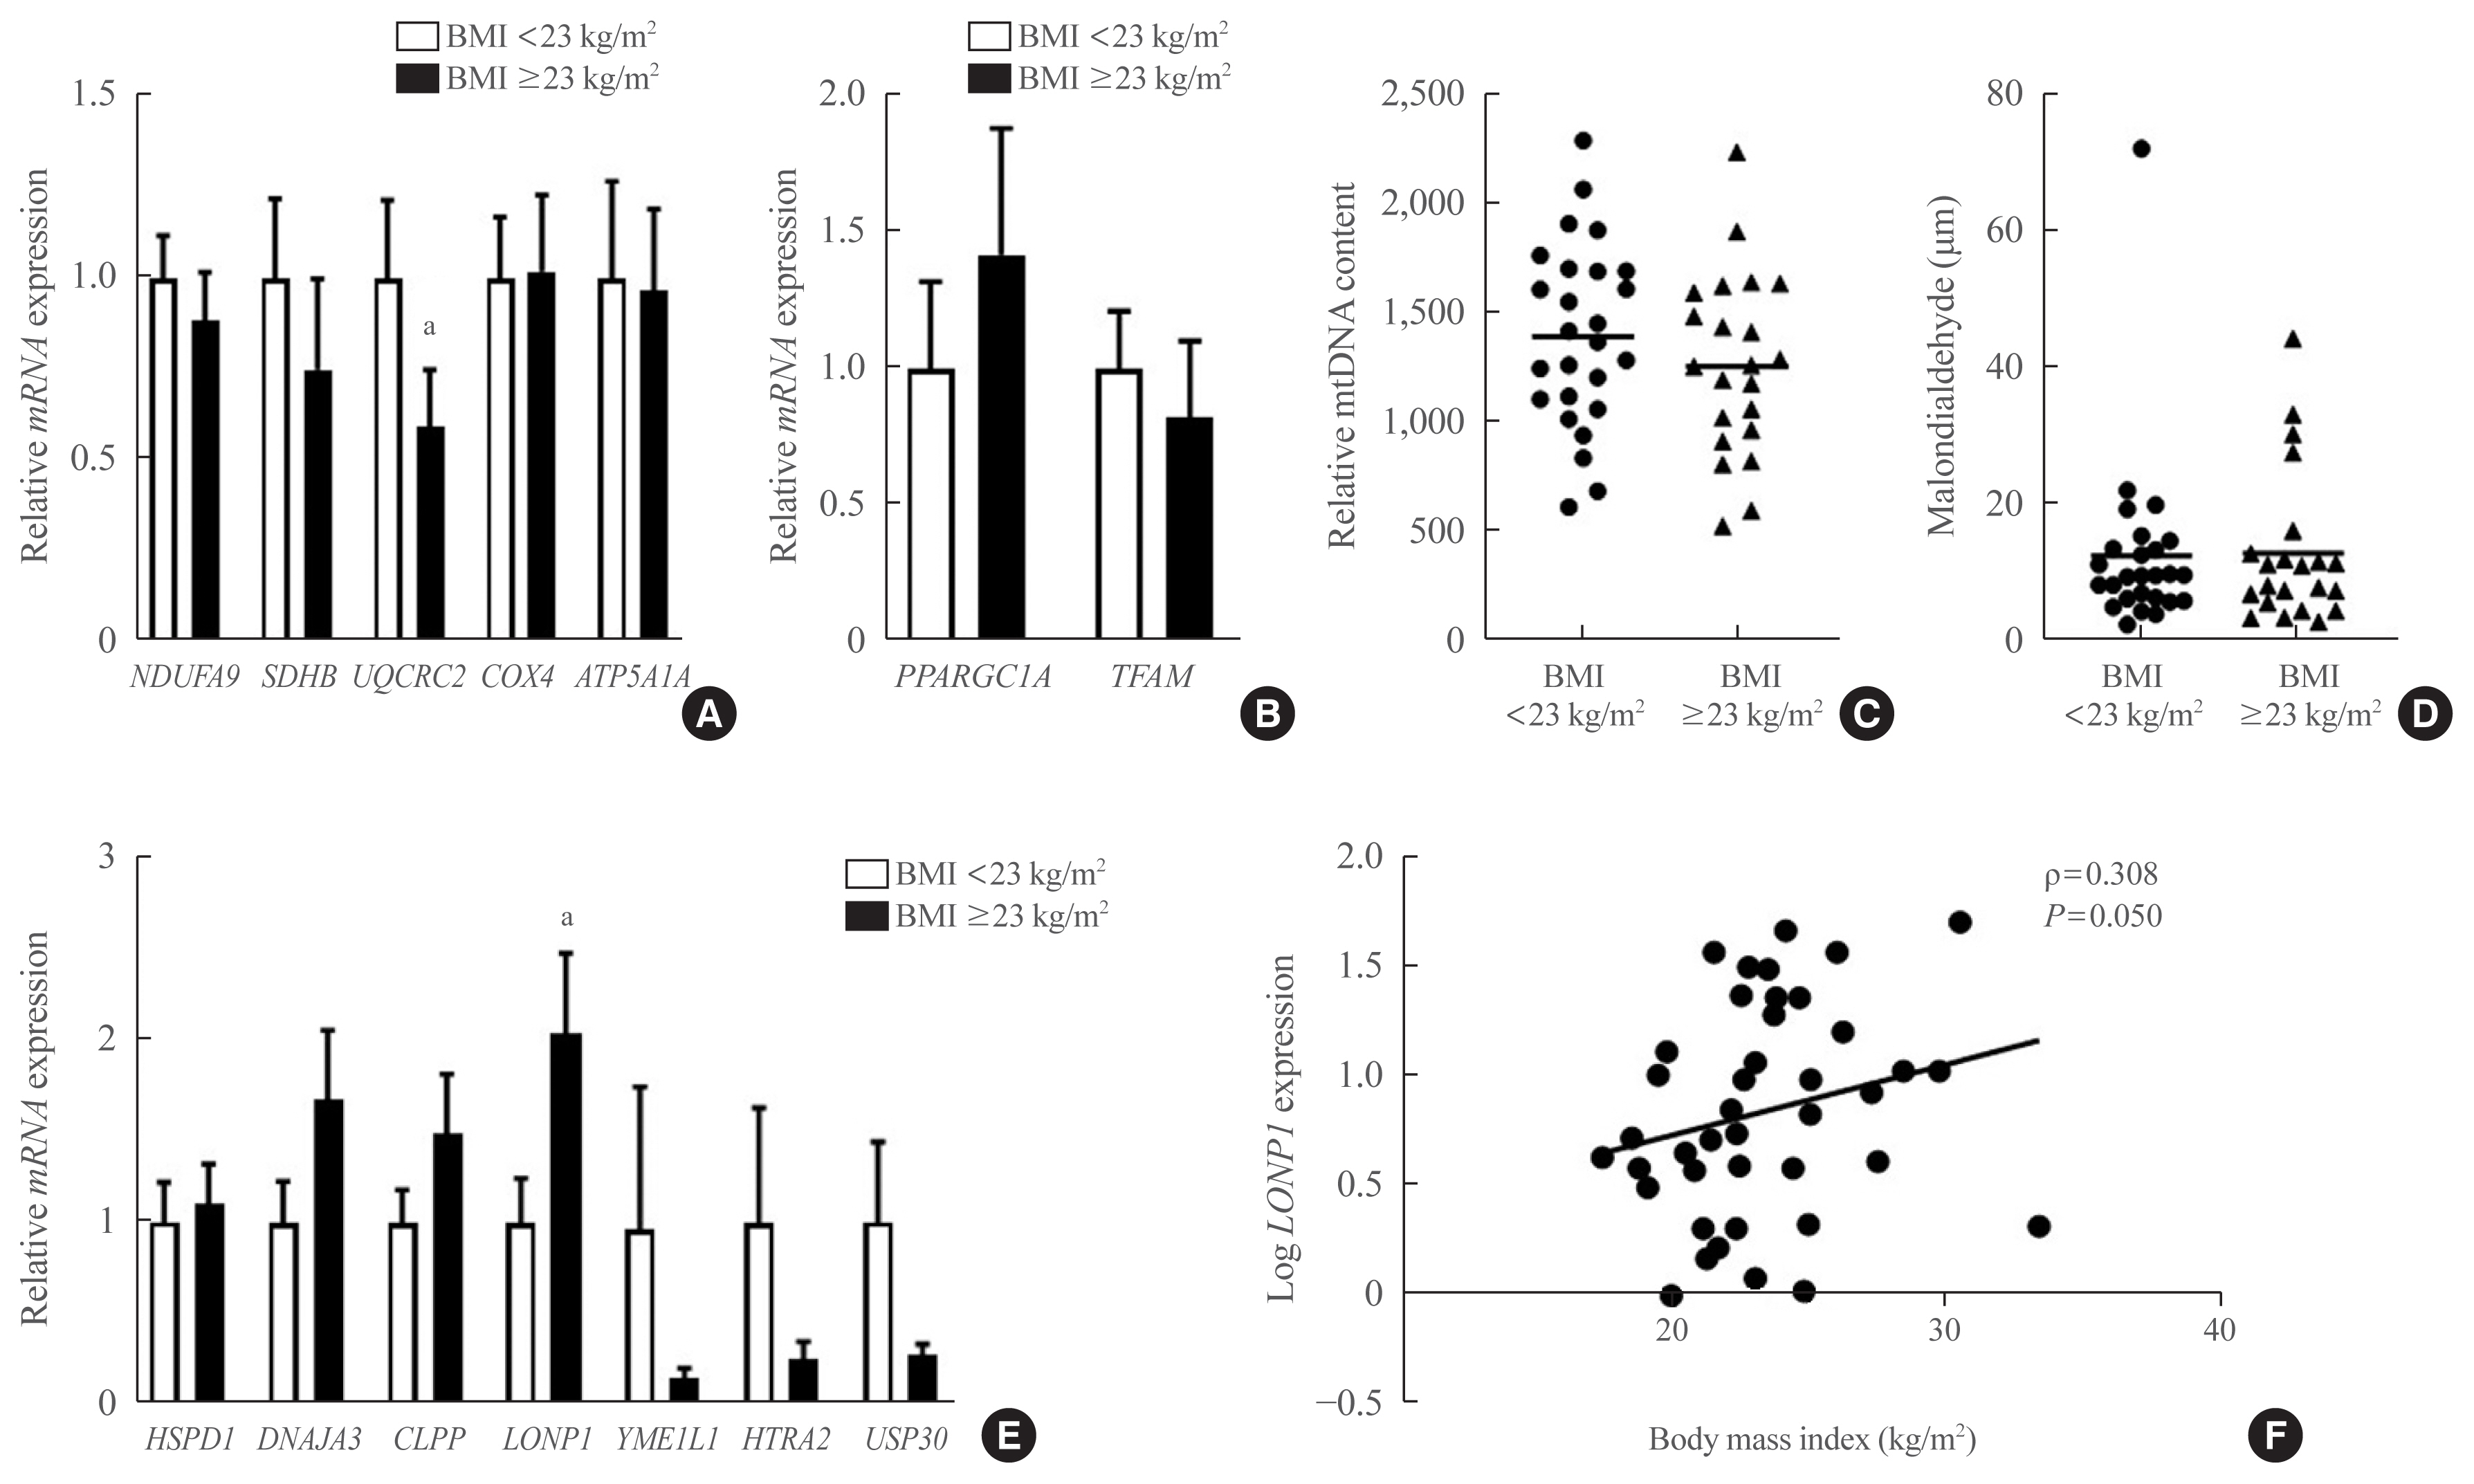
Fig. 1 Visceral adipose tissue expression of genes encoding proteins of the oxidative phosphorylation (OXPHOS) complex, mitochondrial chaperones, and proteases in relation to body mass index (BMI). Relative mRNA expression of genes of the OXPHOS complex (A) and mitochondrial biogenesis (B) in the visceral adipose tissue between a group with BMI <23 kg/m2 (n=26) and a group with BMI ≥23 kg/m2 (n=26). Gene expression relative to the mean level in the group with BMI <23 kg/m2 was determined for each sample by real-time polymerase chain reaction. (C) Relative mitochondrial DNA (mtDNA) content. (D) Malondianldehyde concentration. (E) Relative mRNA expression of genes encoding mitochondrial chaperones and proteases. (F) Correlation between Lon peptidase 1, mitochondrial (LONP1) mRNA expression in the visceral adipose tissue and BMI. Relative mRNA expression is presented as mean±standard error of the mean. P values were calculated by the Mann-Whitney U test. NDUFA9, NADH:ubiquinone oxidoreductase subunit A9; SDHB, NADH dehydrogenase (ubiquinone) 1 beta subcomplex subunit 8, mitochondrial; UQCRC2, ubiquinol-cytochrome-c reductase complex core protein 2; COX2, cytochrome c oxidase subunit II; ATP5A1A, ATP synthase F1 subunit alpha; PPARGC1A, PPARG coactivator 1 alpha; TFAM, transcription factor A, mitochondrial; HSPD1, heat shock protein family D (Hsp60) member 1; DNAJA3, DnaJ heat shock protein family (Hsp40) member A3; CLPP, caseinolytic mitochondrial matrix peptidase proteolytic subunit; YME1L1, YME1 like 1 ATPase; HTRA2, HtrA serine peptidase 2; USP30, ubiquitin specific peptidase 30. aP<0.01.
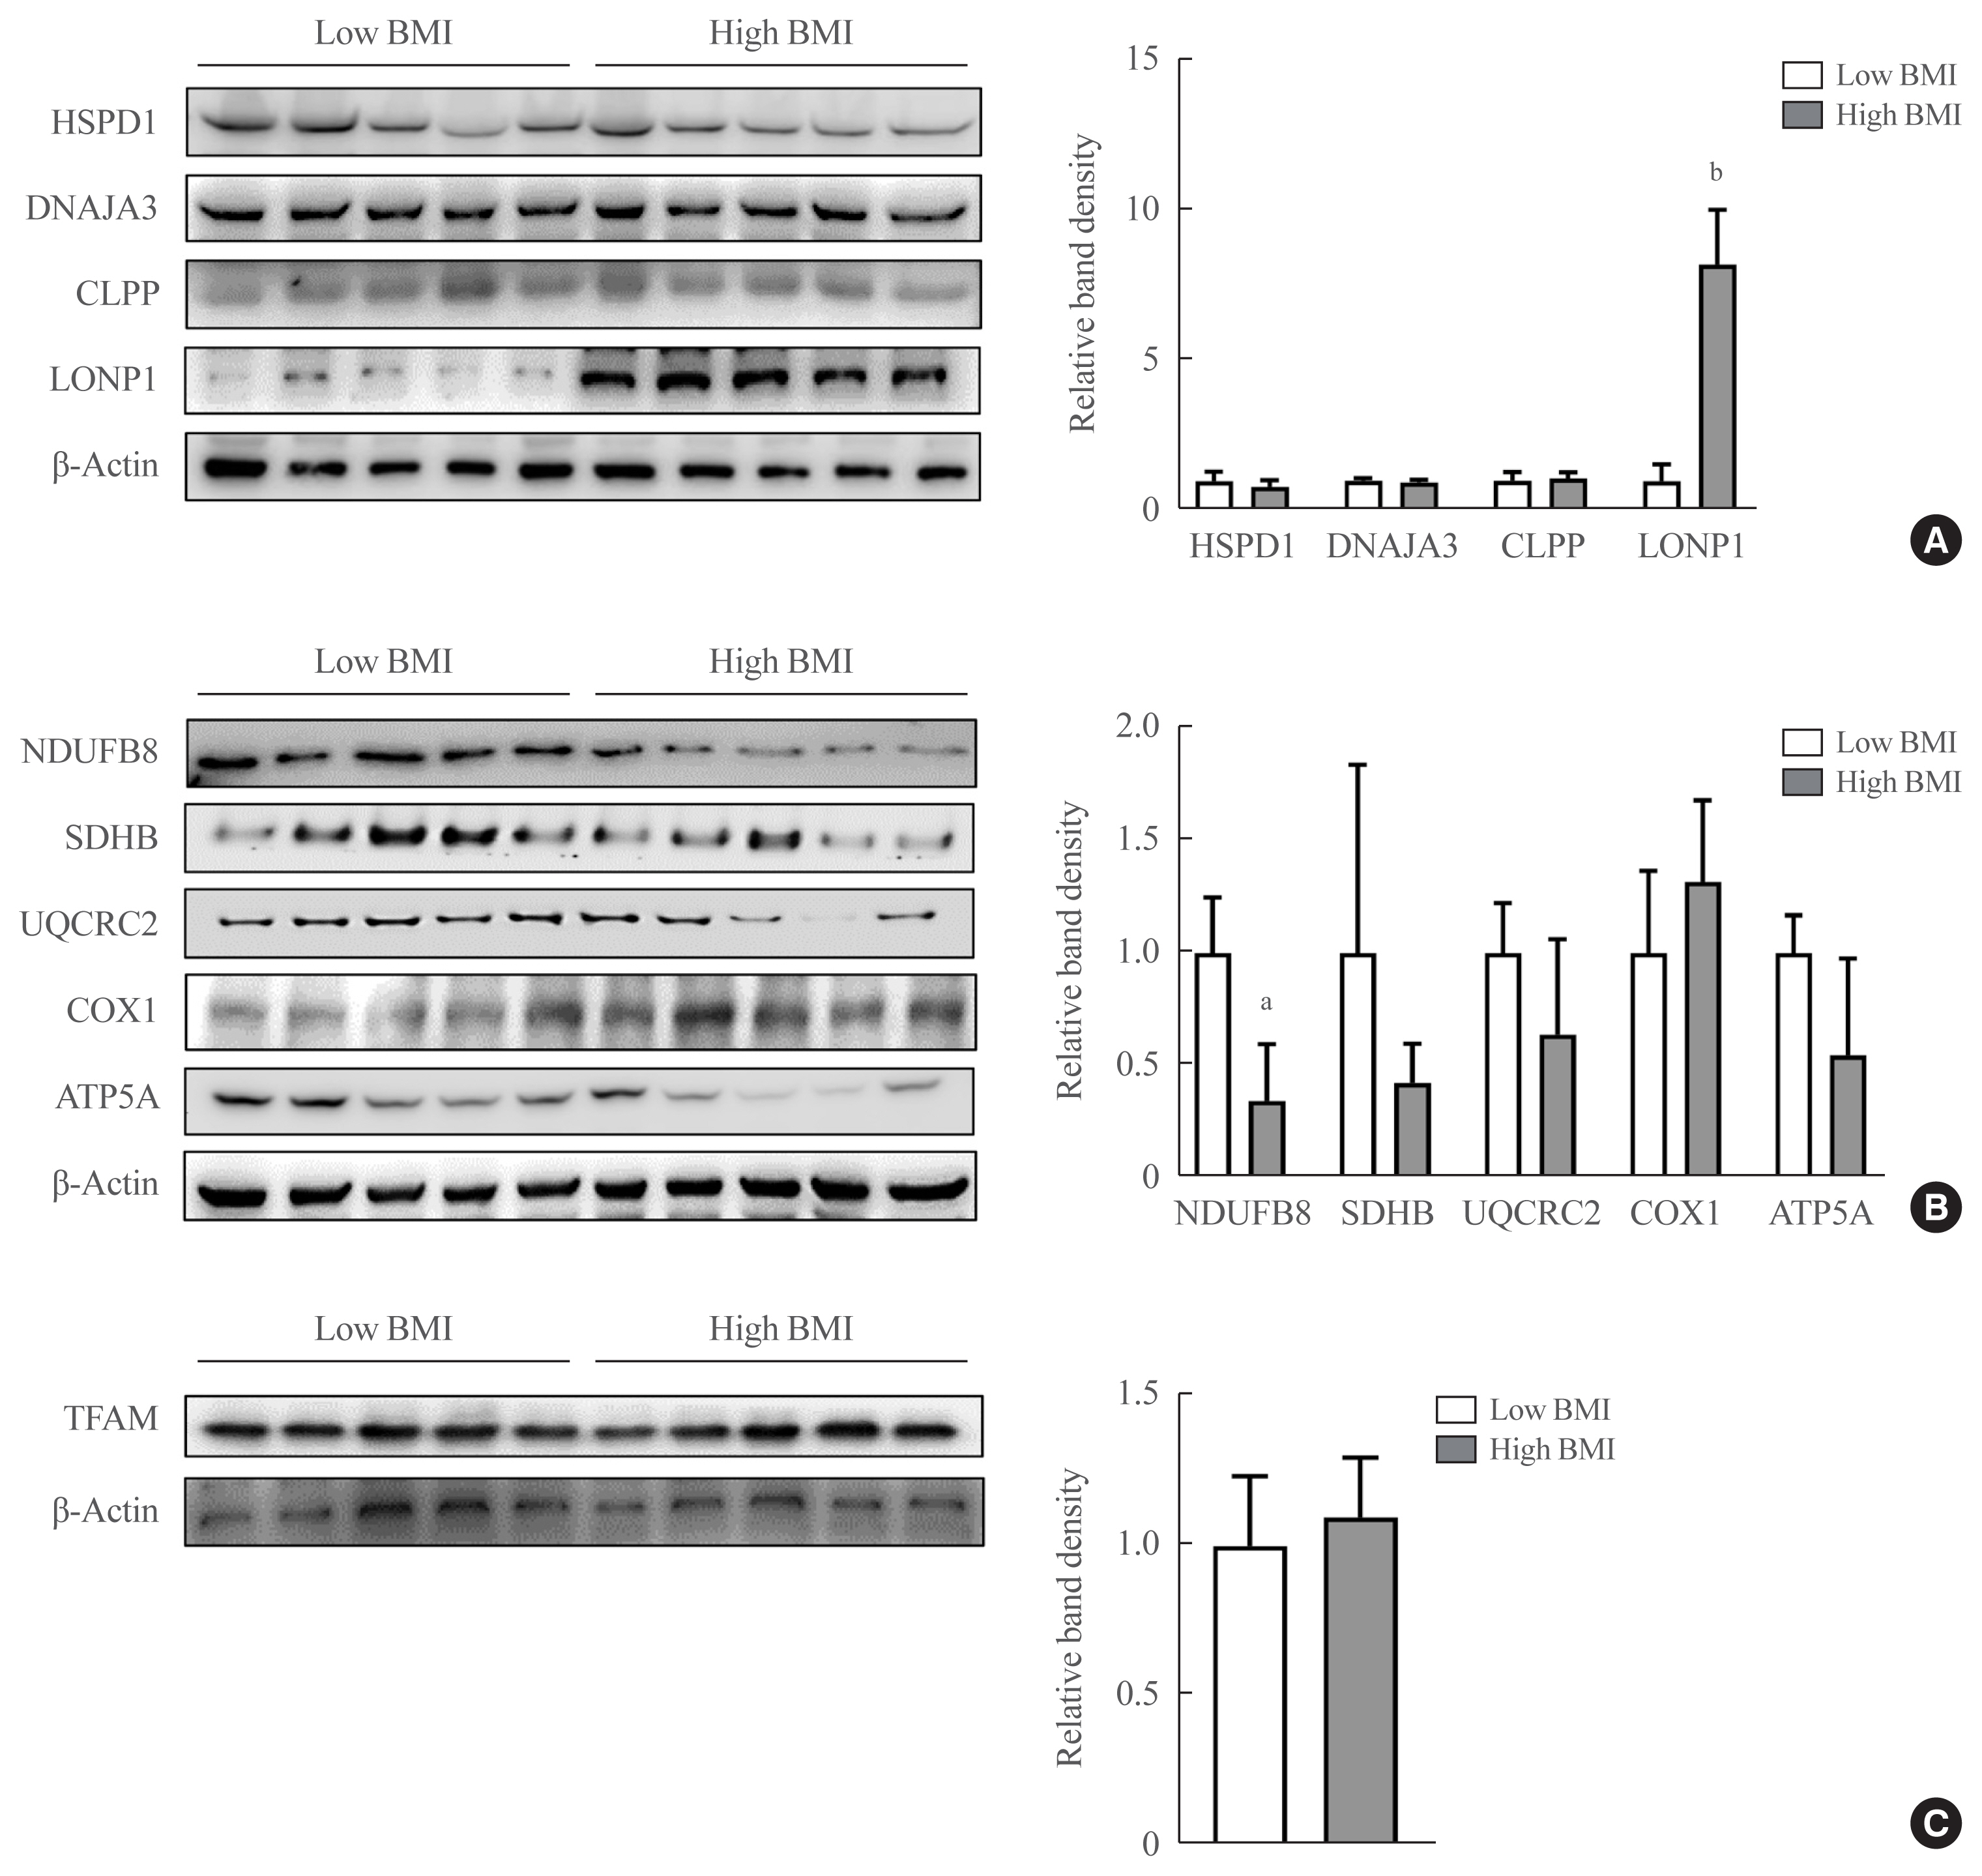
Fig. 2 Expression of proteins of the oxidative phosphorylation (OXPHOS) complex, transcription factors, mitochondrial chaperones, and proteases in human visceral adipose tissue. (A) Expression of mitochondrial chaperones and proteases in visceral adipose tissue of the five participants with the lowest body mass index (BMI; low BMI: mean, 18.6 kg/m2; range, 17.4 to 19.3 kg/m2) and the five with the highest BMI (high BMI: mean, 29.6 kg/m2; range, 27.5 to 31.8 kg/m2). (B) Expression of proteins of the OXPHOS complex. (C) Expression of transcription factor A, mitochondrial (TFAM). Western blot band density relative to β-actin of each sample is calculated and presented as mean±standard error of the mean (n=5). P values were calculated by the Mann-Whitney U test. HSPD1, 60 kDa heat shock protein, mitochondrial; DNAJA3, DnaJ heat shock protein family (Hsp40) member A3; CLPP, caseinolytic mitochondrial matrix peptidase proteolytic subunit; LONP1, Lon protease homolog, mitochondrial; NDUFB8, NADH dehydrogenase (ubiquinone) 1 beta subcomplex subunit 8, mitochondrial (OXPHOS complex I); SDHB, succinate dehydrogenase (ubiquinone) iron-sulfur subunit, mitochondrial (OXPHOS complex II); UQCRC2, ubiquinol-cytochrome-c reductase complex core protein 2 (OXPHOS complex III); COX1, cytochrome c oxidase subunit 1 (OXPHOS complex IV); ATP5A1A, ATP synthase F1 subunit alpha (OXPHOS complex V). aP<0.01; bP<0.001.
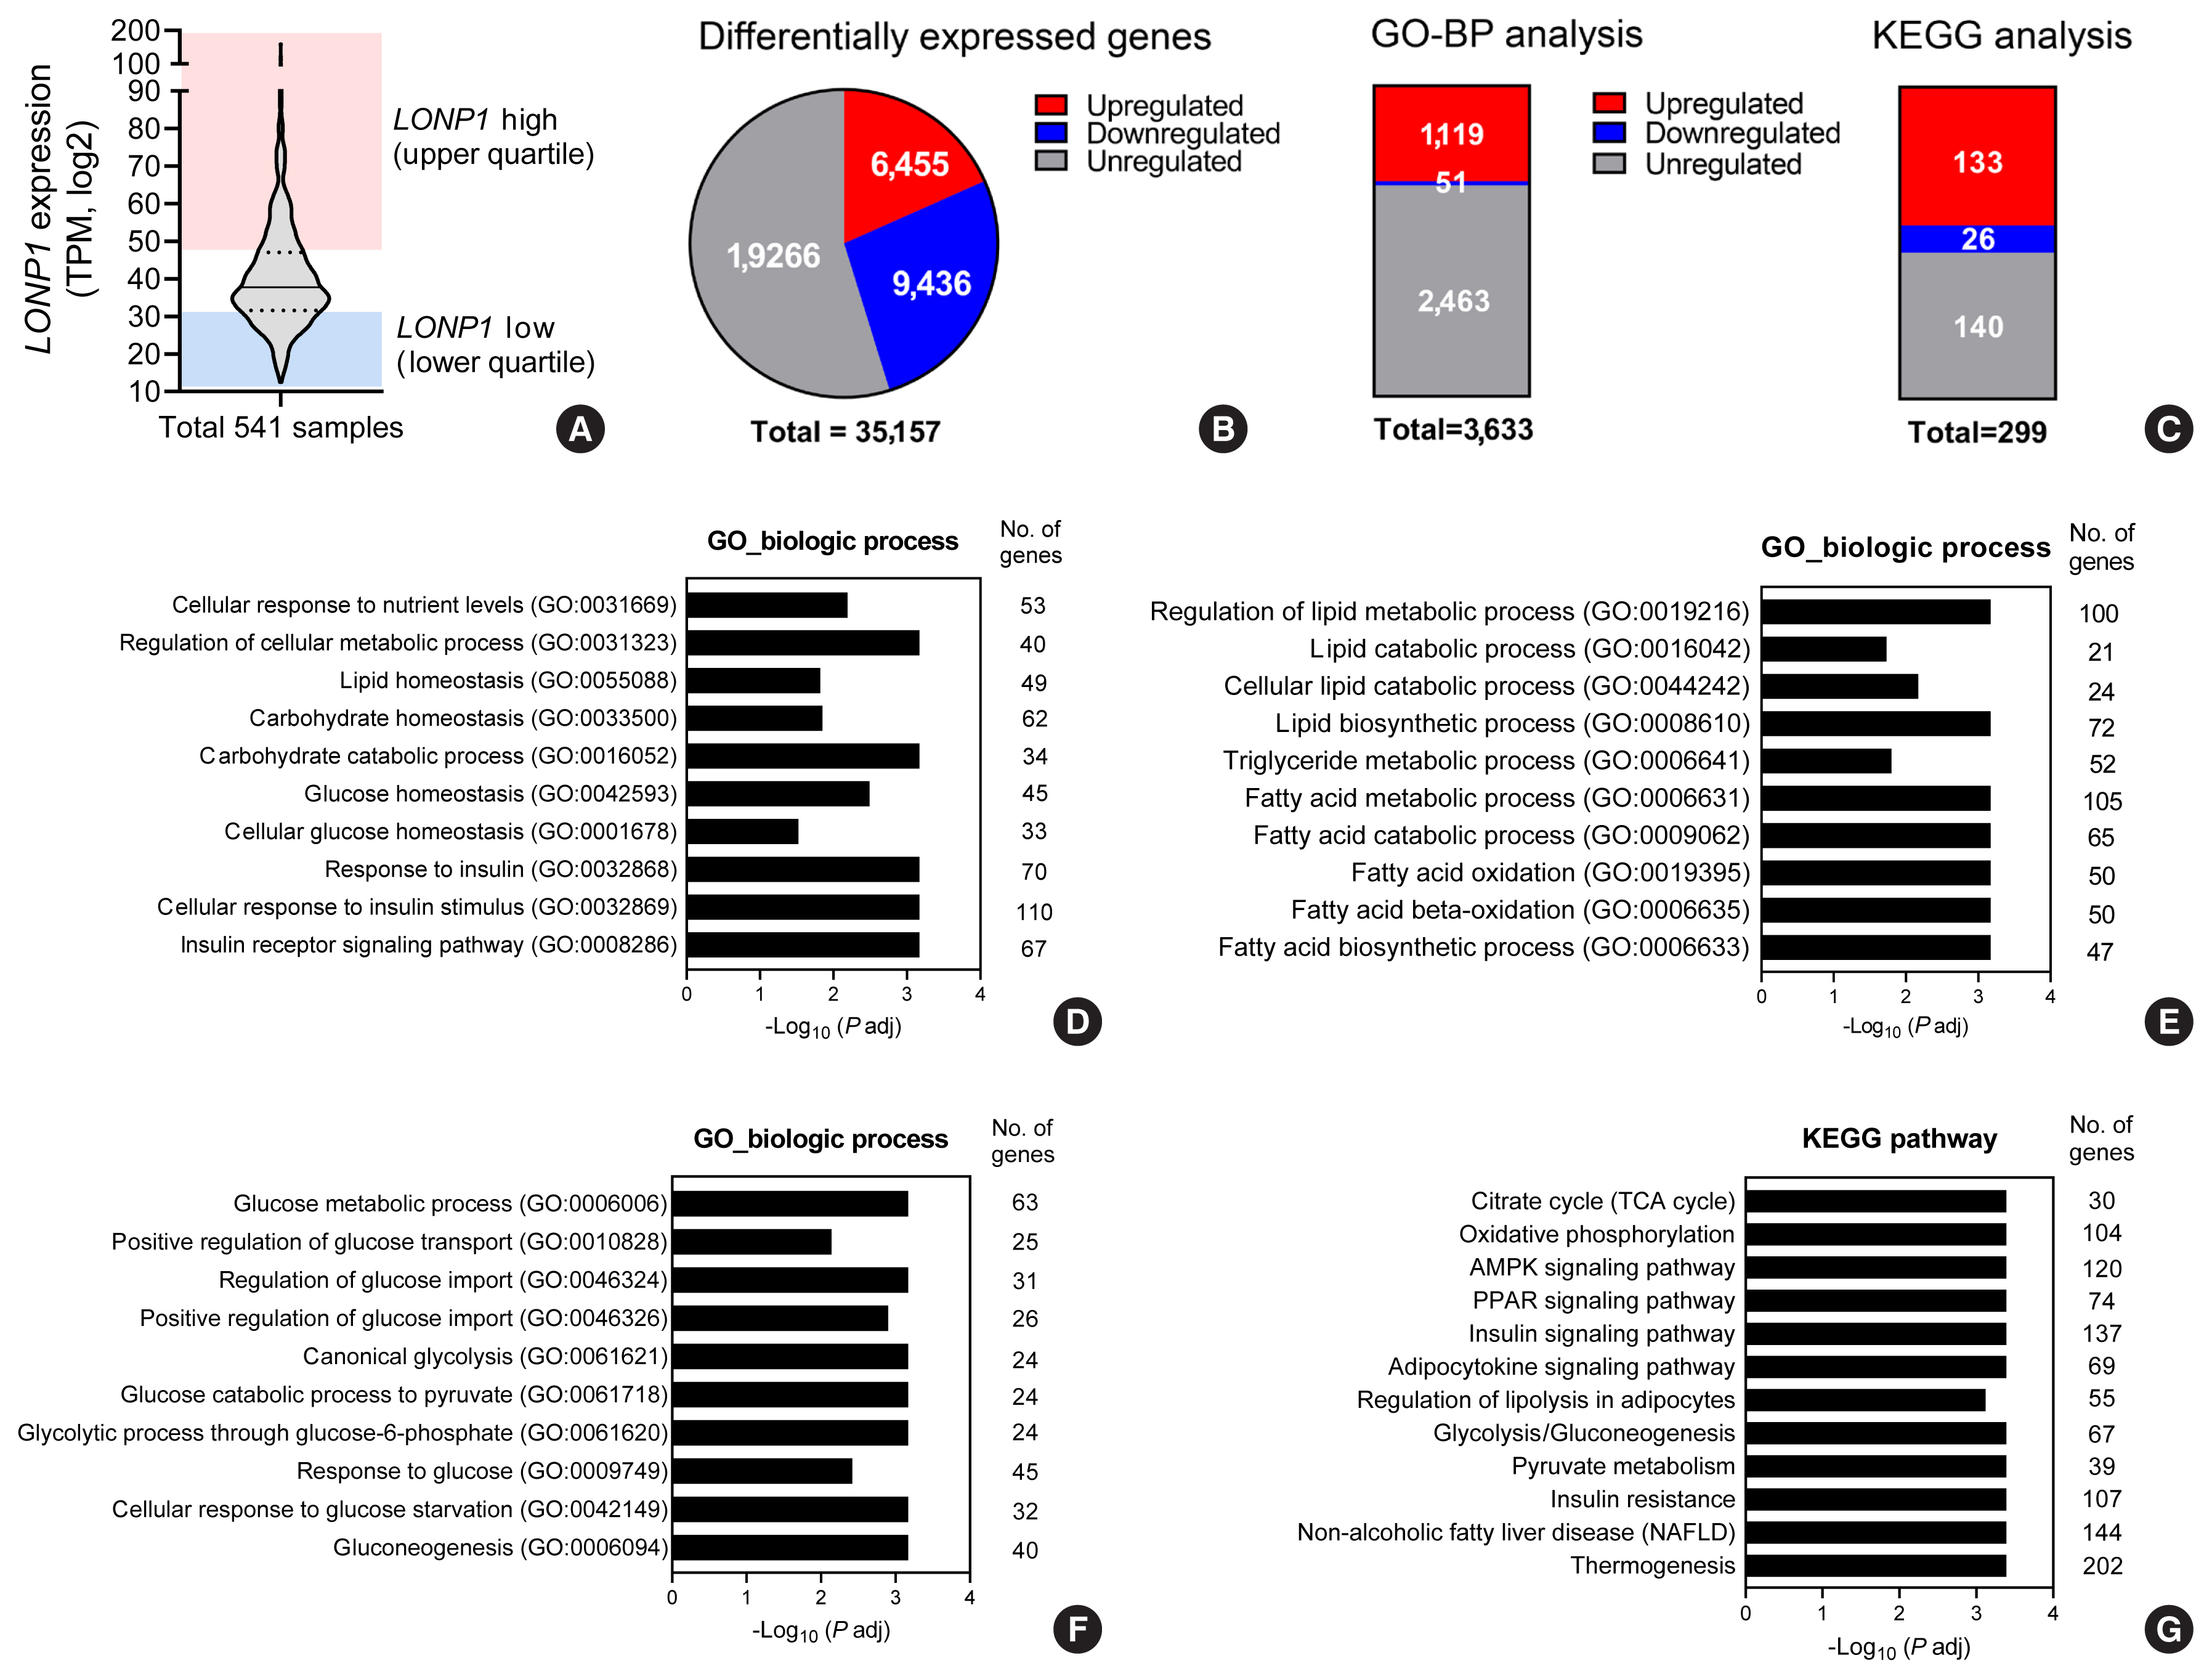
Fig. 3 Upregulation of physiological pathways in visceral adipose tissue with high expression of Lon protease homolog, mitochondrial (LONP1) in the Genotype-Tissue Expression Database. (A) LONP1 expression levels in 541 human visceral adipose tissue samples in the UCSC database. (B) Numbers of differentially expressed genes in a comparison of the samples in the highest quartile for LONP1 expression (n=134) and those in the lowest quartile (n=134). (C) Association of differential LONP1 expression with Gene Ontology (GO) biological processes (GO-BP) and Kyoto Encyclopedia of Genes and Genomes (KEGG) pathways. (D, E, F, G) Upregulated biological processes in the GO annotation or KEGG pathway analysis. TPM, transcripts per million.
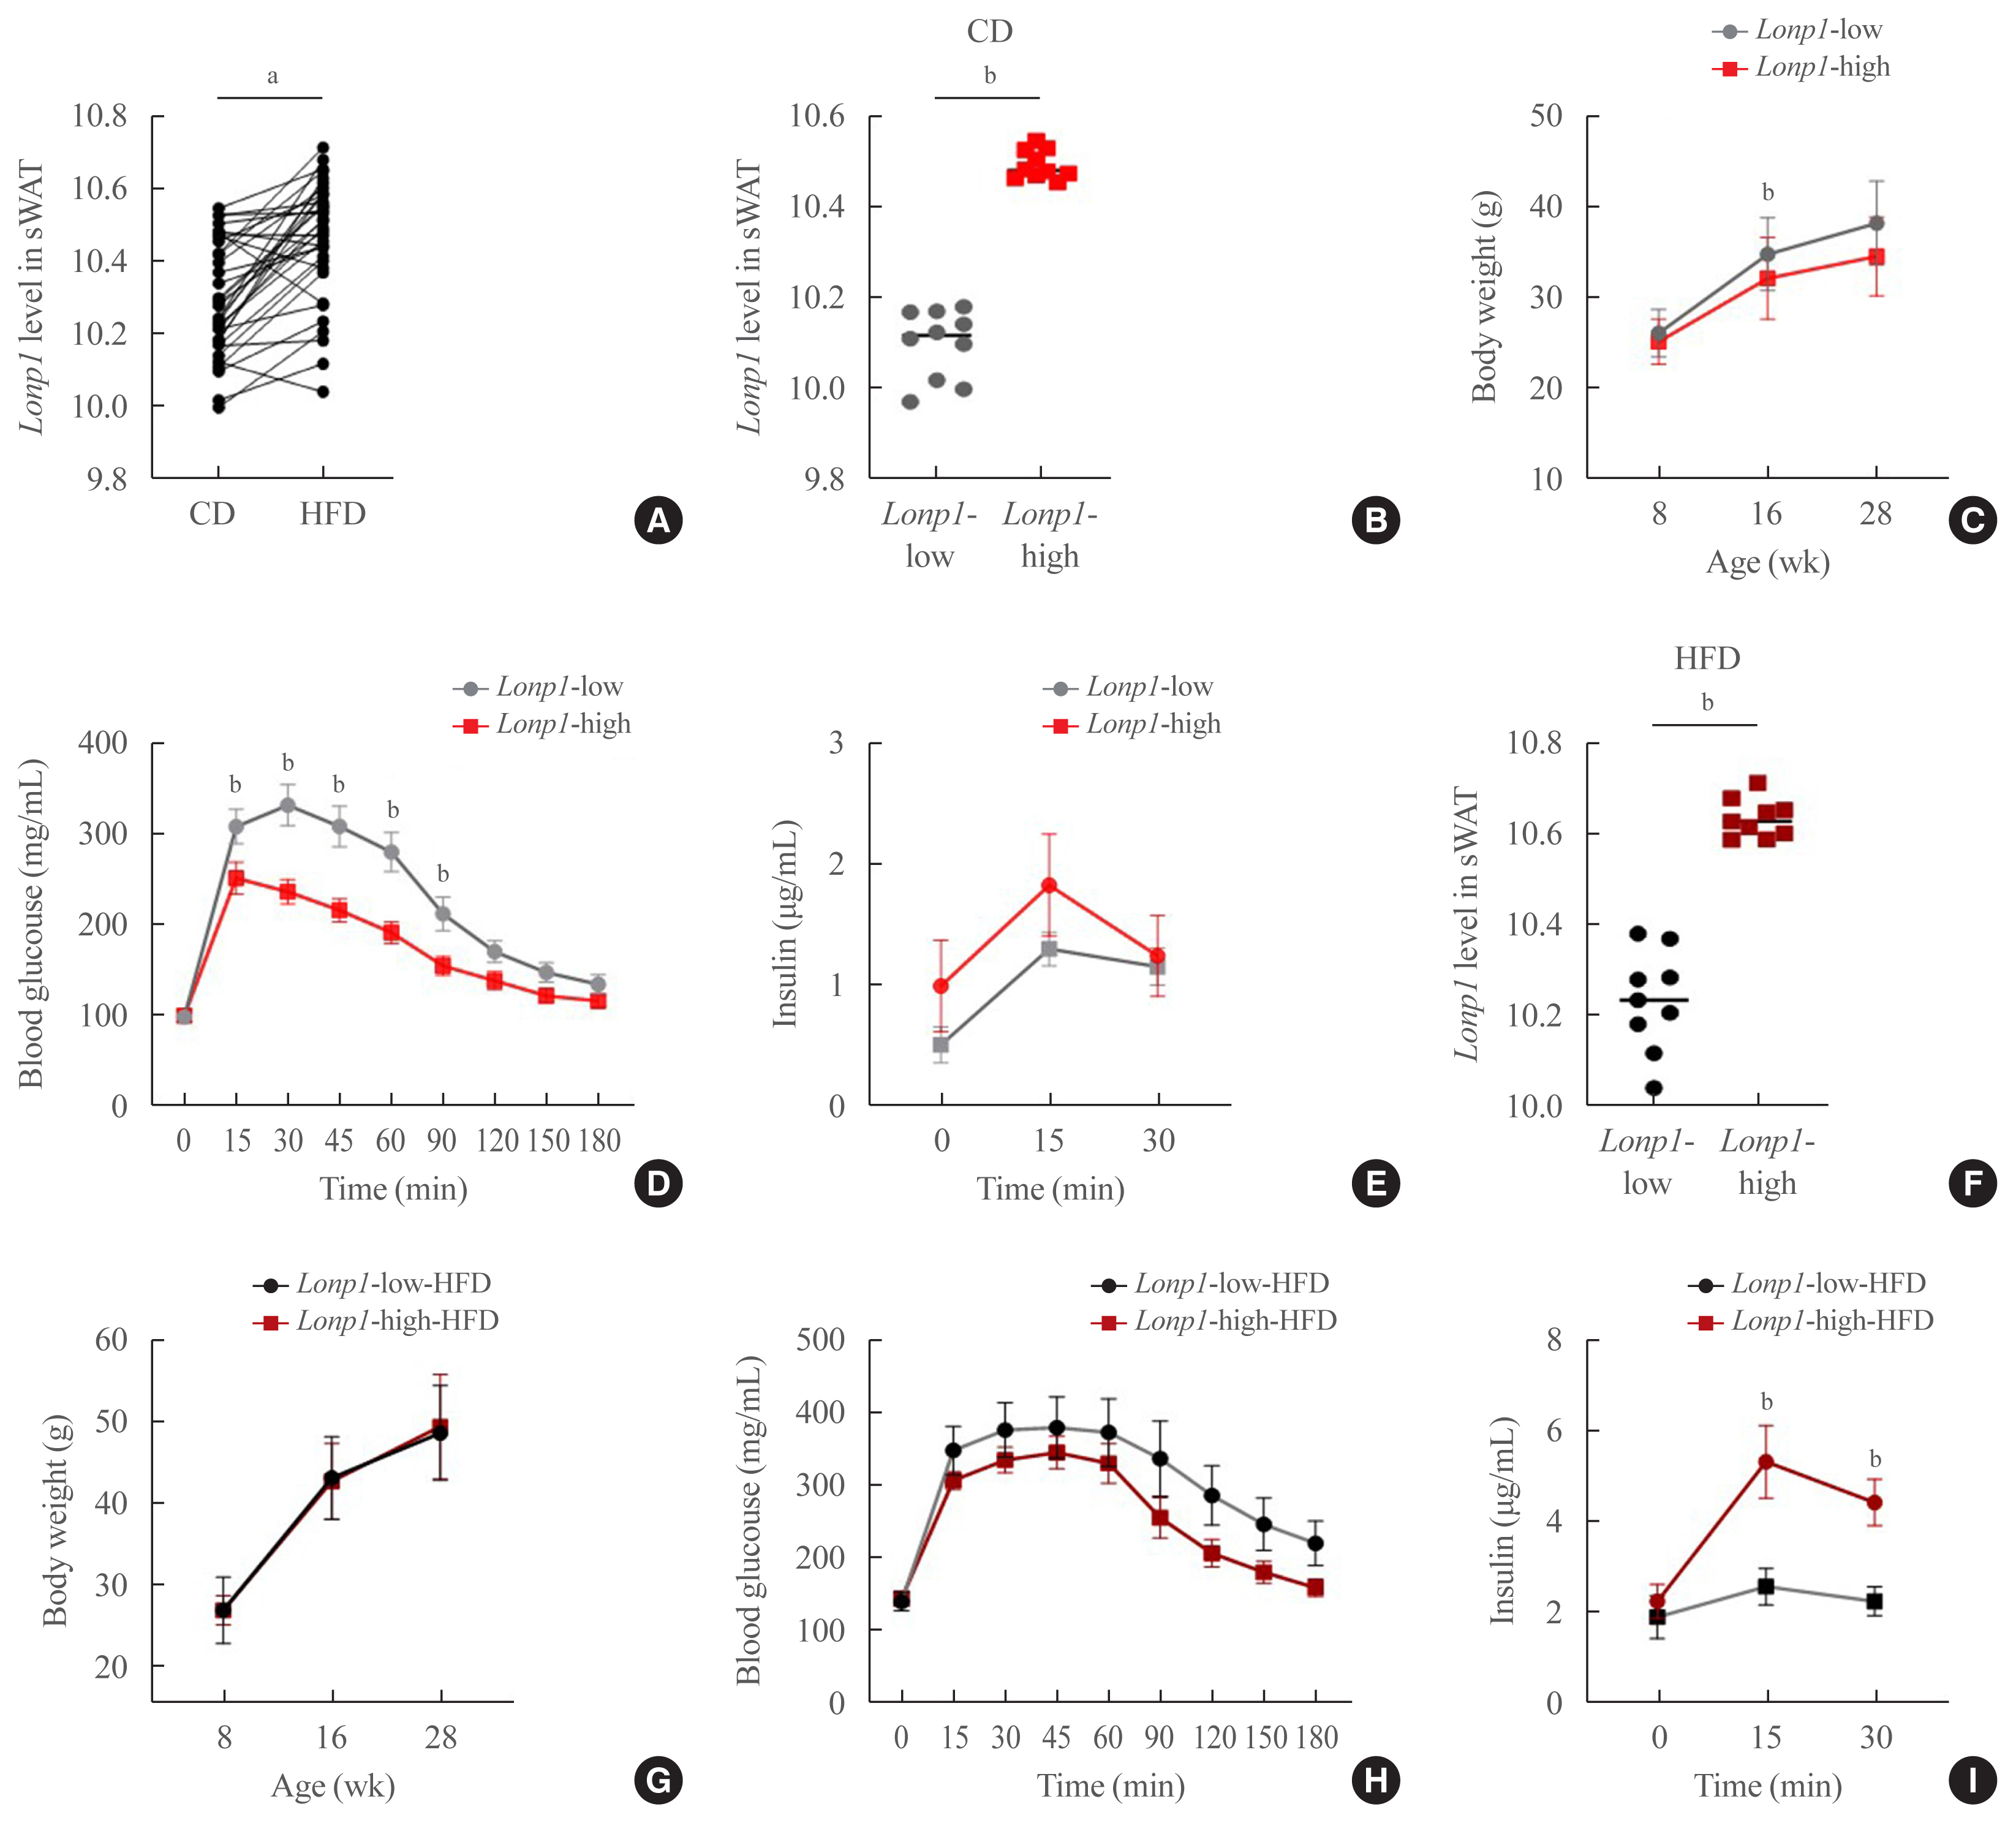
Fig. 4 Metabolic phenotypes in BXD mouse strains in relation to Lon protease homolog, mitochondrial (Lonp1) expression. (A) Lonp1 expression level in the subcutaneous white adipose tissue (sWAT) according to diet. (B) Comparison of lowest quartile (Lonp1-low) and highest quartile (Lonp1-high) of Lonp1 expression levels in the sWAT of BXD mouse strains with chow diet (CD). (C) Body weight change in BXD mice fed CD. Blood glucose (D) and insulin (E) were measured during the oral glucose-tolerance test (OGTT) in male mice at 17 weeks of age receiving CD. (F) Comparison of lowest quartile (Lonp1-low high-fat diet [HFD]) and highest quartile (Lonp1-high-HFD) of Lonp1 expression levels in the sWAT of BXD mouse strains with HFD. (G) Body weight change in BXD mice fed a HFD. Blood glucose (H) and insulin (I) measured during OGTT in male mice at 17 weeks of age receiving HFD. P values were calculated by t test. aP<0.001; bP<0.05.
Reference
-
1. Sun K, Kusminski CM, Scherer PE. Adipose tissue remodeling and obesity. J Clin Invest. 2011; 121:2094–101.
Article2. Kusminski CM, Scherer PE. Mitochondrial dysfunction in white adipose tissue. Trends Endocrinol Metab. 2012; 23:435–43.
Article3. Ozcan U, Cao Q, Yilmaz E, Lee AH, Iwakoshi NN, Ozdelen E, et al. Endoplasmic reticulum stress links obesity, insulin action, and type 2 diabetes. Science. 2004; 306:457–61.
Article4. Held NM, Houtkooper RH. Mitochondrial quality control pathways as determinants of metabolic health. Bioessays. 2015; 37:867–76.
Article5. Moehle EA, Shen K, Dillin A. Mitochondrial proteostasis in the context of cellular and organismal health and aging. J Biol Chem. 2019; 294:5396–407.
Article6. Melber A, Haynes CM. UPRmt regulation and output: a stress response mediated by mitochondrial-nuclear communication. Cell Res. 2018; 28:281–95.
Article7. Mottis A, Jovaisaite V, Auwerx J. The mitochondrial unfolded protein response in mammalian physiology. Mamm Genome. 2014; 25:424–33.
Article8. Jovaisaite V, Mouchiroud L, Auwerx J. The mitochondrial unfolded protein response, a conserved stress response pathway with implications in health and disease. J Exp Biol. 2014; 217(Pt 1):137–43.
Article9. Lee JH, Kim JM, Choi MJ, Kang YE, Joung KH, Yi HS, et al. Clinical implications of UCP1 mRNA expression in human cervical adipose tissue under physiological conditions. Obesity (Silver Spring). 2018; 26:1008–16.10. Kang YE, Kim JM, Joung KH, Lee JH, You BR, Choi MJ, et al. The roles of adipokines, proinflammatory cytokines, and adipose tissue macrophages in obesity-associated insulin resistance in modest obesity and early metabolic dysfunction. PLoS One. 2016; 11:e0154003.
Article11. Venegas V, Halberg MC. Measurement of mitochondrial DNA copy number. Methods Mol Biol. 2012; 837:327–35.
Article12. Love MI, Huber W, Anders S. Moderated estimation of fold change and dispersion for RNA-seq data with DESeq2. Genome Biol. 2014; 15:550.
Article13. Andreux PA, Williams EG, Koutnikova H, Houtkooper RH, Champy MF, Henry H, et al. Systems genetics of metabolism: the use of the BXD murine reference panel for multiscalar integration of traits. Cell. 2012; 150:1287–99.
Article14. Williams EG, Wu Y, Jha P, Dubuis S, Blattmann P, Argmann CA, et al. Systems proteomics of liver mitochondria function. Science. 2016; 352:aad0189.
Article15. Wu Y, Williams EG, Dubuis S, Mottis A, Jovaisaite V, Houten SM, et al. Multilayered genetic and omics dissection of mitochondrial activity in a mouse reference population. Cell. 2014; 158:1415–30.
Article16. World Health Organization. The Asia-Pacific perspective: redefining obesity and its treatment. Geneva: World Health Organization Western Pacific Regional Office;2000.17. Liesa M, Shirihai OS. Mitochondrial dynamics in the regulation of nutrient utilization and energy expenditure. Cell Metab. 2013; 17:491–506.
Article18. Yi HS, Chang JY, Shong M. The mitochondrial unfolded protein response and mitohormesis: a perspective on metabolic diseases. J Mol Endocrinol. 2018; 61:R91–105.
Article19. Choi MJ, Jung SB, Lee SE, Kang SG, Lee JH, Ryu MJ, et al. An adipocyte-specific defect in oxidative phosphorylation increases systemic energy expenditure and protects against diet-induced obesity in mouse models. Diabetologia. 2020; 63:837–52.
Article20. Chung HK, Ryu D, Kim KS, Chang JY, Kim YK, Yi HS, et al. Growth differentiation factor 15 is a myomitokine governing systemic energy homeostasis. J Cell Biol. 2017; 216:149–65.
Article21. Nolden M, Ehses S, Koppen M, Bernacchia A, Rugarli EI, Langer T. The m-AAA protease defective in hereditary spastic paraplegia controls ribosome assembly in mitochondria. Cell. 2005; 123:277–89.
Article22. Zurita Rendon O, Shoubridge EA. LONP1 is required for maturation of a subset of mitochondrial proteins, and its loss elicits an integrated stress response. Mol Cell Biol. 2018; 38:e00412–17.
Article23. Lee HJ, Chung K, Lee H, Lee K, Lim JH, Song J. Downregulation of mitochondrial lon protease impairs mitochondrial function and causes hepatic insulin resistance in human liver SK-HEP-1 cells. Diabetologia. 2011; 54:1437–46.
Article24. Heinonen S, Buzkova J, Muniandy M, Kaksonen R, Ollikainen M, Ismail K, et al. Impaired mitochondrial biogenesis in adipose tissue in acquired obesity. Diabetes. 2015; 64:3135–45.
Article25. Dahlman I, Forsgren M, Sjogren A, Nordstrom EA, Kaaman M, Naslund E, et al. Downregulation of electron transport chain genes in visceral adipose tissue in type 2 diabetes independent of obesity and possibly involving tumor necrosis factor-alpha. Diabetes. 2006; 55:1792–9.26. Qatanani M, Tan Y, Dobrin R, Greenawalt DM, Hu G, Zhao W, et al. Inverse regulation of inflammation and mitochondrial function in adipose tissue defines extreme insulin sensitivity in morbidly obese patients. Diabetes. 2013; 62:855–63.
Article27. Yin X, Lanza IR, Swain JM, Sarr MG, Nair KS, Jensen MD. Adipocyte mitochondrial function is reduced in human obesity independent of fat cell size. J Clin Endocrinol Metab. 2014; 99:E209–16.
Article28. Wajchenberg BL. Subcutaneous and visceral adipose tissue: their relation to the metabolic syndrome. Endocr Rev. 2000; 21:697–738.
Article
- Full Text Links
-
- Actions
-
Cited
- CITED
-
- Close
- Share
-
- Similar articles
-
- Impact of Obesity-Related Inflammation on Cardiac Metabolism and Function
- Connecting Myokines and Metabolism
- Surgical removal of visceral fat decreases plasma free fatty acid and increases insulin sensitivity on liver and peripheral tissue in monosodium glutamate (MSG)-obese rats
- Brown Fat and Browning for the Treatment of Obesity and Related Metabolic Disorders
- Inflammation and Insulin Resistance: An Old Story with New Ideas
