Assessment of Blood Clot Composition by Spectral Optical Coherence Tomography: An In Vitro Study
- Affiliations
-
- 1Neuroradiology Research Laboratory, Department of Radiology, Mayo Clinic, Rochester, MN, USA
- KMID: 2513340
- DOI: http://doi.org/10.5469/neuroint.2020.00297
Abstract
- Purpose
Optical coherence tomography (OCT) has the potential for in vivo clot composition characterization in difficult mechanical embolectomy cases. We performed an in vitro study to determine the OCT characteristics of red blood cells (RBCs) and fibrin rich clots.
Materials and Methods
Analogues of 5 compositions of clots (5% to 95% RBCs from Group A to E) were created from human blood. The blood mixture was injected into the bifurcation of a 3D printed bifurcated silicone tube. The OPTISTM Integrated System (St. Jude Medical Inc.) was used to identify the magnitude of OCT signals from different compositions of clots. Martius Scarlett Blue trichrome (MSB) staining was performed to confirm the composition of RBCs and fibrin in each clot.
Results
Group A and B showed less signal attenuation (less than 30%) from its surface to the inside, which indicated high penetration (low-back scattering). Group C indicated intermediate signal attenuation (60%) from its surface to inside the clots, in which signals were found even at the periphery of the clot. Group D and E were superficially signal rich with more signal attenuation (more than 80%) from its surface to the inside indicating low penetration (high-back scattering). Signal-free shadowing was shown in 3 clots in Group E. MSB staining indicated color change (from red in fibrin-rich clots to yellow in RBC-rich clots).
Conclusion
Different compositions of clots can be assessed using OCT. Fibrin-rich clots have homogeneous signals with high penetration, while RBC-rich clots can be recognized as superficially signal rich with low penetration.
Figure
-
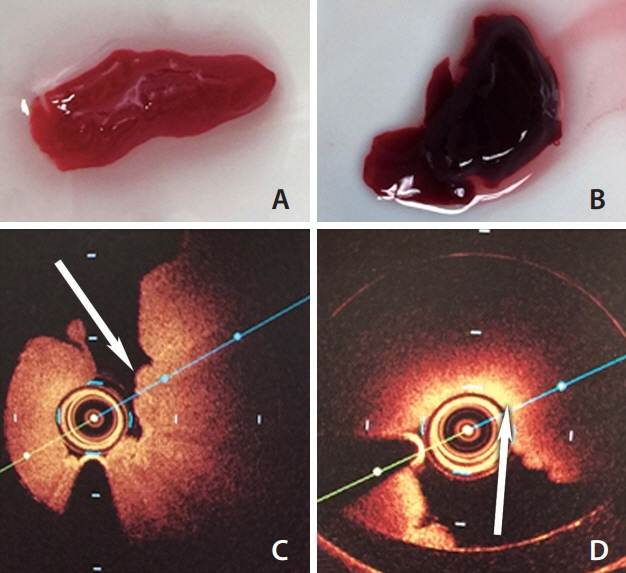
Fig. 1. (A) Fibrin-rich clot (25% RBC); (B) RBC-rich clot (95% RBC); (C) OCT image from (A) showing less signal attenuation from the surface (white arrow); (D) OCT image from (B) showing more serious attenuation (white arrow). RBC, red blood cell; OCT, optical coherence tomography.
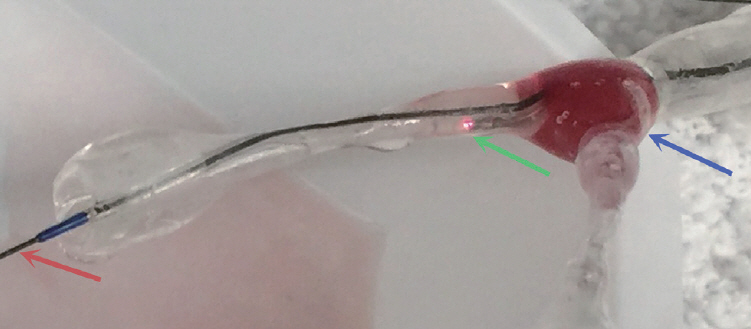
Fig. 2. Showing clot location (blue arrow), a high-resolution camera inside the OCT catheter (green arrow), and catheter advancement over the microguidewire (red arrow). OCT, optical coherence tomography.
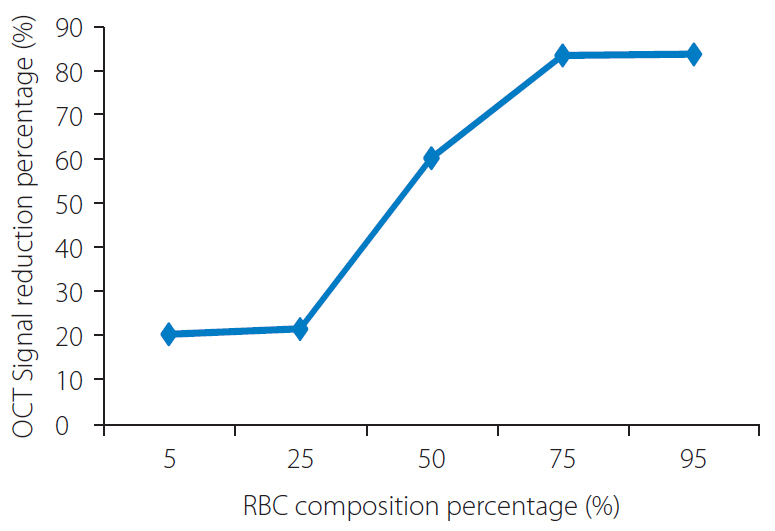
Fig. 3. Correlation between RBC composition and OCT signal reduction. RBC, red blood cell; OCT, optical coherence tomography.
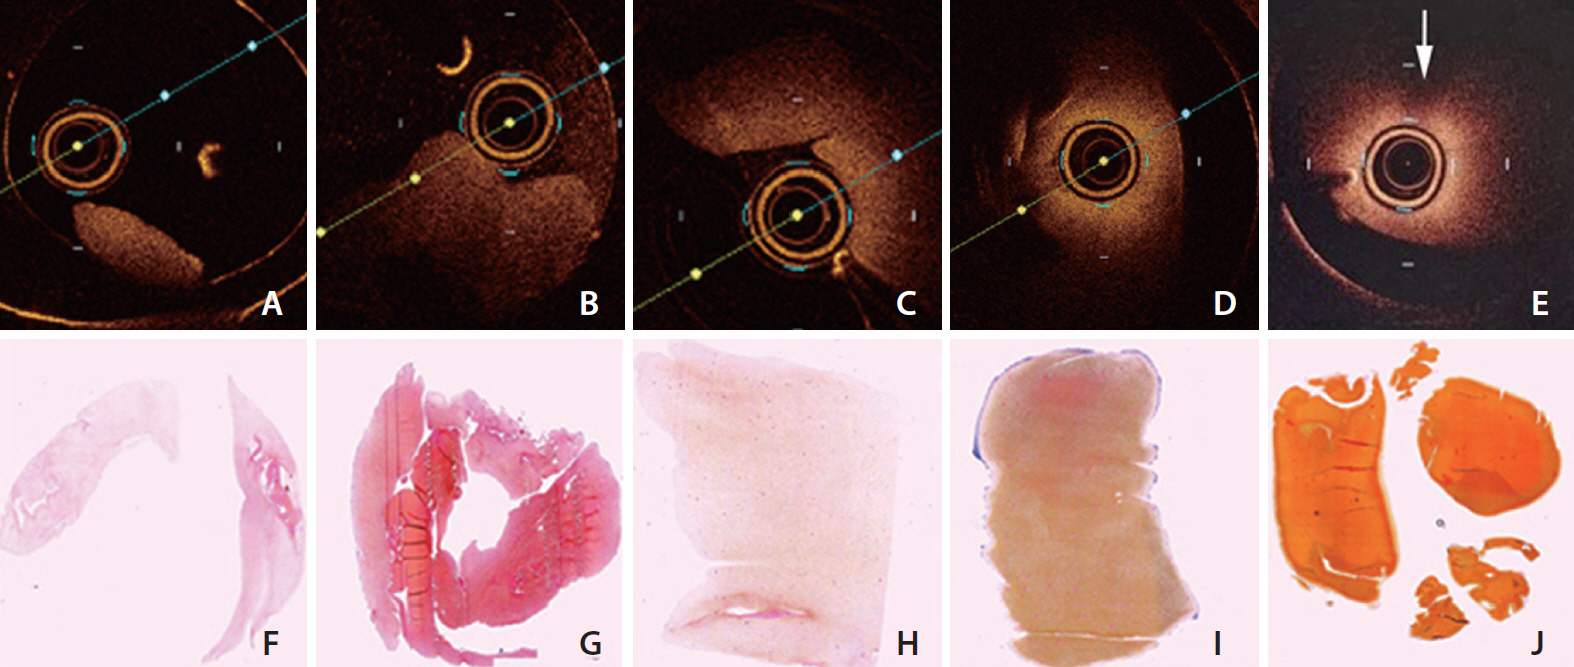
Fig. 4. Representative OCT images of different types of clots. (A) 5% RBC rich; (B) 25% RBC rich; (C) 50% RBC rich; (D) 75% RBC rich; (E) 95% RBC rich. Signal attenuation is increased from (A) (low-backscattering) to (E) (high-backscattering). Signal-free shadowing is shown in 95% RBC-rich clot (white arrow in E). Representative histological images (F–J) of 5 types of clots (MSB staining, ×20); from left to right, the percentages of RBC were 14.4%, 31.7%, 49.3%, 77.1%, and 95.4%, respectively. The color of the clot area changes from light red to dark yellow. RBC, red blood cell; OCT, optical coherence tomography; MSB, Martius Scarlett Blue trichrome.
Reference
-
1. Bezerra HG, Costa MA, Guagliumi G, Rollins AM, Simon DI. Intracoronary optical coherence tomography: a comprehensive review clinical and research applications. JACC Cardiovasc Interv. 2009; 2:1035–1046.2. Kume T, Akasaka T, Kawamoto T, Ogasawara Y, Watanabe N, Toyota E, et al. Assessment of coronary arterial thrombus by optical coherence tomography. Am J Cardiol. 2006; 97:1713–1717.
Article3. Turk AS 3rd, Siddiqui A, Fifi JT, De Leacy RA, Fiorella DJ, Gu E, et al. Aspiration thrombectomy versus stent retriever thrombectomy as first-line approach for large vessel occlusion (COMPASS): a multicentre, randomised, open label, blinded outcome, non-inferiority trial. Lancet. 2019; 393:998–1008.
Article4. Turc G, Kim AS. First-line use of contact aspiration or stent retriever thrombectomy for large vessel occlusion stroke. Stroke. 2019; 50:2634–2636.
Article5. Fitzgerald S, Wang S, Dai D, Murphree DH Jr, Pandit A, Douglas A, et al. Orbit image analysis machine learning software can be used for the histological quantification of acute ischemic stroke blood clots. PLoS One. 2019; 14:e0225841.
Article6. Roleder T, Jąkała J, Kałuża GL, Partyka Ł, Proniewska K, Pociask E, et al. The basics of intravascular optical coherence tomography. Postepy Kardiol Interwencyjnej. 2015; 11:74–83.
Article7. Shin JW, Jeong HS, Kwon HJ, Song KS, Kim J. High red blood cell composition in clots is associated with successful recanalization during intra-arterial thrombectomy. PLoS One. 2018; 13:e0197492.
Article8. Fennell VS, Setlur Nagesh SV, Meess KM, Gutierrez L, James RH, Springer ME, et al. What to do about fibrin rich ‘tough clots’? Comparing the Solitaire stent retriever with a novel geometric clot extractor in an in vitro stroke model. J Neurointerv Surg. 2018; 10:907–910.9. Gounis MJ, Ughi GJ, Marosfoi M, Lopes DKL, Fiorella D, Bezerra HG, et al. Intravascular optical coherence tomography for neurointerventional surgery. Stroke. 2019; 50:218–223.
Article
- Full Text Links
-
- Actions
-
Cited
- CITED
-
- Close
- Share
-
- Similar articles
-
- A Case of Ocular Toxoplasmosis Imaged with Spectral Domain Optical Coherence Tomography
- Fundus Autofluorescence, Fluorescein Angiography and Spectral Domain Optical Coherence Tomography Findings of Retinal Astrocytic Hamartomas in Tuberous Sclerosis
- A Case of Retinal Cavernous Hemangioma Diagnosed with Spectral Domain Optical Coherence Tomography
- Macular Thickness Changes with Age and Gender in Emmetropia Using Spectral Domain Optical Coherence Tomography
- Choroidal Thickness at the Outside of Fovea in Diabetic Retinopathy Using Spectral-Domain Optical Coherence Tomography
