Magnetic Resonance-Based Texture Analysis Differentiating KRAS Mutation Status in Rectal Cancer
- Affiliations
-
- 1Innovative Medical Engineering & Technology, Research Institute and Hospital, National Cancer Center, Goyang, Korea
- 2Center for Colorectal Cancer, Research Institute and Hospital, National Cancer Center, Goyang, Korea
- KMID: 2501201
- DOI: http://doi.org/10.4143/crt.2019.050
Abstract
- Purpose
Mutation of the Kirsten Ras (KRAS) oncogene is present in 30%-40% of colorectal cancers and has prognostic significance in rectal cancer. In this study, we examined the ability of radiomics features extracted from T2-weighted magnetic resonance (MR) images to differentiate between tumors with mutant KRAS and wild-type KRAS.
Materials and Methods
Sixty patients with primary rectal cancer (25 with mutant KRAS, 35 with wild-type KRAS) were retrospectively enrolled. Texture analysis was performed in all regions of interest on MR images, which were manually segmented by two independent radiologists. We identified potentially useful imaging features using the two-tailed t test and used them to build a discriminant model with a decision tree to estimate whether KRAS mutation had occurred.
Results
Three radiomic features were significantly associated with KRASmutational status (p < 0.05). The mean (and standard deviation) skewness with gradient filter value was significantly higher in the mutant KRAS group than in the wild-type group (2.04±0.94 vs. 1.59±0.69). Higher standard deviations for medium texture (SSF3 and SSF4) were able to differentiate mutant KRAS (139.81±44.19 and 267.12±89.75, respectively) and wild-type KRAS (114.55±29.30 and 224.78±62.20). The final decision tree comprised three decision nodes and four terminal nodes, two of which designated KRAS mutation. The sensitivity, specificity, and accuracy of the decision tree was 84%, 80%, and 81.7%, respectively.
Conclusion
Using MR-based texture analysis, we identified three imaging features that could differentiate mutant from wild-type KRAS. T2-weighted images could be used to predict KRAS mutation status preoperatively in patients with rectal cancer.
Figure
-

Fig. 1. Diagram showing the flow of patients through the study. MR, magnetic resonance.

Fig. 2. Example of segmentation of rectal cancer in T2-weighted magnetic resonance images. (A) Original image. (B, C) Segmentation by two experienced radiologists. (D) Ground truth tumor image showing the area of overlap between the two readers.
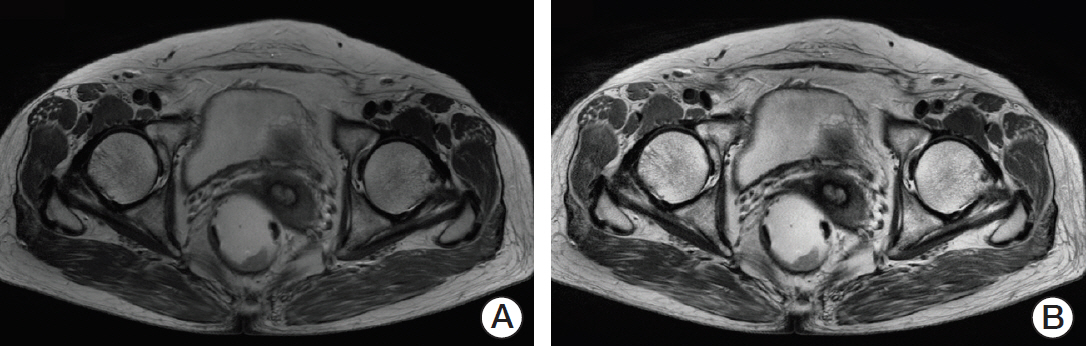
Fig. 3. Examples of preprocessing images. (A) An original image. (B) A preprocessed image.
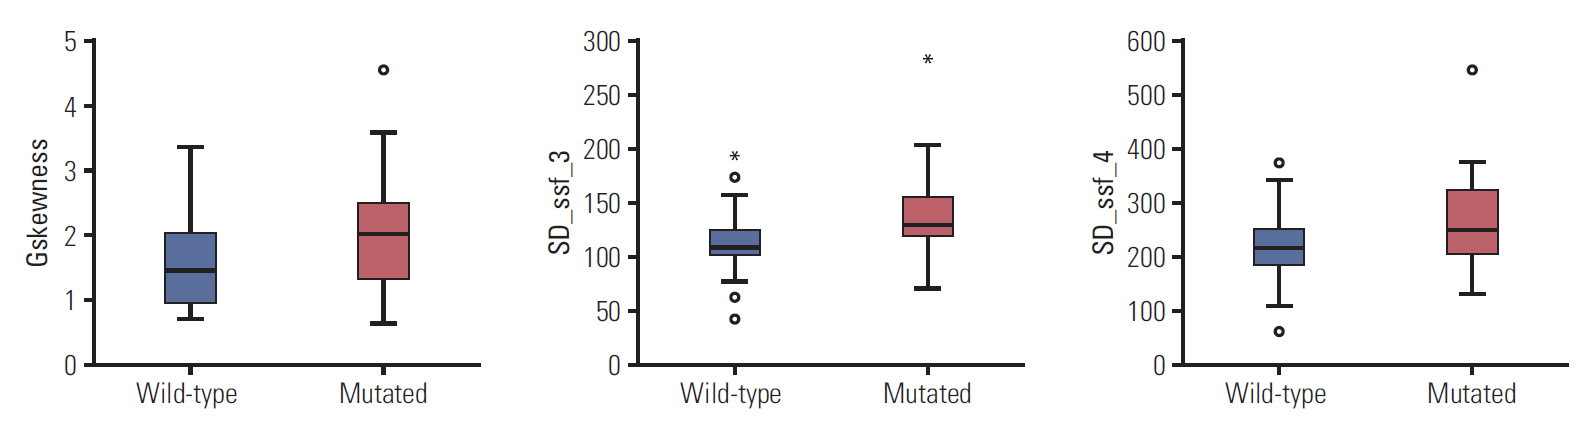
Fig. 4. A box plot comparing the distribution of wild-type KRAS with that of mutant KRAS. The central line in the box plot indicates the median value of the data. The lower and upper boundary lines of the central box represent the 25% and 75% quartiles. The box indicates the 95% confidence interval.
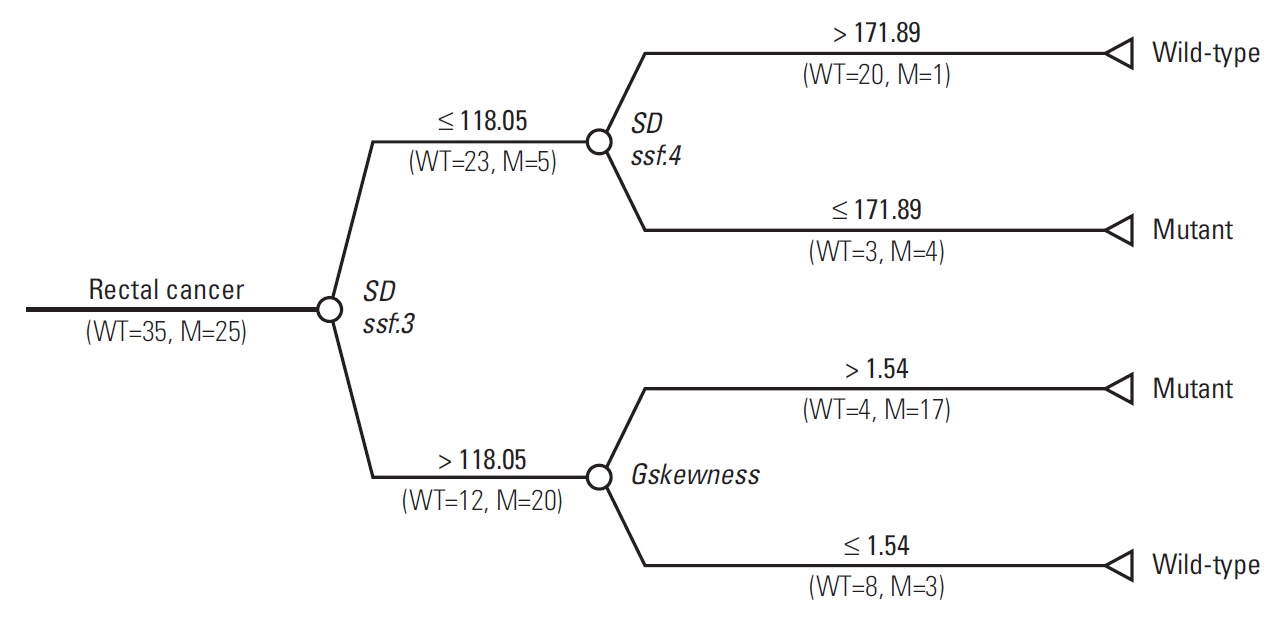
Fig. 5. Decision tree for identification of KRAS mutations in patients with rectal cancer using T2-weighted magnetic resonance imaging features. M, number of tumors with mutant KRAS; WT, number of tumors with wild-type KRAS; SD, standard deviation; ssf, spatial scale factor.
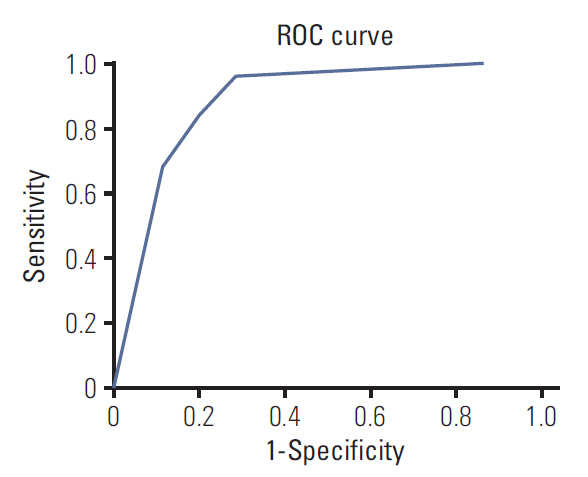
Fig. 6. Receiver-operating characteristic (ROC) curve showing the performance of the decision tree model. The area under the curve is 0.884.
Reference
-
References
1. Derbel O, Wang Q, Desseigne F, Rivoire M, Meeus P, Peyrat P, et al. Impact of KRAS, BRAF and PI3KCA mutations in rectal carcinomas treated with neoadjuvant radiochemotherapy and surgery. BMC Cancer. 2013; 13:200.
Article2. Karapetis CS, Khambata-Ford S, Jonker DJ, O'Callaghan CJ, Tu D, Tebbutt NC, et al. K-ras mutations and benefit from cetuximab in advanced colorectal cancer. N Engl J Med. 2008; 359:1757–65.3. Dinapoli N, Casa C, Barbaro B, Chiloiro GV, Damiani A, Di Matteo M, et al. Radiomics for rectal cancer. Transl Cancer Res. 2016; 5:424–31.
Article4. Liu Z, Zhang XY, Shi YJ, Wang L, Zhu HT, Tang Z, et al. Radiomics analysis for evaluation of pathological complete response to neoadjuvant chemoradiotherapy in locally advanced rectal cancer. Clin Cancer Res. 2017; 23:7253–62.
Article5. Wu J, Tha KK, Xing L, Li R. Radiomics and radiogenomics for precision radiotherapy. J Radiat Res. 2018; 59:i25–31.
Article6. Nie K, Shi L, Chen Q, Hu X, Jabbour SK, Yue N, et al. Rectal cancer: assessment of neoadjuvant chemoradiation outcome based on radiomics of multiparametric MRI. Clin Cancer Res. 2016; 22:5256–64.
Article7. De Cecco CN, Ganeshan B, Ciolina M, Rengo M, Meinel FG, Musio D, et al. Texture analysis as imaging biomarker of tumoral response to neoadjuvant chemoradiotherapy in rectal cancer patients studied with 3-T magnetic resonance. Invest Radiol. 2015; 50:239–45.
Article8. Giannini V, Mazzetti S, Bertotto I, Chiarenza C, Cauda S, Delmastro E, et al. Predicting locally advanced rectal cancer response to neoadjuvant therapy with (18)F-FDG PET and MRI radiomics features. Eur J Nucl Med Mol Imaging. 2019; 46:878–88.
Article9. Horvat N, Veeraraghavan H, Khan M, Blazic I, Zheng J, Capanu M, et al. MR imaging of rectal cancer: radiomics analysis to assess treatment response after neoadjuvant therapy. Radiology. 2018; 287:833–43.
Article10. Dinapoli N, Barbaro B, Gatta R, Chiloiro G, Casa C, Masciocchi C, et al. Magnetic resonance, vendor-independent, intensity histogram analysis predicting pathologic complete response after radiochemotherapy of rectal cancer. Int J Radiat Oncol Biol Phys. 2018; 102:765–74.
Article11. Miles KA, Ganeshan B, Rodriguez-Justo M, Goh VJ, Ziauddin Z, Engledow A, et al. Multifunctional imaging signature for V-KI-RAS2 Kirsten rat sarcoma viral oncogene homolog (KRAS) mutations in colorectal cancer. J Nucl Med. 2014; 55:386–91.
Article12. Yang L, Dong D, Fang M, Zhu Y, Zang Y, Liu Z, et al. Can CT-based radiomics signature predict KRAS/NRAS/BRAF mutations in colorectal cancer? Eur Radiol. 2018; 28:2058–67.
Article13. Kawada K, Toda K, Nakamoto Y, Iwamoto M, Hatano E, Chen F, et al. Relationship between 18F-FDG PET/CT scans and KRAS mutations in metastatic colorectal cancer. J Nucl Med. 2015; 56:1322–7.
Article14. Sun Y, Hu P, Wang J, Shen L, Xia F, Qing G, et al. Radiomic features of pretreatment MRI could identify T stage in patients with rectal cancer: Preliminary findings. J Magn Reson Imaging. 2018; 48:615–21.
Article15. Srivaramangai R, Hiremath PS, Patil AS. Preprocessing MRI images of colorectal cancer. Int J Comput Sci Issues. 2017; 14:48.16. Zuiderveld K. Contrast limited adaptive histogram equalization. In : Heckbert PS, editor. Graphics Gems IV. San Diego, CA: Academic Press Professional, Inc;1994. p. 474–85.17. Ghose S, Mitra J, Oliver A, Marti R, Llado X, Freixenet J, et al. A random forest based classification approach to prostate segmentation in MRI. In : MICCAI Grand Challenge: Prostate MR Image Segmentation; 2012 Oct 1; Nice, France.18. Szczypinski PM, Strzelecki M, Materka A, Klepaczko A. MaZda: a software package for image texture analysis. Comput Methods Programs Biomed. 2009; 94:66–76.19. Materka A, Strzelecki M, Lerski R, Schad L. Feature evaluation of texture test objects for magnetic resonance imaging. In : Pietikainen MK, editor. Texture analysis in machine vision. Hackensack, NJ: World Scientific Publishing Co., Inc;2000. p. 197–206.20. Miles KA, Ganeshan B, Hayball MP. CT texture analysis using the filtration-histogram method: what do the measurements mean? Cancer Imaging. 2013; 13:400–6.
Article21. Weiss GJ, Ganeshan B, Miles KA, Campbell DH, Cheung PY, Frank S, et al. Noninvasive image texture analysis differentiates K-ras mutation from pan-wildtype NSCLC and is prognostic. PLoS One. 2014; 9:e100244.
Article22. Chaddad A, Desrosiers C, Bouridane A, Toews M, Hassan L, Tanougast C. Multi texture analysis of colorectal cancer continuum using multispectral imagery. PLoS One. 2016; 11:e0149893.
Article23. Haralick RM, Shanmugam KS, Dinstein I. Textural features for image classification. IEEE Trans Syst Man Cybern. 1973; SMC3:610–21.
Article24. Sachdeva J, Kumar V, Gupta I, Khandelwal N, Ahuja CK. Segmentation, feature extraction, and multiclass brain tumor classification. J Digit Imaging. 2013; 26:1141–50.
Article25. Ozturk S, Akdemir B. Application of feature extraction and classification methods for histopathological image using GLCM, LBP, LBGLCM, GLRLM and SFTA. Procedia Comput Sci. 2018; 132:40–6.26. Galloway MM. Texture analysis using gray level run lengths. Comput Graph Image Process. 1975; 4:172–9.
Article27. Karahaliou A, Skiadopoulos S, Boniatis I, Sakellaropoulos P, Likaki E, Panayiotakis G, et al. Texture analysis of tissue surrounding microcalcifications on mammograms for breast cancer diagnosis. Br J Radiol. 2007; 80:648–56.
Article28. Krishnan KR, Sudhakar R. Automatic classification of liver diseases from ultrasound images using GLRLM texture features. In : Balas V, Fodor J, Varkonyi-Koczy A, Dombi J, Jain L, editors. Soft computing applications. Advances in intelligent systems and computing, Vol. 195. Berlin: Springer;2013. p. 611–24.29. Fonarow GC, Adams KF Jr, Abraham WT, Yancy CW, Boscardin WJ; ADHERE Scientific Advisory Committee, Study Group, and Investigators. Risk stratification for in-hospital mortality in acutely decompensated heart failure: classification and regression tree analysis. JAMA. 2005; 293:572–80.
Article30. Meng X, Xia W, Xie P, Zhang R, Li W, Wang M, et al. Preoperative radiomic signature based on multiparametric magnetic resonance imaging for noninvasive evaluation of biological characteristics in rectal cancer. Eur Radiol. 2019; 29:3200–9.
Article31. Cui Y, Cui X, Yang X, Zhuo Z, Du X, Xin L, et al. Diffusion kurtosis imaging-derived histogram metrics for prediction of KRAS mutation in rectal adenocarcinoma: preliminary findings. J Magn Reson Imaging. 2019; 50:930–9.
Article32. Xu Y, Xu Q, Sun H, Liu T, Shi K, Wang W. Could IVIM and ADC help in predicting the KRAS status in patients with rectal cancer? Eur Radiol. 2018; 28:3059–65.
Article33. Yeo DM, Oh SN, Choi MH, Lee SH, Lee MA, Jung SE. Histogram analysis of perfusion parameters from dynamic contrast-enhanced MR imaging with tumor characteristics and therapeutic response in locally sdvanced tectal vancer. Biomed Res Int. 2018; 2018:3724393.34. Jeon SH, Song C, Chie EK, Kim B, Kim YH, Chang W, et al. Delta-radiomics signature predicts treatment outcomes after preoperative chemoradiotherapy and surgery in rectal cancer. Radiat Oncol. 2019; 14:43.
Article35. Lubner MG, Smith AD, Sandrasegaran K, Sahani DV, Pickhardt PJ. CT Texture analysis: definitions, applications, biologic correlates, and challenges. Radiographics. 2017; 37:1483–503.
Article36. Ganeshan B, Panayiotou E, Burnand K, Dizdarevic S, Miles K. Tumour heterogeneity in non-small cell lung carcinoma assessed by CT texture analysis: a potential marker of survival. Eur Radiol. 2012; 22:796–802.
Article37. Bashir U, Siddique MM, McLean E, Goh V, Cook GJ. Imaging heterogeneity in lung cancer: techniques, applications, and challenges. AJR Am J Roentgenol. 2016; 207:534–43.
Article38. Semenza GL. HIF-1 and tumor progression: pathophysiology and therapeutics. Trends Mol Med. 2002; 8(4 Suppl):S62–7.
Article
- Full Text Links
-
- Actions
-
Cited
- CITED
-
- Close
- Share
-
- Similar articles
-
- Association between Texture Analysis Parameters and Molecular Biologic KRAS Mutation in Non-Mucinous Rectal Cancer
- Impact of KRAS Mutation Status on Outcomes in Metastatic Colon Cancer Patients without Anti-Epidermal Growth Factor Receptor Therapy
- Dose KRAS Mutation Status Affect on the Effect of VEGF Therapy in Metastatic Colon Cancer Patients?
- Can Serum be Used for Analyzing the KRAS Mutation Status in Patients with Advanced Colorectal Cancer?
- KRAS Gâ‚â‚‚C mutation as a poor prognostic marker of pemetrexed treatment in non-small cell lung cancer
