Activation of Tyrosine Metabolism in CD13+ Cancer Stem Cells DrivesRelapse in Hepatocellular Carcinoma
- Affiliations
-
- 1Department of Oncology, Renji Hospital, School of Medicine, Shanghai Jiaotong University, Shanghai, China
- 2The Nursing Department, Shanghai Public Health Clinical Center, Shanghai, China
- 3The First Department of Infectious Diseases, Shanghai Public Health Clinical Center, Shanghai, China
- 4The Third Department of Infectious Diseases, Shanghai Public Health Clinical Center, Shanghai, China
- KMID: 2500345
- DOI: http://doi.org/10.4143/crt.2019.444
Abstract
- Purpose
Cancer stem cells (CSCs) are naturally resistant to chemotherapy, explaining why tumor relapse frequently occurs after initial regression upon administration of chemotherapeutic agents in most cases. A CSC population characterized by CD13 expression has been identified in hepatocellular carcinoma (HCC). In the current study, we aimed to clarify the molecular mechanism by which it escapes conventional therapies.
Materials and Methods
Here, we used flow cytometry to examine the percentage of CD13+ CSCs in HepG2 and HuH7 cells after chemotherapy. Using in vitro isotope labeling technique, we compared metabolic pathways between CD13+ and CD13– subpopulations. Using co-immunoprecipitation and western blotting, we determined the target expressions in protein levels under different conditions. We also performed immunohistochemistry to detect the target proteins under different conditions. Animal models were constructed to verify the potential role of tyrosine metabolism in post-chemotherapeutic relapse in vivo.
Results
We observed that quiescent CD13+ CSCs are enriched after chemotherapy in HCCs, and serve as a reservoir for recurrence. Mechanistically, CD13+ CSCs were dependent on aerobic metabolism of tyrosine rather than glucose as energy source. Tyrosine metabolism also generated nuclear acetyl-CoA to acetylate and stabilize Foxd3, thereby allowing CD13+ CSCs cells to sustain quiescence and resistance to chemotherapeutic agents.
Conclusion
These findings encourage further exploration of eliminating CD13+ cells by targeting specific metabolic pathways to prevent recurrence in HCCs.
Figure
-
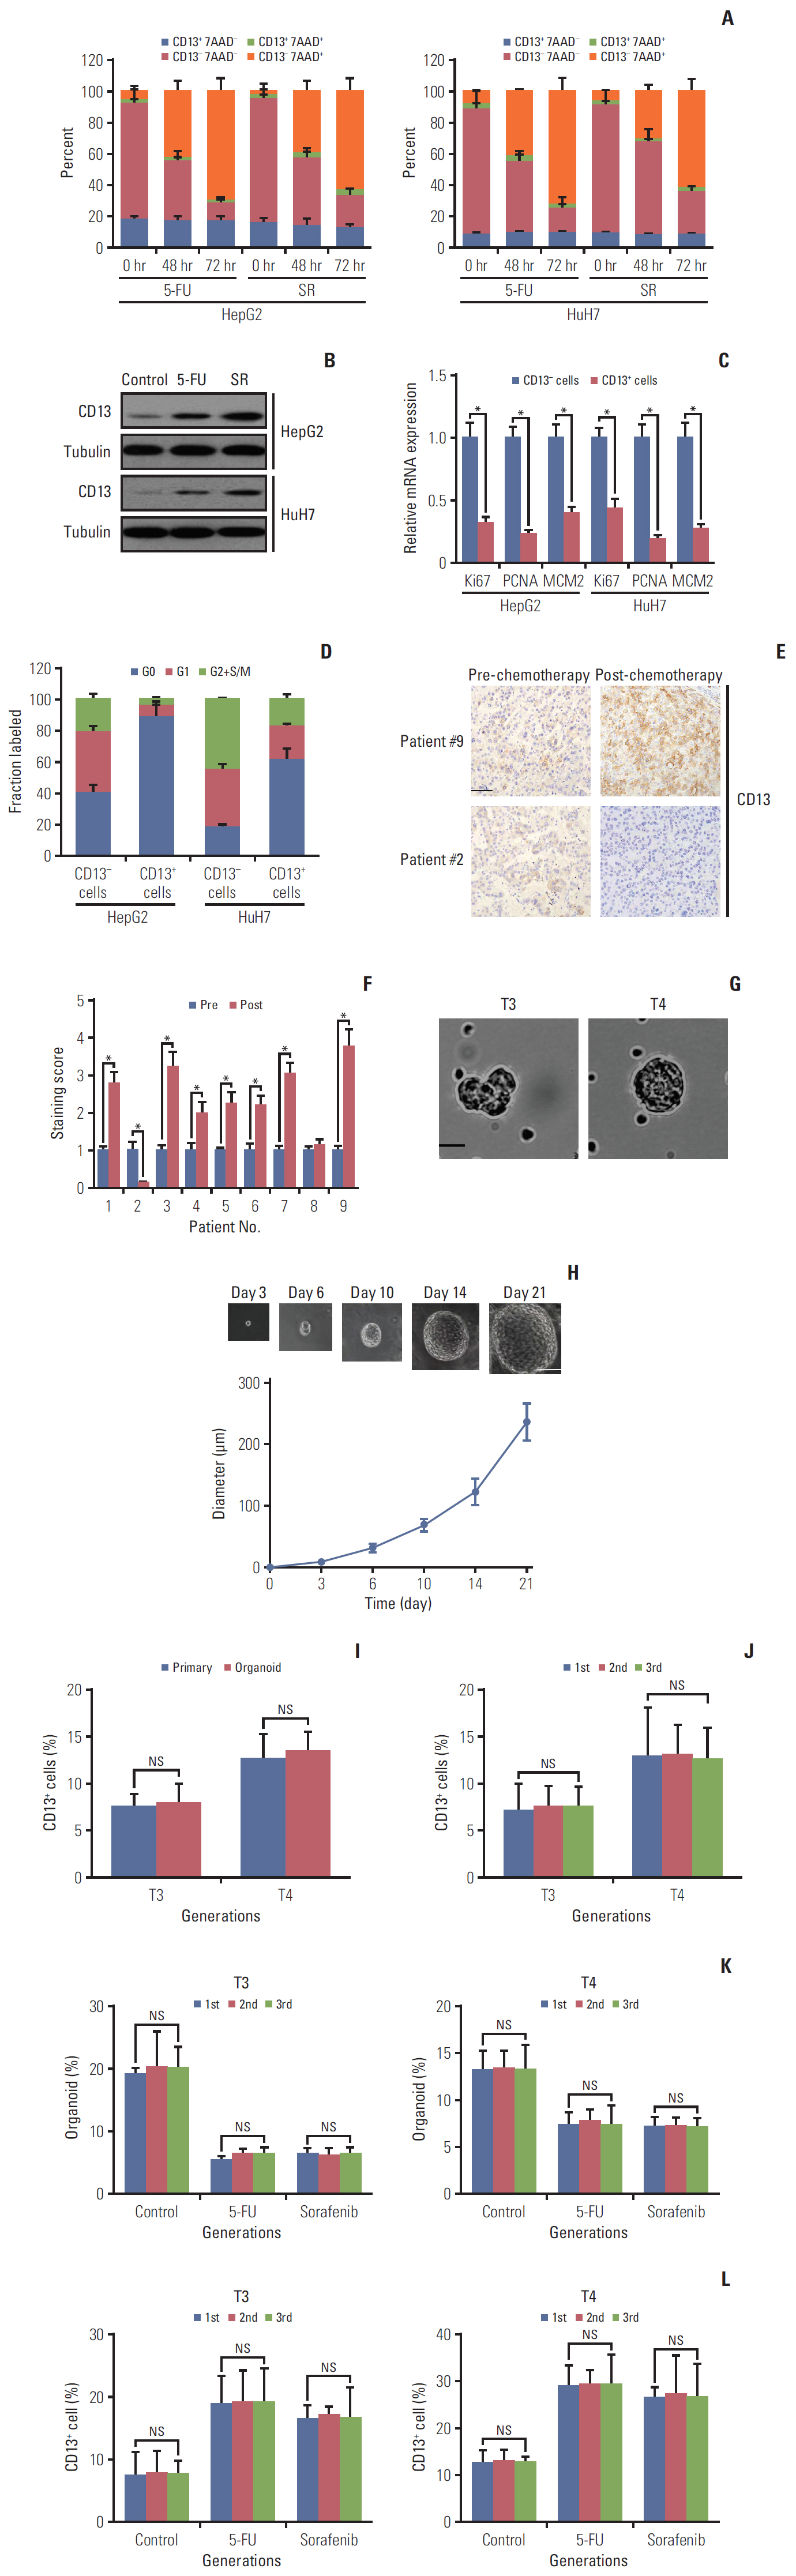
Fig. 1. Quiescent CD13+ cancer stem cells in hepatocellular carcinomas (HCCs) are enriched following chemotherapy. (A) HepG2 and HuH7 cells were persistently treated with 5-fluorouracil (5-FU; 5 μM) or sorafenib (SR; 4 μM) and analyzed for CD13 expression by flow cytometry at the indicated time points. Dead cells were detected by 7AAD staining. (B) Immunoblotting of CD13 protein expression in pre- and drug-treated HepG2 and HuH7 cells at 48-hour post-treatment. (C) Representative markers for proliferation were examined at the mRNA level in CD13+ and CD13- subsets from HepG2 and HhH7 cells. (D) Cell cycle distribution of CD13+ and CD13- fractions from HepG2 or HuH7 cells was determined by combined staining with Hoechst33342 and pyroninY. (D) Cell cycle distribution of CD13+ and CD13- fractions from HepG2 or HuH7 cells was determined by combined staining with Hoechst33342 and pyroninY. (E) Representative images of CD13+ cell frequency in untreated tumors and tumor remnants after hepatic arterial infusion chemotherapy evaluated by immunohistochemistry (IHC). Scale bar=50 μm. (F) Comparison of IHC CD13 staining from nine HCC patients before and after hepatic arterial infusion chemotherapy. All patients achieved a partial regression. (G) Representative images of primary 3D organoids on day 12 from tumor biopsies of two HCC patients (T3 and T4). Scale bar=100 μm. (H) The representative images of T4-derived 3D organoids are shown (upper) along with the corresponding growth curve (bottom). Scale bar=150 μm. (I) Quantification analysis of CD13+ cells in primary T3/T4 tumors and their corresponding organoids. (J) Flow cytometric analysis of CD13+ cells in T3 and T4-derived organoids during serial passages. (K) Organoid-forming efficiency in the serial organoid cultures upon the administration of chemotherapeutic agents (5 μM 5-FU or 4 μM sorafenib). (L) Flow cytometric quantification analysis of CD13+ cells in the serial organoid cultures upon administration of chemotherapeutic agents (5 μM 5-FU or 4 μM SR). Values shown are mean±standard deviation. A two-tailed unpaired t test was used to compare experimental groups. *p < 0.05; NS, no significance.
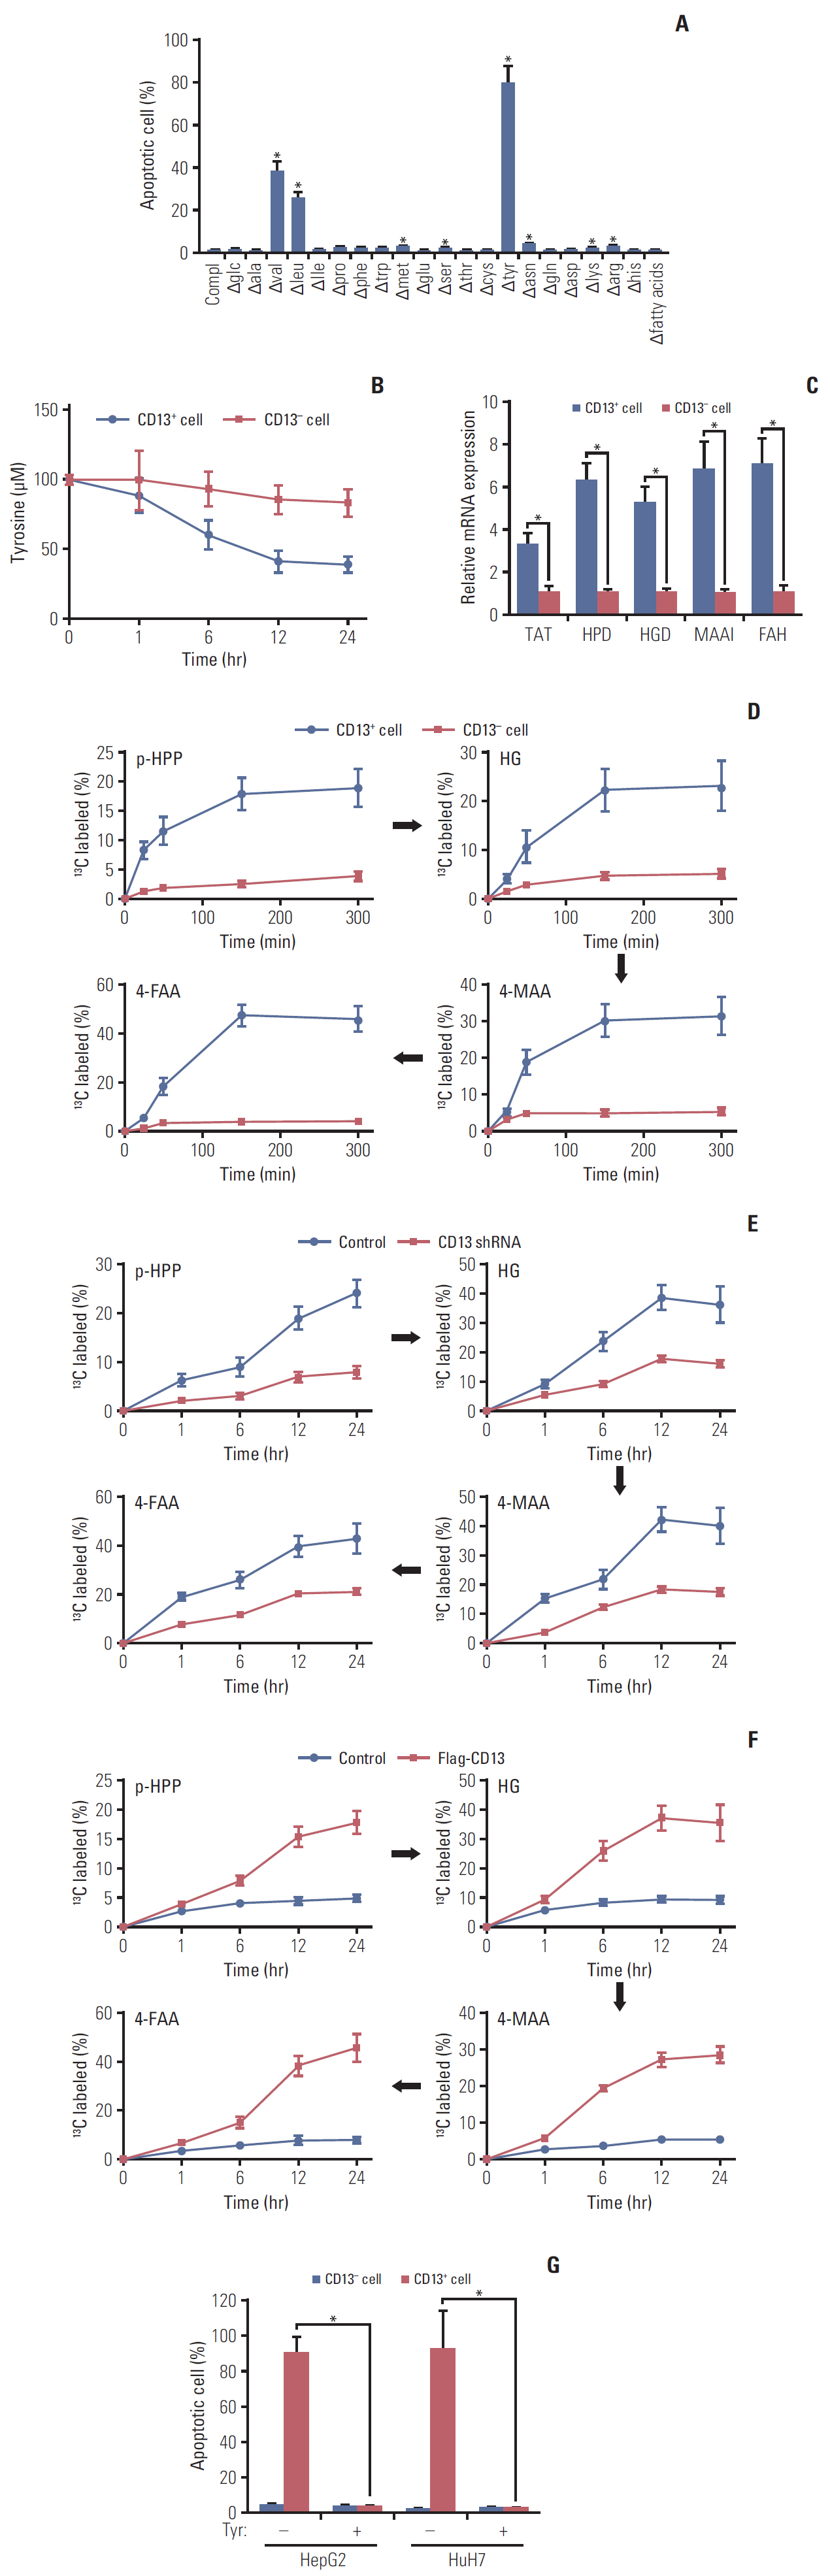
Fig. 2. Tyr metabolism is enhanced in CD13+ cancer stem cells from hepatocellular carcinomas. (A) Apoptosis in HepG2-derived CD13+ cells was determined 72 hours after deprivation of essential nutrients. (B) Comparison of Tyr consumption in HepG2-derived CD13- vs. CD13+ cells. (C) Comparison of mRNA level of enzymes in Tyr metabolism in HuH7-derived CD13- vs. CD13+ cells. (D) HepG2-xenografted BALB/c nude mice received 13C-tyrosine infusion prior to cytometric sorting of CD13+ and CD13- cells. The percentage of 13C-labeled intermediates (para-hydroxyphenylpyruvate[p-HPP], homogentisic acid [HG], 4-maleylacetoacetate [4-MAA], and 4-fumarylacetoacetate [4-FAA]) was assessed by mass spectrometry (n=3 per time point). (E) The percentage of 13C-labeled intermediates (p-HPP, HG, 4-MAA, and 4-FAA) in HuH7-derived CD13+ cells pre-treated with CD13 shRNA or scrambled shRNA. (F) The percentage of 13C-labeled intermediates in HuH7-derived CD13+ cells overexpressing Flag-CD13. (G) The apoptotic rate in CD13+ and CD13- fractions from HepG2 and HuH7 cells upon Tyr deprivation for 72 hours. Values shown are mean±standard deviation. A two-tailed unpaired t test was used to compare experimental groups. *p < 0.05.
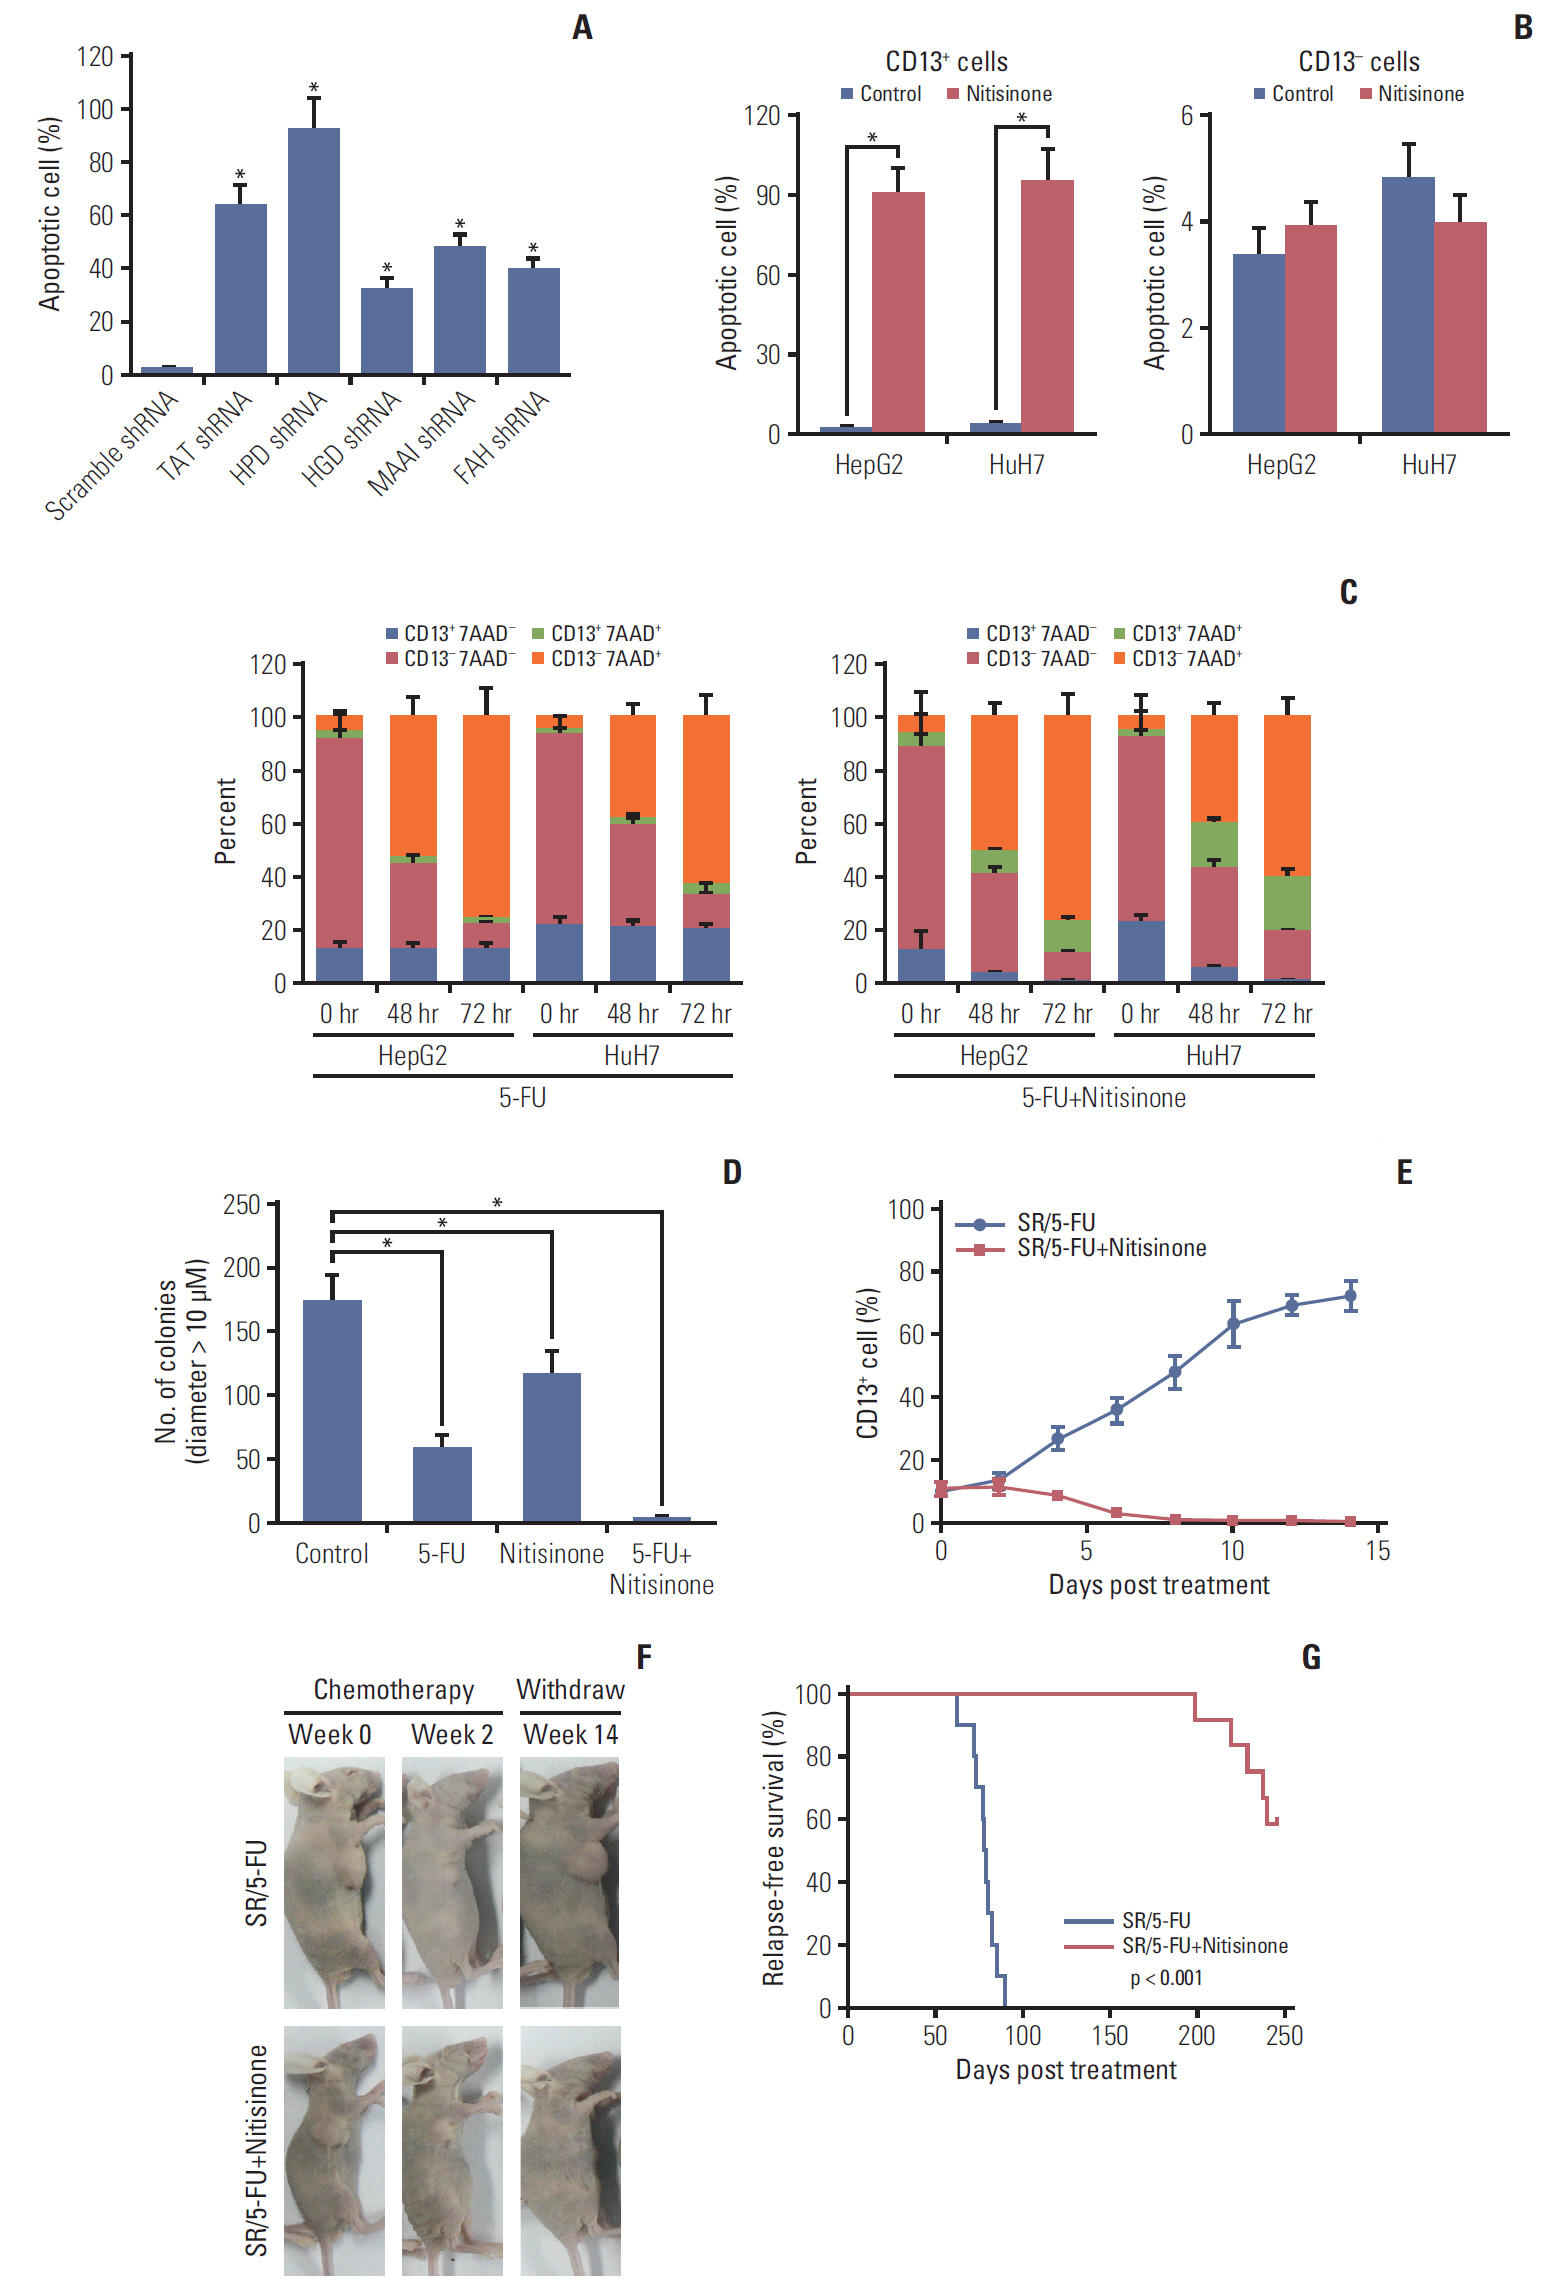
Fig. 3. Targeting Tyr metabolism by nitisinone eliminates CD13+ cancer stem cells and postpones recurrence in hepatocellular carcinomas. (A) The apoptotic rate in HepG2-derived CD13+ cells transfected with the indicated shRNA for 72 hours. TAT, tyrosine aminotransferase; HPD, 4-hydroxyphenylpyruvic acid dioxygenase; HGD, homogentisate 1,2-dioxygenase; MAAI, maleylacetoacetate isomerase; FAH, fumarylacetoacetase. (B) The apoptotic rate in HepG2 and HuH7-derived CD13+ (left panel) versus CD13- subsets (right panel) with or without nitisinone (100 nM, 72 hours) treatment. (C) HepG2 and HuH7 cells were persistently treated with 5-fluorouracil (5-FU; 5 μM) or/and nitisinone (100 nM), after which CD13 expression was analyzed by flow cytometry at the indicated time points. Dead cells were detected by 7AAD staining. (D) Soft agar colony-forming assay of HepG2 cells after 72 hours pulse treatment with 5-FU (5 μM) or/and nitisinone (100 nM). Colonies were counted manually after 5 weeks of growth. (E-G) Upon reaching ~1 cm in tumor diameter after subcutaneous implantation, BALB/c nude mice bearing HepG2 xenografts were randomized to receive sorafenib (SR)/5-FU (twice weekly for 2 weeks) in the presence (n=20) or absence (n=20) of nitisinone. (E) The frequency of CD13+ cell between SR/5-FU and SR/5-FU+nitisinone groups was compared by flow cytometry (n=3 per time point). (F) Macroscopic examination revealed regression within 2 weeks (middle panels), and subsequent relapse or complete regression within 14 weeks (right panels) in SR/5-FU and SR/5-FU+nitisinone groups, respectively. (G) Relapse-free survival was compared between doxorubicin (DXR)/5-FU and DXR/5-FU plus nitisinone groups by Kaplan-Meier survival analyses. Values shown are mean±standard deviation. p-values were calculated by two-tailed unpaired t test unless otherwise indicated. *p < 0.05.
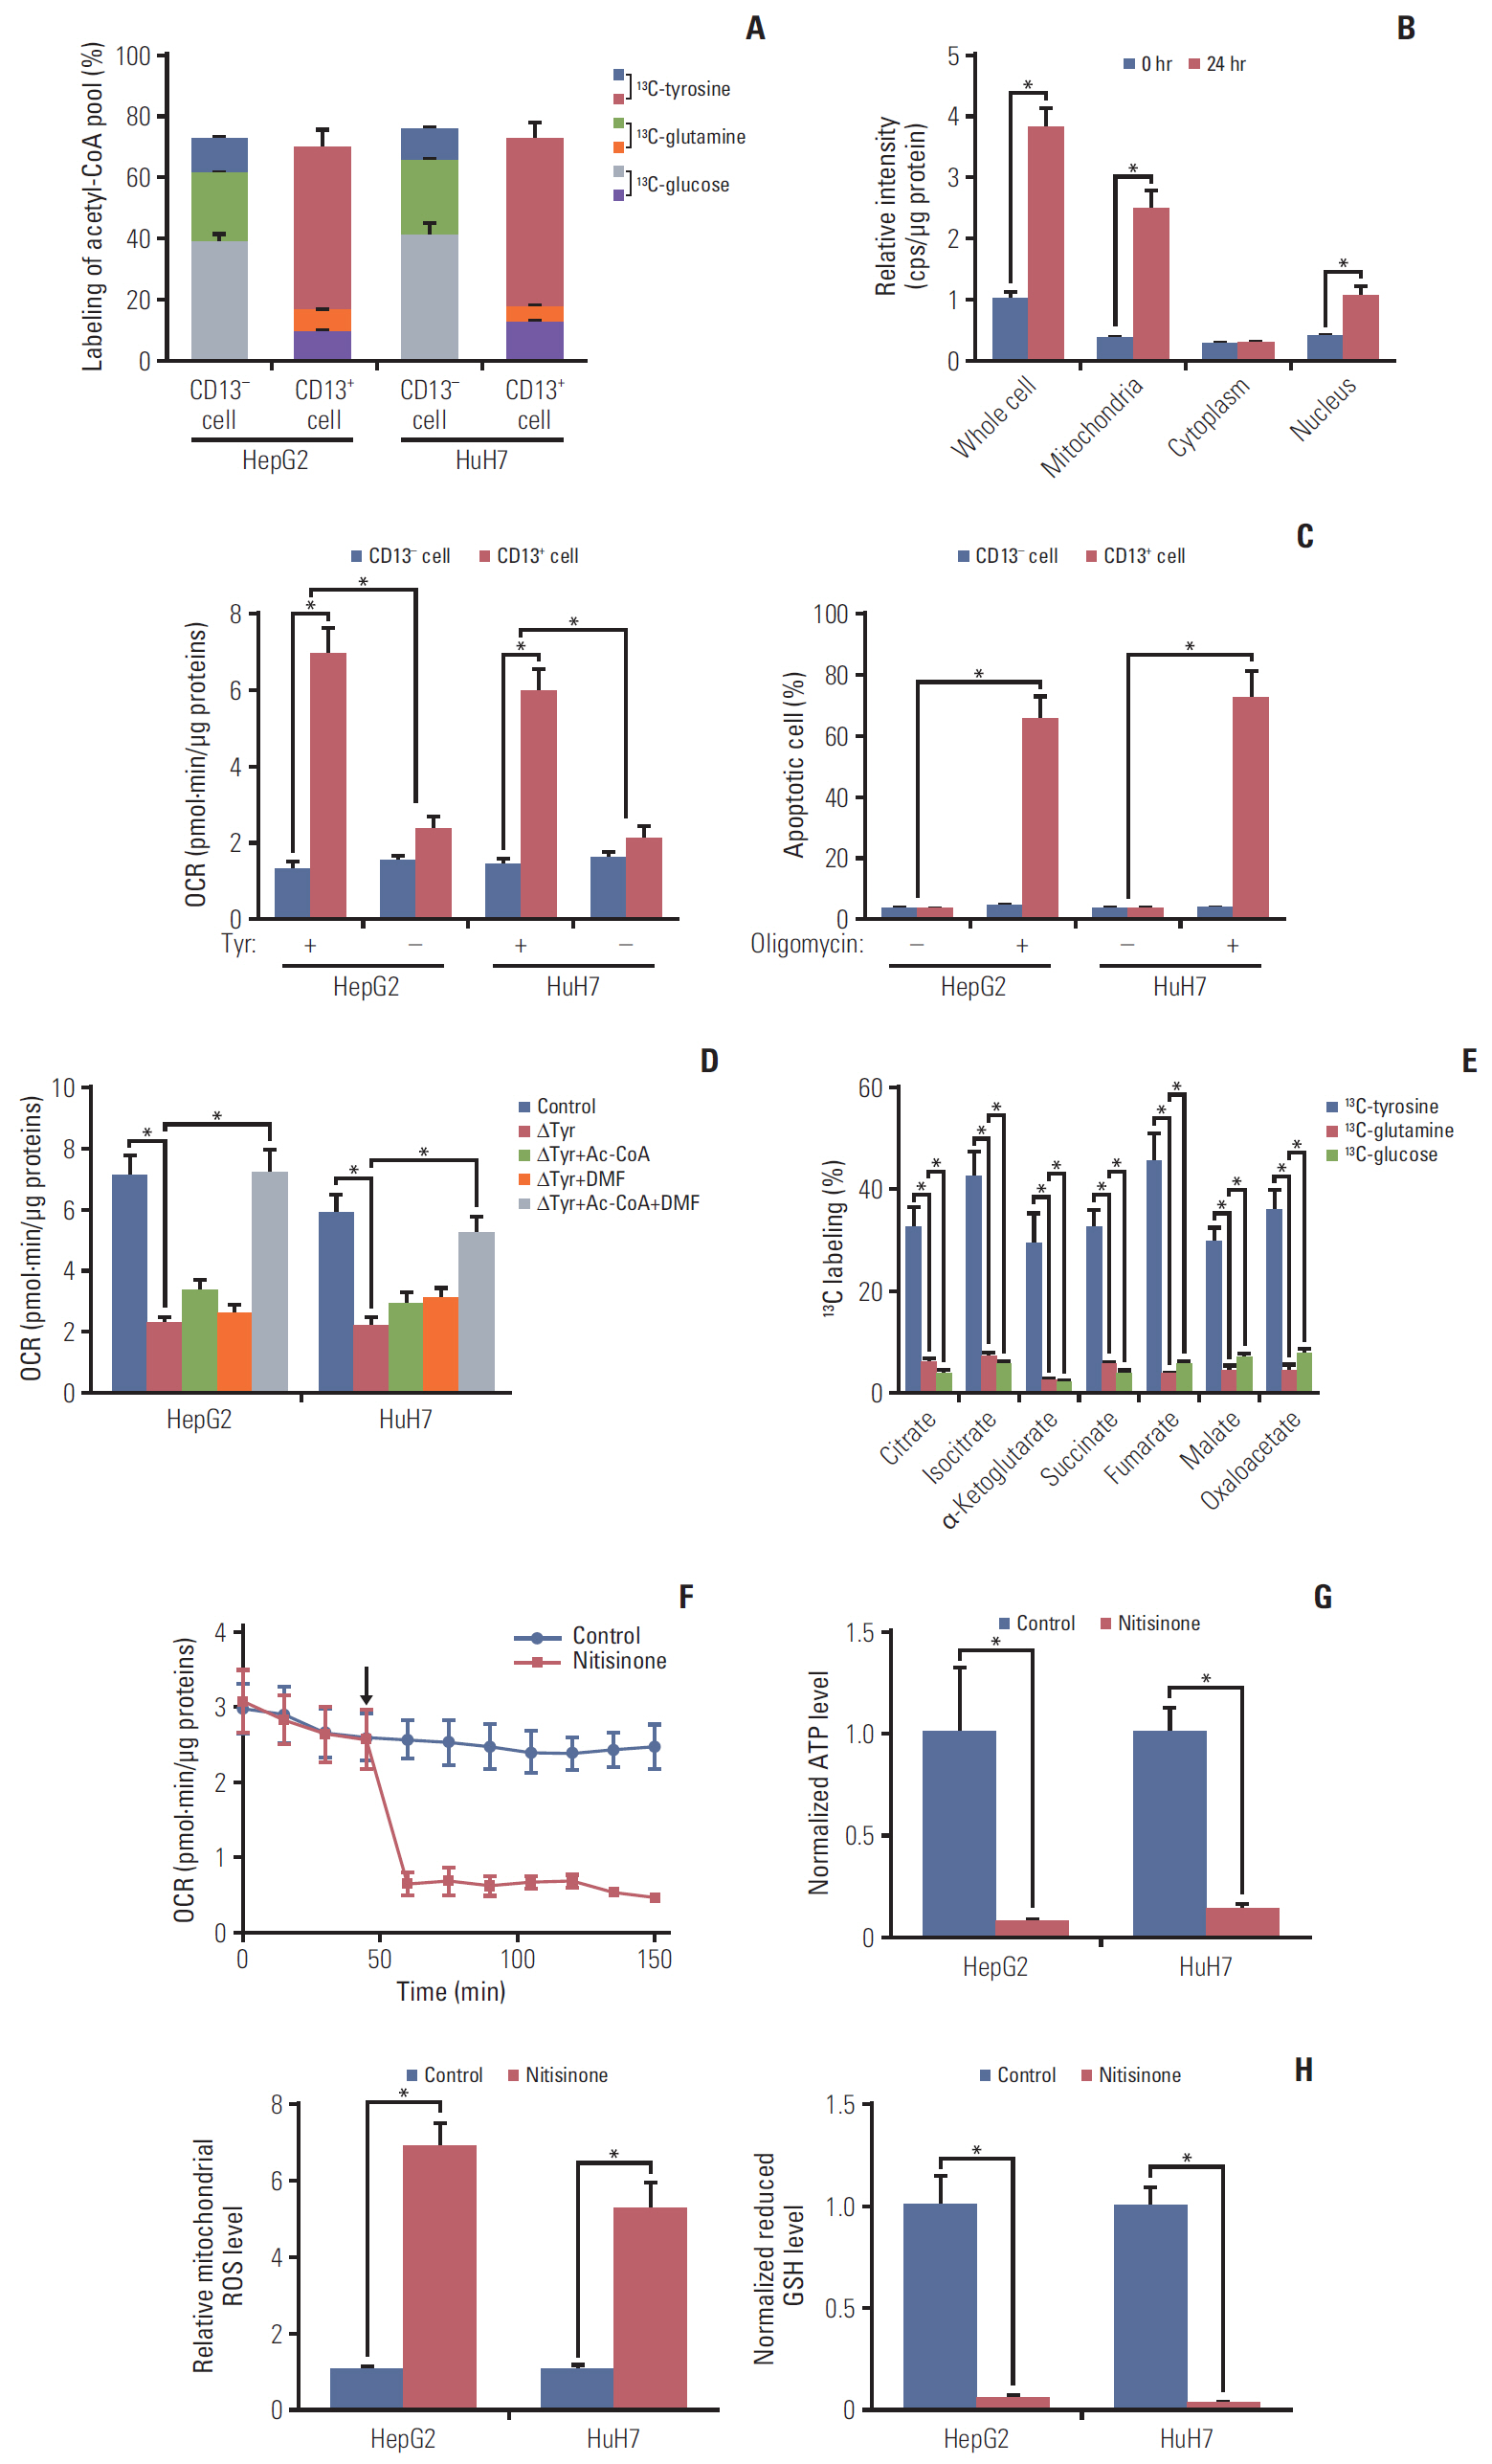
Fig. 4. Tyr metabolism provides mitochondrial acetyl-CoA for oxidative phosphorylation. (A) Acetyl-CoA from 13C-glucose, 13C-glutamine, or 13C-Tyr in CD13+ and CD13- fractions sorted from HepG2 and HuH7 cells. (B) The intracellular distribution of 13C-acetyl-CoA in HepG2-derived CD13+ cells incubated with 13C-tyrosine for 24 hours. (C) Upper panel: oxygen consumption of HepG2 and HuH7-derived CD13+ and CD13- cells cultured in complete or Tyr-deprived medium for 24 hours; lower panel: apoptotic rate of HepG2 and HuH7-derived CD13+ and CD13- cells cultured with oligomycin (2.5 μg/mL) for 72 hours. (D) Oxygen consumption of HepG2 and HuH7-derived CD13+ cells cultured in Tyr-deprived medium and pretreated with 200 μM acetyl-CoA, 50 μM dimethyl-fumarate (DMF), or both for 24 hours. (E) HepG2-xenografted BALB/c nude mice were randomized to receive 13C-glucose (n=5), 13C-glutamine (n=5), or 13C-tyrosine (n=6) infusion for 200 minutes prior to cytometric sorting of CD13+ cells. The percentage of 13C-labeled TCA cycle intermediates was assessed by mass spectrometry. (F) Plots of oxygen consumption rate as a parameter of time in the absence or presence of 100 nM Nitisinone (indicated by arrow) in CD13+ fraction sorted from HuH7 cells. (G) ATP levels in HepG2 and HuH7-derived CD13+ fraction treated with or without nitisinone (100 nM) for 6 hours. (H) Mitochondrial reactive oxygen species (ROS; left panel) and reduced glutathione (GSH) levels (right panel) in HepG2 and HuH7-derived CD13+ cells subjected to 100 nM nitisinone for 6 hours. Values shown are mean±standard deviation. A two-tailed unpaired t test was used to compare experimental groups. *p < 0.05.
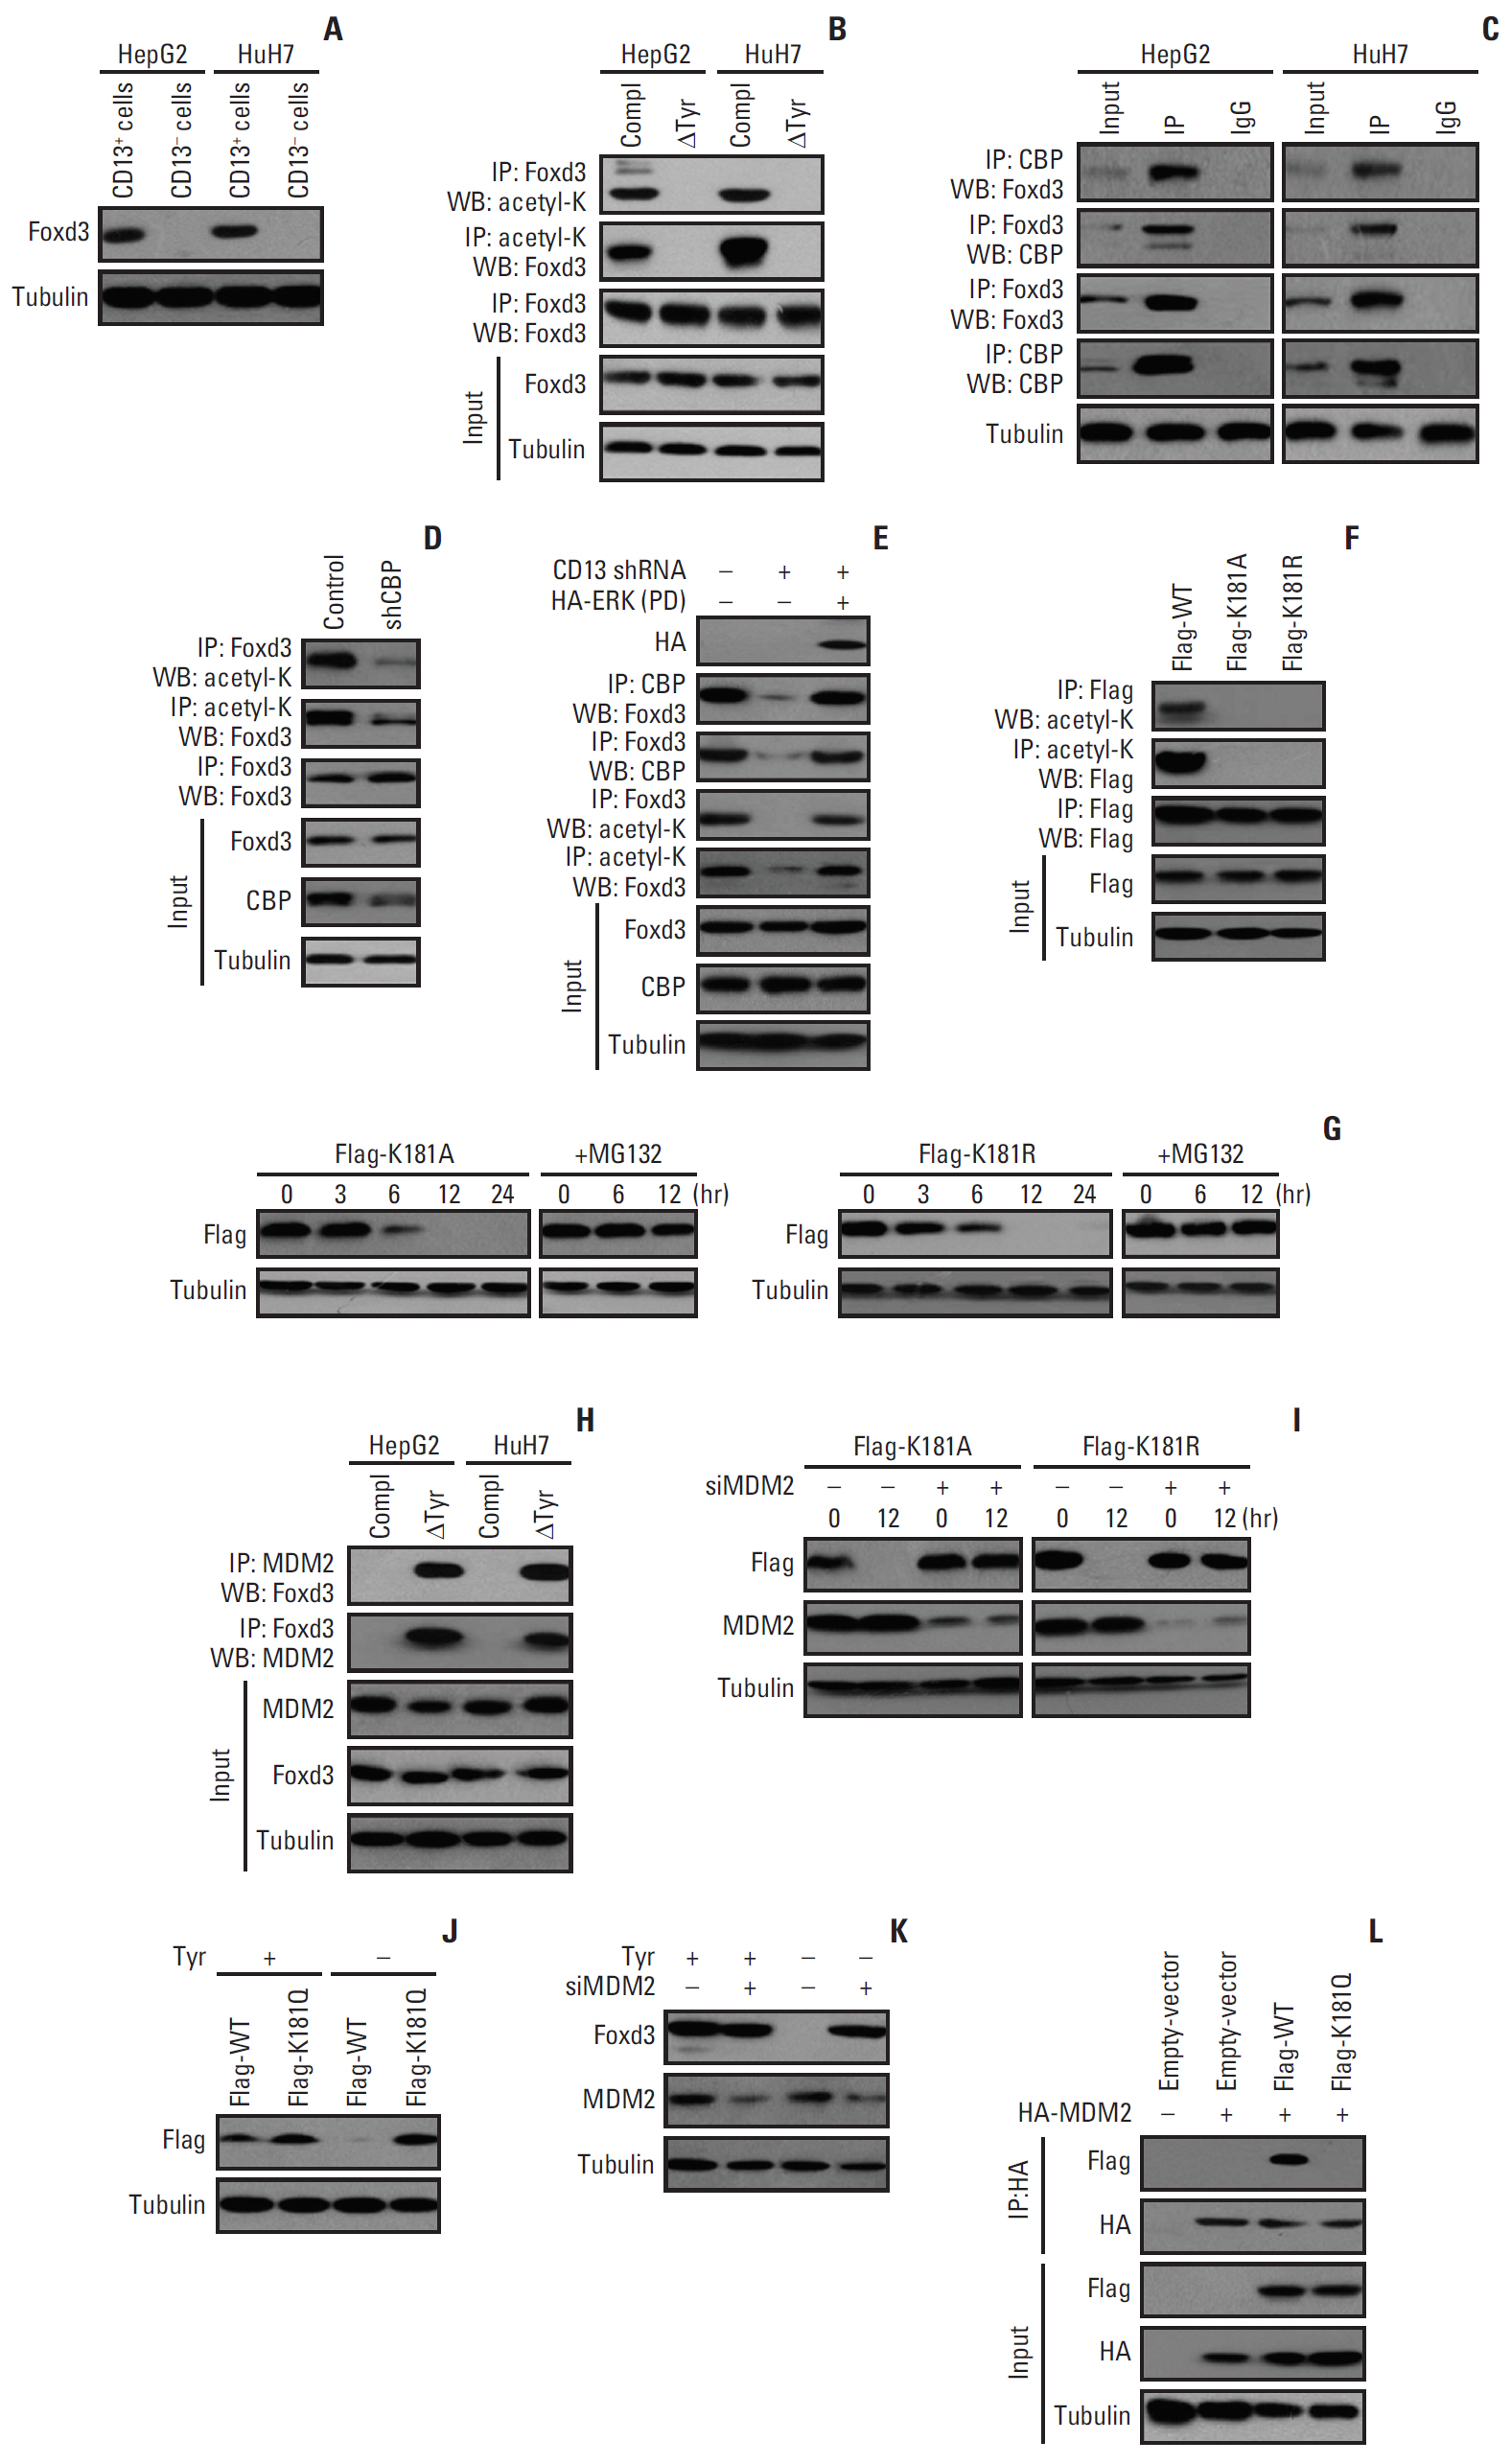
Fig. 5. Nuclear acetyl-CoA derived from Tyr metabolism acetylates Foxd3K181 to prevent its degradation by MDM2. (A) The protein level of Foxd3 in CD13+ and CD13- fractions from HepG2 and HuH7 cells. (B) Foxd3 acetylation upon Tyr deprivation for 6 hours in CD13+ cells. (C) Co-immunoprecipitation (Co-IP) of Foxd3 and CBP in CD13+ cells. (D) Foxd3 acetylation in HuH7-derived CD13+ cells expressing CBP shRNA. (E) HepG2-derived CD13+ cells were pre-treated with CD13 shRNA or/and HA-ERK(PD) mutant for 24 hours prior to assessment of CBP/Foxd3 association and Foxd3 acetylation. (F) Acetylation of ectopically expressed Foxd3 in HepG2-derived CD13+ cells at 36 hours after transfection with wild-type Foxd3 or K181A/R mutants. (G) K181A/R expression in HepG2-derived CD13+ cells transfected with K181A/R mutants and treated with vehicle or MG132 (25 nM). The time points are presented using 36 hours after transfection as the reference. (H) Co-IP of Foxd3 and MDM2 in CD13+ cells after Tyr deprivation for 6 hours. (I) The expression of K181A/R mutants and MDM2 in HepG2-derived CD13+ cells transfected with K181A/R, MDM2 siRNA, or both. The time points are presented using 36 hours after transfection as the reference. (J) The expression of wild-type Foxd3 and K181Q mutant in HuH7-derived CD13+ cells after Tyr deprivation for 12 hours. (K) HuH7-derived CD13+ cells were treated with or without MDM2 siRNA, after which Foxd3 and MDM2 expression were assessed at 12 hours after Tyr deprivation. (L) Co-IP of HA-tagged MDM2 and Flag-tagged wild-type Foxd3 or K181Q in HEK293T cells treated with MG132 (25 nM).
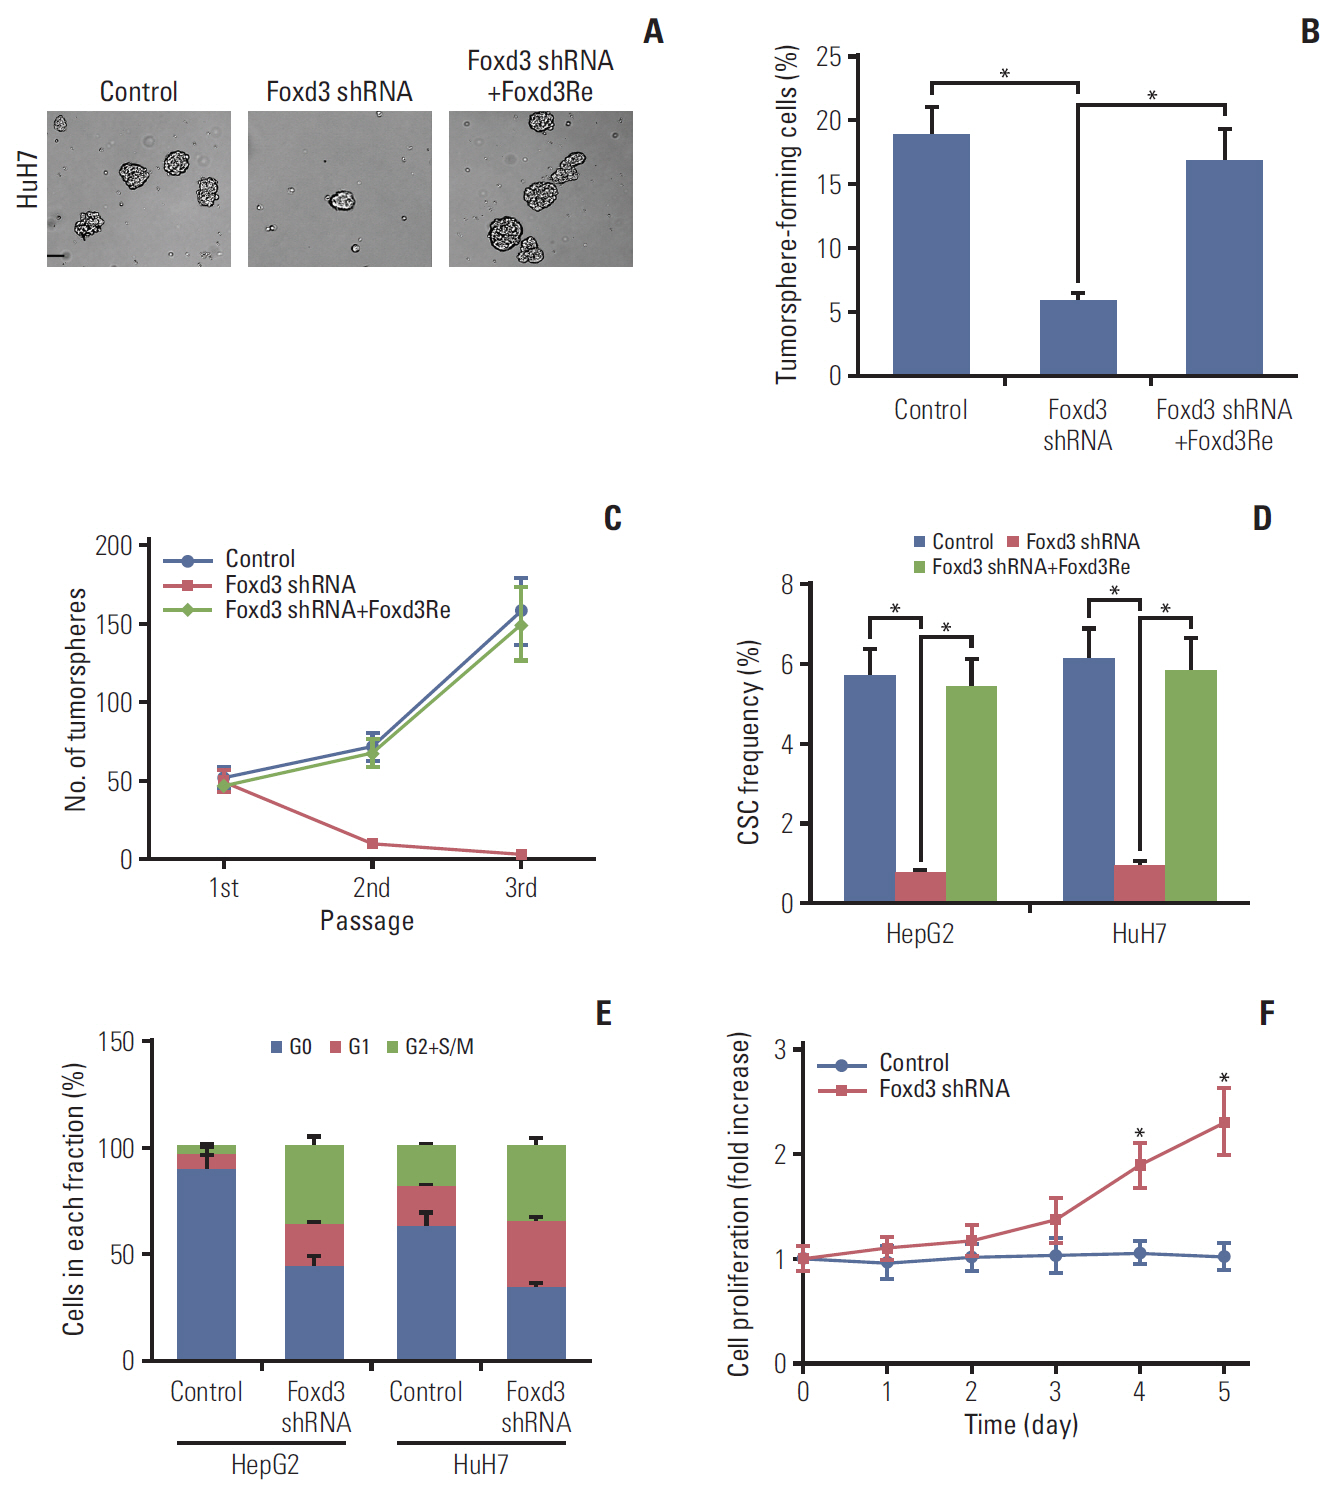
Fig. 6. Loss of Foxd3 impairs self-renewal and quiescence in CD13+ cancer stem cells (CSCs). (A) Sphere formation by HepG2-derived CD13+ cells expressing Foxd3 shRNA or/and Foxd3Re. Tumorsphere-forming capacity (B) and serial spheres passaging (C) of HepG2-derived CD13+ cells expressing Foxd3 shRNA and/or Foxd3Re. (D) HepG2 and HuH7-derived CD13+ cells were transfected with Foxd3 shRNA alone or in combination with Foxd3Re, after which CSC frequency of CD13+ CSCs was measured by in vivo limiting dilution assays. (E) Cell cycle distribution of HepG2 and HuH7-derived CD13+ cells expressing scrambled shRNA or Foxd3 shRNA. (F) The relative proliferative rate of HuH7-derived CD13+ cells on 5 days upon Foxd3 knockdown. Values shown are mean±standard deviation. A two-tailed unpaired t test was used to compare experimental groups. *p < 0.05.
Reference
-
References
1. Bray F, Ferlay J, Soerjomataram I, Siegel RL, Torre LA, Jemal A. Global cancer statistics 2018: GLOBOCAN estimates of incidence and mortality worldwide for 36 cancers in 185 countries. CA Cancer J Clin. 2018; 68:394–424.
Article2. Bruix J, Sherman M; American Association for the Study of Liver Diseases. Management of hepatocellular carcinoma: an update. Hepatology. 2011; 53:1020–2.
Article3. European Association for the Study of the Liver. EASL clinical practice guidelines: management of alcohol-related liver disease. J Hepatol. 2018; 69:154–81.4. Phi LT, Sari IN, Yang YG, Lee SH, Jun N, Kim KS, et al. Cancer stem cells (CSCs) in drug resistance and their therapeutic implications in cancer treatment. Stem Cells Int. 2018; 2018:541–6923.
Article5. Yamashita T, Wang XW. Cancer stem cells in the development of liver cancer. J Clin Invest. 2013; 123:1911–8.
Article6. Yang ZF, Ngai P, Ho DW, Yu WC, Ng MN, Lau CK, et al. Identification of local and circulating cancer stem cells in human liver cancer. Hepatology. 2008; 47:919–28.
Article7. Ma S, Chan KW, Hu L, Lee TK, Wo JY, Ng IO, et al. Identification and characterization of tumorigenic liver cancer stem/progenitor cells. Gastroenterology. 2007; 132:2542–56.
Article8. Haraguchi N, Ishii H, Mimori K, Tanaka F, Ohkuma M, Kim HM, et al. CD13 is a therapeutic target in human liver cancer stem cells. J Clin Invest. 2010; 120:3326–39.
Article9. Christ B, Stock P, Dollinger MM. CD13: waving the flag for a novel cancer stem cell target. Hepatology. 2011; 53:1388–90.
Article10. Luan Y, Xu W. The structure and main functions of aminopeptidase N. Curr Med Chem. 2007; 14:639–47.
Article11. Sancho P, Barneda D, Heeschen C. Hallmarks of cancer stem cell metabolism. Br J Cancer. 2016; 114:1305–12.
Article12. Deshmukh A, Deshpande K, Arfuso F, Newsholme P, Dharmarajan A. Cancer stem cell metabolism: a potential target for cancer therapy. Mol Cancer. 2016; 15:69.
Article13. Cairns RA, Harris IS, Mak TW. Regulation of cancer cell metabolism. Nat Rev Cancer. 2011; 11:85–95.
Article14. Li L, Bhatia R. Stem cell quiescence. Clin Cancer Res. 2011; 17:4936–41.15. Drost J, Clevers H. Organoids in cancer research. Nat Rev Cancer. 2018; 18:407–18.
Article16. Mao P, Joshi K, Li J, Kim SH, Li P, Santana-Santos L, et al. Mesenchymal glioma stem cells are maintained by activated glycolytic metabolism involving aldehyde dehydrogenase 1A3. Proc Natl Acad Sci U S A. 2013; 110:8644–9.
Article17. Ferreira LM, Hebrant A, Dumont JE. Metabolic reprogramming of the tumor. Oncogene. 2012; 31:3999–4011.
Article18. Lock E, Ranganath LR, Timmis O. The role of nitisinone in tyrosine pathway disorders. Curr Rheumatol Rep. 2014; 16:457.
Article19. Ait-Si-Ali S, Carlisi D, Ramirez S, Upegui-Gonzalez LC, Duquet A, Robin P, et al. Phosphorylation by p44 MAP Kinase/ERK1 stimulates CBP histone acetyl transferase activity in vitro. Biochem Biophys Res Commun. 1999; 262:157–62.
Article20. Santos AN, Langner J, Herrmann M, Riemann D. Aminopeptidase N/CD13 is directly linked to signal transduction pathways in monocytes. Cell Immunol. 2000; 201:22–32.
Article21. Yang JY, Zong CS, Xia W, Yamaguchi H, Ding Q, Xie X, et al. ERK promotes tumorigenesis by inhibiting FOXO3a via MDM2-mediated degradation. Nat Cell Biol. 2008; 10:138–48.
Article22. Pauklin S, Vallier L. The cell-cycle state of stem cells determines cell fate propensity. Cell. 2013; 155:135–47.
Article23. Merlos-Suarez A, Barriga FM, Jung P, Iglesias M, Cespedes MV, Rossell D, et al. The intestinal stem cell signature identifies colorectal cancer stem cells and predicts disease relapse. Cell Stem Cell. 2011; 8:511–24.
Article24. Ito K, Suda T. Metabolic requirements for the maintenance of self-renewing stem cells. Nat Rev Mol Cell Biol. 2014; 15:243–56.
Article25. Possemato R, Marks KM, Shaul YD, Pacold ME, Kim D, Birsoy K, et al. Functional genomics reveal that the serine synthesis pathway is essential in breast cancer. Nature. 2011; 476:346–50.
Article26. Wensveen FM, Alves NL, Derks IA, Reedquist KA, Eldering E. Apoptosis induced by overall metabolic stress converges on the Bcl-2 family proteins Noxa and Mcl-1. Apoptosis. 2011; 16:708–21.
Article27. Kim HM, Haraguchi N, Ishii H, Ohkuma M, Okano M, Mimori K, et al. Increased CD13 expression reduces reactive oxygen species, promoting survival of liver cancer stem cells via an epithelial-mesenchymal transition-like phenomenon. Ann Surg Oncol. 2012; 19 Suppl 3:S539–48.
Article28. Wellen KE, Thompson CB. A two-way street: reciprocal regulation of metabolism and signalling. Nat Rev Mol Cell Biol. 2012; 13:270–6.
Article29. Yong JS, Intriago-Baldeon DP, Lam EW. FOXD3 controls pluripotency through modulating enhancer activity. Stem Cell Investig. 2016; 3:17.
Article30. Stewart RM, Briggs MC, Jarvis JC, Gallagher JA, Ranganath L. Reversible keratopathy due to hypertyrosinaemia following intermittent low-dose nitisinone in alkaptonuria: a case report. JIMD Rep. 2014; 17:1–6.
Article
- Full Text Links
-
- Actions
-
Cited
- CITED
-
- Close
- Share
-
- Similar articles
-
- Cellular origin of liver cancer stem cells
- Activation of PKCdelta by tyrosine phosphorylation in rat parotid acinar cells
- Knockdown of 14-3-3zeta enhances radiosensitivity and radio-induced apoptosis in CD133+ liver cancer stem cells
- Expression of CD133, CD44, CK7, and OCT4 in Animal Cancers
- D60-sensitive tyrosine phosphorylation is involved in Fas-mediated phospholipase D activation
