Big data differential analysis of microglial cell responses in neurodegenerative diseases
- Affiliations
-
- 1Department of Anatomy and Cell Biology, Dong-A University College of Medicine, Busan, Korea.
- 2Department of Medicine, Graduate School, Dong-A University, Busan, Korea.
- 3Department of Anesthesiology and Pain Medicine, Kosin University College of Medicine, Busan, Korea. dmadjejs@naver.com
- KMID: 2466701
- DOI: http://doi.org/10.5115/acb.19.048
Abstract
- Microarray technology has become an indispensable tool for monitoring the levels of gene expression in a given organism through organization, analysis, interpretation, and utilization of biological sequences. Importantly, preliminary microarray gene expression differs from experimentally validated gene expression. Generally, microarray analysis of gene expression in microglial cells is used to identify genes in the brain and spinal cord that are responsible for the onset of neurodegenerative diseases; these genes are either upregulated or downregulated. In the present study, 770 genes identified in prior publications, including experimental studies, were analyzed to determine whether these genes encode novel disease genes. Among the genes published, 340 genes were matched among multiple publications, whereas 430 genes were mismatched; the matched genes were presumed to have the greatest likelihood of contributing to neurodegenerative diseases and thus to be potentially useful target genes for treatment of neurodegenerative diseases. In protein and mRNA expression studies, matched and mismatched genes showed 99% and 97% potentiality, respectively. In addition, some genes identified in microarray analyses were significantly different from those in experimentally validated expression patterns. This study identified novel genes in microglial cells through comparative analysis of published microarray and experimental data on neurodegenerative diseases.
MeSH Terms
Figure
-
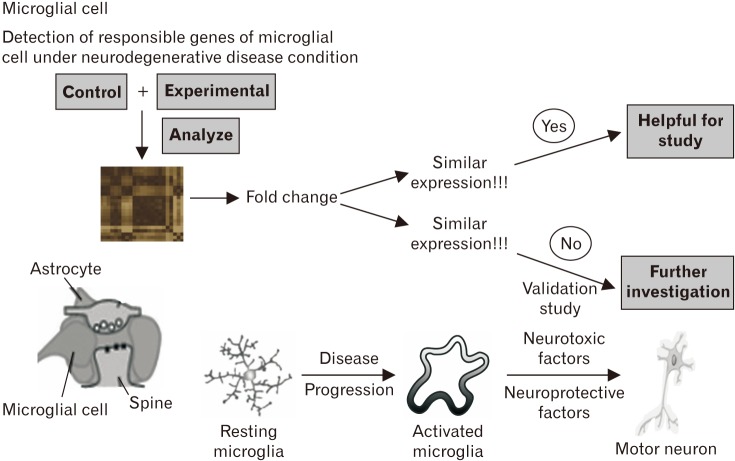
Fig. 1 Microarray study of microglial cell in neurodegenerative disease. This figure describes the activation of microglia is a hallmark of brain pathology. Under neurodegenerative disease condition, the inflammatory response is mediated by the activated microglia. This figure illustrates the gene expression pattern by microarray study in microglial cell under neurodegenerative diseases.
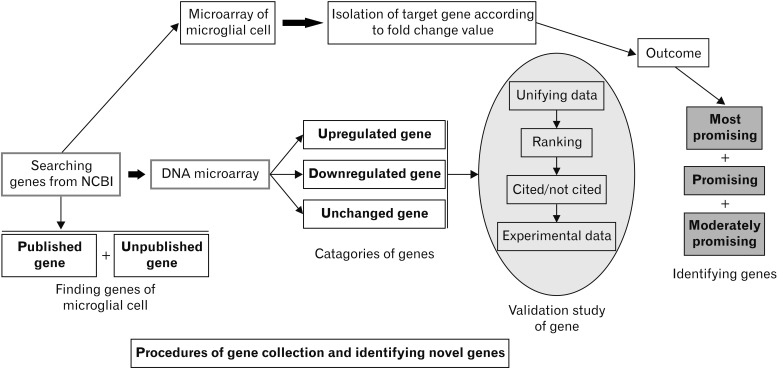
Fig. 2 Working procedure of finding various types of promising gene from microarray study. The procedure of searching genes of microglial cell study in the published research article regarding the DNA microarray to collect the data according to upregulated genes, downregulated genes as well as the unchanged genes. The novel genes are identified by microarray study. This illustration describes how each gene is searched in NCBI for collecting experimental data such as the polymerase chain reaction (PCR), real-time PCR, western blotting, or immunohistochemistry data. In this process, some target molecules are found from the microarray study.
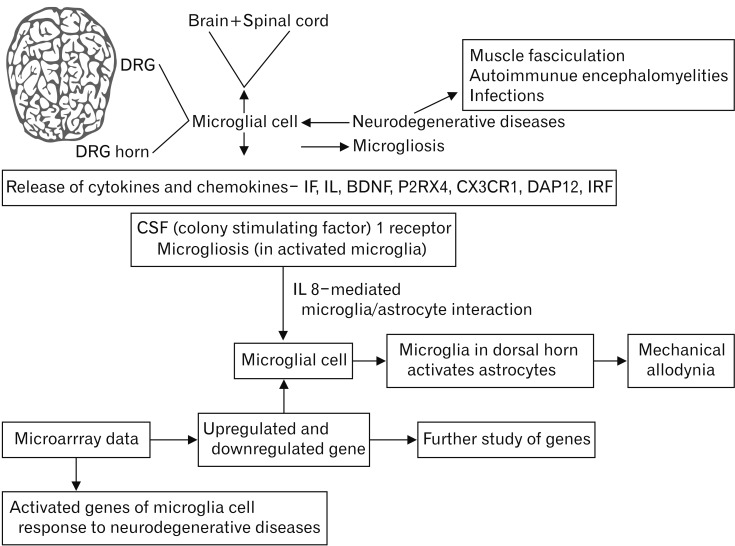
Fig. 3 Mechanism of microglial cell under neurodegenerative disease state. Neuronal cell death occurs under neurodegenerative disease state including motor and peripheral neuron. Microglial cell is activated when neuronal disease occurs. Microglia releases interferon (IF), interleukin (IL), brainderived neurotrophic factors (BDNF), purinoreceptor (P2RX4), chemokine receptor 1 (CX3CR1), DAP12, and IRF when neuropathic pain as well as neurodegenerative disease occur. This diagram depicts how microglial cell becomes active under neurodegenerative diseases. DRG, dorsal root ganglia; CSF, cerebrospinal fluid.
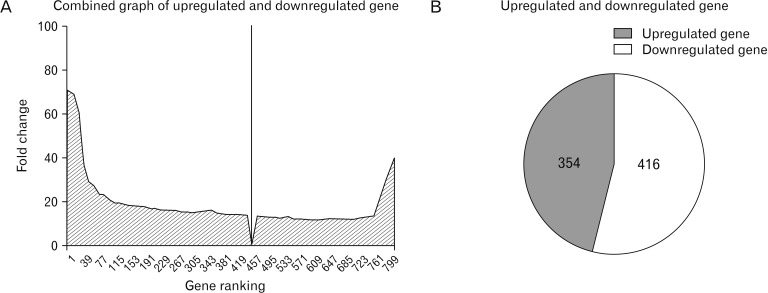
Fig. 4 Linear graph of upregulated and downregulated genes. (A) According to DNA microarray data, the overall numbers of total upregulated and downregulated genes found in the study which are studies related to microglial cell. Analyzing the total genes of upregulated and downregulated and the genes are searched for the experimental data such as polymerase chain reaction (PCR), real-time PCR, and quantitative PCR, etc. which indicates to find out possibility of some genes. (B) Illustration of the total amount of upregulated as well as downregulated gene. The upregulated genes are categorized when the fold-change value is >1 and the downregulated genes are categorized when the fold-change value is <1. The unchanged gene is marked when the fold-change value is 1. The total number of upregulated genes is 456 and the number of downregulated genes is 314 among the total 770 genes.
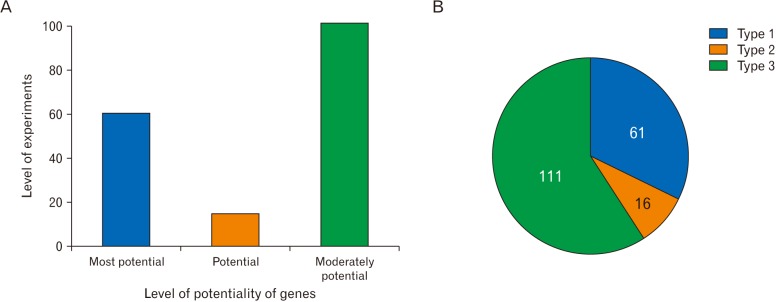
Fig. 5 Potentiality of gene compare to the experimental value. (A) According to the number of fold change, the upregulated and downregulated total genes are arranged in a unified way and according to the data, the genes are classified into most potential, potential, and moderately potential genes for identification. (B) Total amount of experimented genes compare to the published genes.The number of published genes is 770. Among them, 120 genes are most potential, 61 genes are potential, and 20 genes are moderately potential which are named as type 1, type 2, and type 3, respectively.
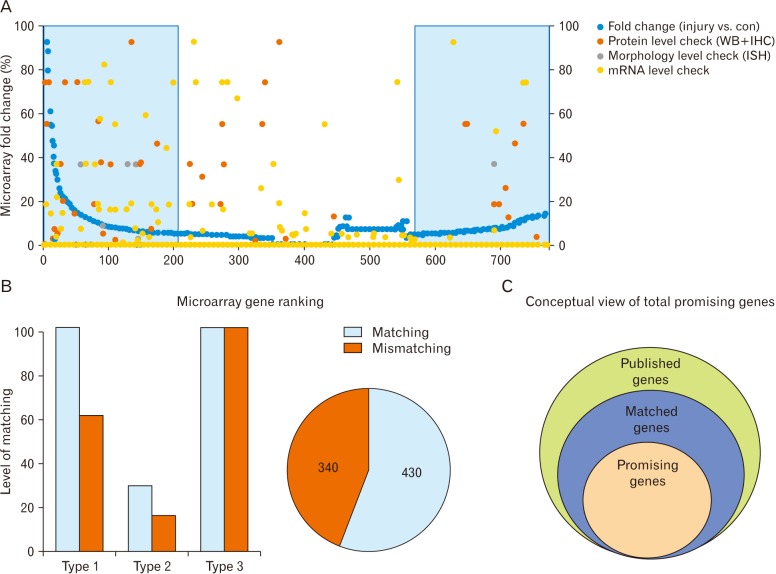
Fig. 6 Comparison between microarray gene expression and the real experimental value. (A) Total promising gene confirmation from the total published genes. As the left side of this graph shows these genes are highly upregulated and the right side of this graph shows highly downregulated, the blue marked area (both left and right) of both sides have good match and these are significant genes in this study. X-axis shows the total number of gene, n=770 and Y-axis shows the fold-change value. IHC, immunohistochemistry; ISH, in situ hybridization. (B) Differential range between the matched and mismatched gene. These figures show microarray data versus real experimental data such as western blotting (WB) and polymerase chain reaction (PCR)/quantitative PCR data. This figure shows the difference between experimental and microarray data. This graph also denotes the identification of find out highly promising gene in this study. (C) Differential range between the published, matched and promised gene. In the pie chart, the green color indicates published genes that occupied large space. Then the blue color indicates matched genes. The least number of promising genes are represented by the yellow color.
Cited by 1 articles
-
Camillo Golgi (1843 –1926): scientist extraordinaire and pioneer figure of modern neurology
Sanjib Kumar Ghosh
Anat Cell Biol. 2020;53(4):385-392. doi: 10.5115/acb.20.196.
Reference
-
1. Kerr MK, Martin M, Churchill GA. Analysis of variance for gene expression microarray data. J Comput Biol. 2000; 7:819–837. PMID: 11382364.2. Newton MA, Kendziorski CM, Richmond CS, Blattner FR, Tsui KW. On differential variability of expression ratios: improving statistical inference about gene expression changes from microarray data. J Comput Biol. 2001; 8:37–52. PMID: 11339905.3. Wake H, Moorhouse AJ, Miyamoto A, Nabekura J. Microglia: actively surveying and shaping neuronal circuit structure and function. Trends Neurosci. 2013; 36:209–217. PMID: 23260014.4. Trapp BD, Wujek JR, Criste GA, Jalabi W, Yin X, Kidd GJ, Stohlman S, Ransohoff R. Evidence for synaptic stripping by cortical microglia. Glia. 2007; 55:360–368. PMID: 17136771.5. Yamada J, Nakanishi H, Jinno S. Differential involvement of perineuronal astrocytes and microglia in synaptic stripping after hypoglossal axotomy. Neuroscience. 2011; 182:1–10. PMID: 21435379.6. Tsuda M, Inoue K, Salter MW. Neuropathic pain and spinal microglia: a big problem from molecules in “small” glia. Trends Neurosci. 2005; 28:101–107. PMID: 15667933.7. Inoue K, Tsuda M. Microglia in neuropathic pain: cellular and molecular mechanisms and therapeutic potential. Nat Rev Neurosci. 2018; 19:138–152. PMID: 29416128.8. Carson MJ. Microglia as liaisons between the immune and central nervous systems: functional implications for multiple sclerosis. Glia. 2002; 40:218–231. PMID: 12379909.9. Sweitzer SM, White KA, Dutta C, DeLeo JA. The differential role of spinal MHC class II and cellular adhesion molecules in peripheral inflammatory versus neuropathic pain in rodents. J Neuroimmunol. 2002; 125:82–93. PMID: 11960644.10. Lee CK, Weindruch R, Prolla TA. Gene-expression profile of the ageing brain in mice. Nat Genet. 2000; 25:294–297. PMID: 10888876.11. Twine NA, Janitz K, Wilkins MR, Janitz M. Whole transcriptome sequencing reveals gene expression and splicing differences in brain regions affected by Alzheimer's disease. PLoS One. 2011; 6:e16266. PMID: 21283692.12. Jiang YM, Yamamoto M, Kobayashi Y, Yoshihara T, Liang Y, Terao S, Takeuchi H, Ishigaki S, Katsuno M, Adachi H, Niwa J, Tanaka F, Doyu M, Yoshida M, Hashizume Y, Sobue G. Gene expression profile of spinal motor neurons in sporadic amyotrophic lateral sclerosis. Ann Neurol. 2005; 57:236–251. PMID: 15668976.13. Thacker MA, Clark AK, Bishop T, Grist J, Yip PK, Moon LD, Thompson SW, Marchand F, McMahon SB. CCL2 is a key mediator of microglia activation in neuropathic pain states. Eur J Pain. 2009; 13:263–272. PMID: 18554968.14. Wada R, Tifft CJ, Proia RL. Microglial activation precedes acute neurodegeneration in Sandhoff disease and is suppressed by bone marrow transplantation. Proc Natl Acad Sci U S A. 2000; 97:10954–10959. PMID: 11005868.15. Lehesjoki AE, Koskiniemi M. Progressive myoclonus epilepsy of Unverricht-Lundborg type. Epilepsia. 1999; 40(Suppl 3):23–28.16. Chabas D, Baranzini SE, Mitchell D, Bernard CC, Rittling SR, Denhardt DT, Sobel RA, Lock C, Karpuj M, Pedotti R, Heller R, Oksenberg JR, Steinman L. The influence of the proinflammatory cytokine, osteopontin, on autoimmune demyelinating disease. Science. 2001; 294:1731–1735. PMID: 11721059.17. Lassmann H, Bradl M. Multiple sclerosis: experimental models and reality. Acta Neuropathol. 2017; 133:223–244. PMID: 27766432.18. Sinclair C, Mirakhur M, Kirk J, Farrell M, McQuaid S. Up-regulation of osteopontin and alphaBeta-crystallin in the normalappearing white matter of multiple sclerosis: an immunohistochemical study utilizing tissue microarrays. Neuropathol Appl Neurobiol. 2005; 31:292–303. PMID: 15885066.19. Mirnics K, Middleton FA, Stanwood GD, Lewis DA, Levitt P. Disease-specific changes in regulator of G-protein signaling 4 (RGS4) expression in schizophrenia. Mol Psychiatry. 2001; 6:293–301. PMID: 11326297.20. Mootha VK, Lindgren CM, Eriksson KF, Subramanian A, Sihag S, Lehar J, Puigserver P, Carlsson E, Ridderstrale M, Laurila E, Houstis N, Daly MJ, Patterson N, Mesirov JP, Golub TR, Tamayo P, Spiegelman B, Lander ES, Hirschhorn JN, Altshuler D, Groop LC. PGC-1alpha-responsive genes involved in oxidative phosphorylation are coordinately downregulated in human diabetes. Nat Genet. 2003; 34:267–273. PMID: 12808457.21. Brown CW, Houston-Hawkins DE, Woodruff TK, Matzuk MM. Insertion of Inhbb into the Inhba locus rescues the Inhba-null phenotype and reveals new activin functions. Nat Genet. 2000; 25:453–457. PMID: 10932194.
- Full Text Links
-
- Actions
-
Cited
- CITED
-
- Close
- Share
-
- Similar articles
-
- Activated microglial cells synthesize and secrete AGE-albumin
- Enhancement of Nitric Oxide Production by Corticotropin-releasing Hormone (CRH) in Murine Microglial Cells, BV2
- Antineuroinflammatory Effects of 7,3’,4’-Trihydroxyisoflavone in Lipopolysaccharide-Stimulated BV2 Microglial Cells through MAPK and NF-κB Signaling Suppression
- Big Data: An Overview and Its Applications in Medicine and Aviation
- Gene Expression Analysis of Murine Primary Microglia Stimulated with LPS using Microarray
