Assessment of solid components of borderline ovarian tumor and stage I carcinoma: added value of combined diffusion- and perfusion-weighted magnetic resonance imaging
- Affiliations
-
- 1Department of Radiology, School of Medicine, Kyungpook National University, Daegu, Korea. kimseehyung72@outlook.kr
- KMID: 2460192
- DOI: http://doi.org/10.12701/yujm.2019.00234
Abstract
- BACKGROUND
We sought to determine the value of combining diffusion-weighted (DW) and perfusion-weighted (PW) sequences with a conventional magnetic resonance (MR) sequence to assess solid components of borderline ovarian tumors (BOTs) and stage I carcinomas.
METHODS
Conventional, DW, and PW sequences in the tumor imaging studies of 70 patients (BOTs, n=38; stage I carcinomas, n=32) who underwent surgery with pathologic correlation were assessed. Two independent radiologists calculated the parameters apparent diffusion coefficient (ADC), K(trans) (vessel permeability), and V(e) (cell density) for the solid components. The distribution on conventional MR sequence and mean, standard deviation, and 95% confidence interval of each DW and PW parameter were calculated. The inter-observer agreement among the two radiologists was assessed. Area under the receiver operating characteristic curve (AUC) and multivariate logistic regression were performed to compare the effectiveness of DW and PW sequences for average values and to characterize the diagnostic performance of combined DW and PW sequences.
RESULTS
There were excellent agreements for DW and PW parameters between radiologists. The distributions of ADC, K(trans), and V(e) values were significantly different between BOTs and stage I carcinomas, yielding AUCs of 0.58 and 0.68, 0.78 and 0.82, and 0.70 and 0.72, respectively, with ADC yielding the lowest diagnostic performance. The AUCs of the DW, PW, and combined PW and DW sequences were 0.71±0.05, 0.80±0.05, and 0.85±0.05, respectively.
CONCLUSION
Combining PW and DW sequences to a conventional sequence potentially improves the diagnostic accuracy in the differentiation of BOTs and stage I carcinomas.
MeSH Terms
Figure
-
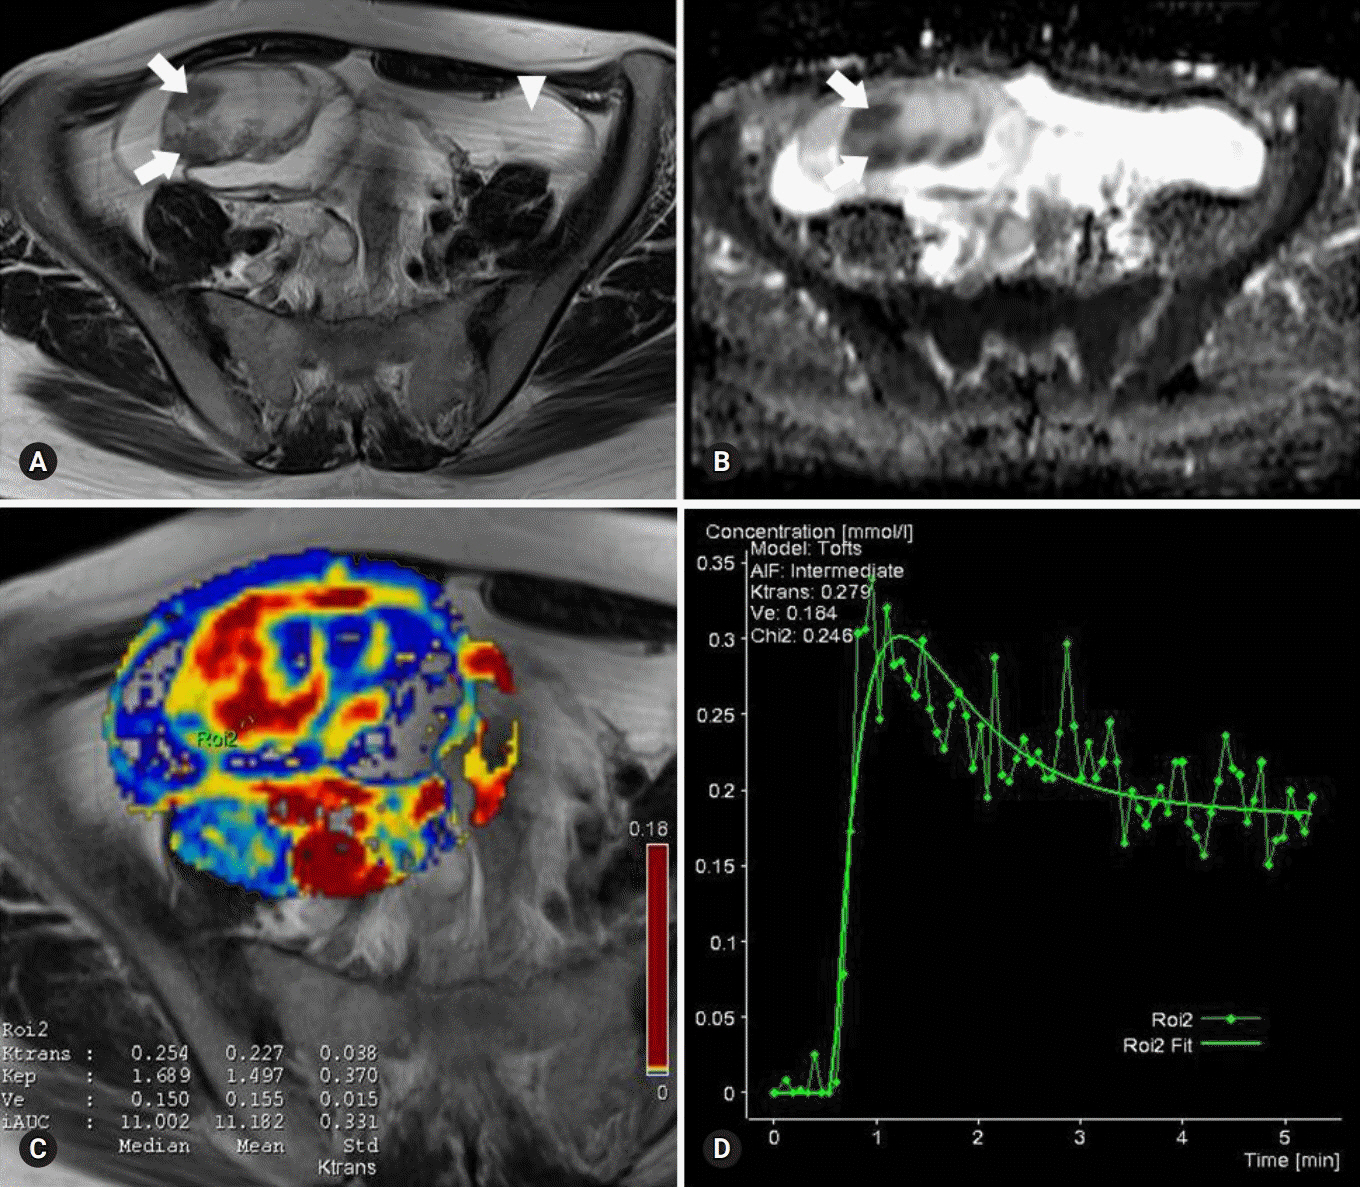
Fig. 1. Images of a serous cystadenoma borderline tumor in a 46-year-old woman. (A) T2-weighted fast spin-echo axial MR image shows a right ovarian tumor with cystic and solid components as solid portions (arrows) with low signal intensity. Ascites (arrowhead) is shown. (B) ADC map obtained at b=1,000 mm2/sec shows restricted diffusion in the solid portions (arrows, measured mean ADC map=1.12×10⁻³ mm2/sec). (C) Ktrans and Ve map color overlain on a T2-weighted MR image shows increased Ktrans and Ve values throughout the solid portions (measured Ktrans and Ve of the ROI2=0.254/min and 0.150). (D) Relative enhancement time fitting curve of the solid component of the borderline tumor is shown. MR, magnetic resonance; ADC, apparent diffusion coefficient; ROI, region of interest.
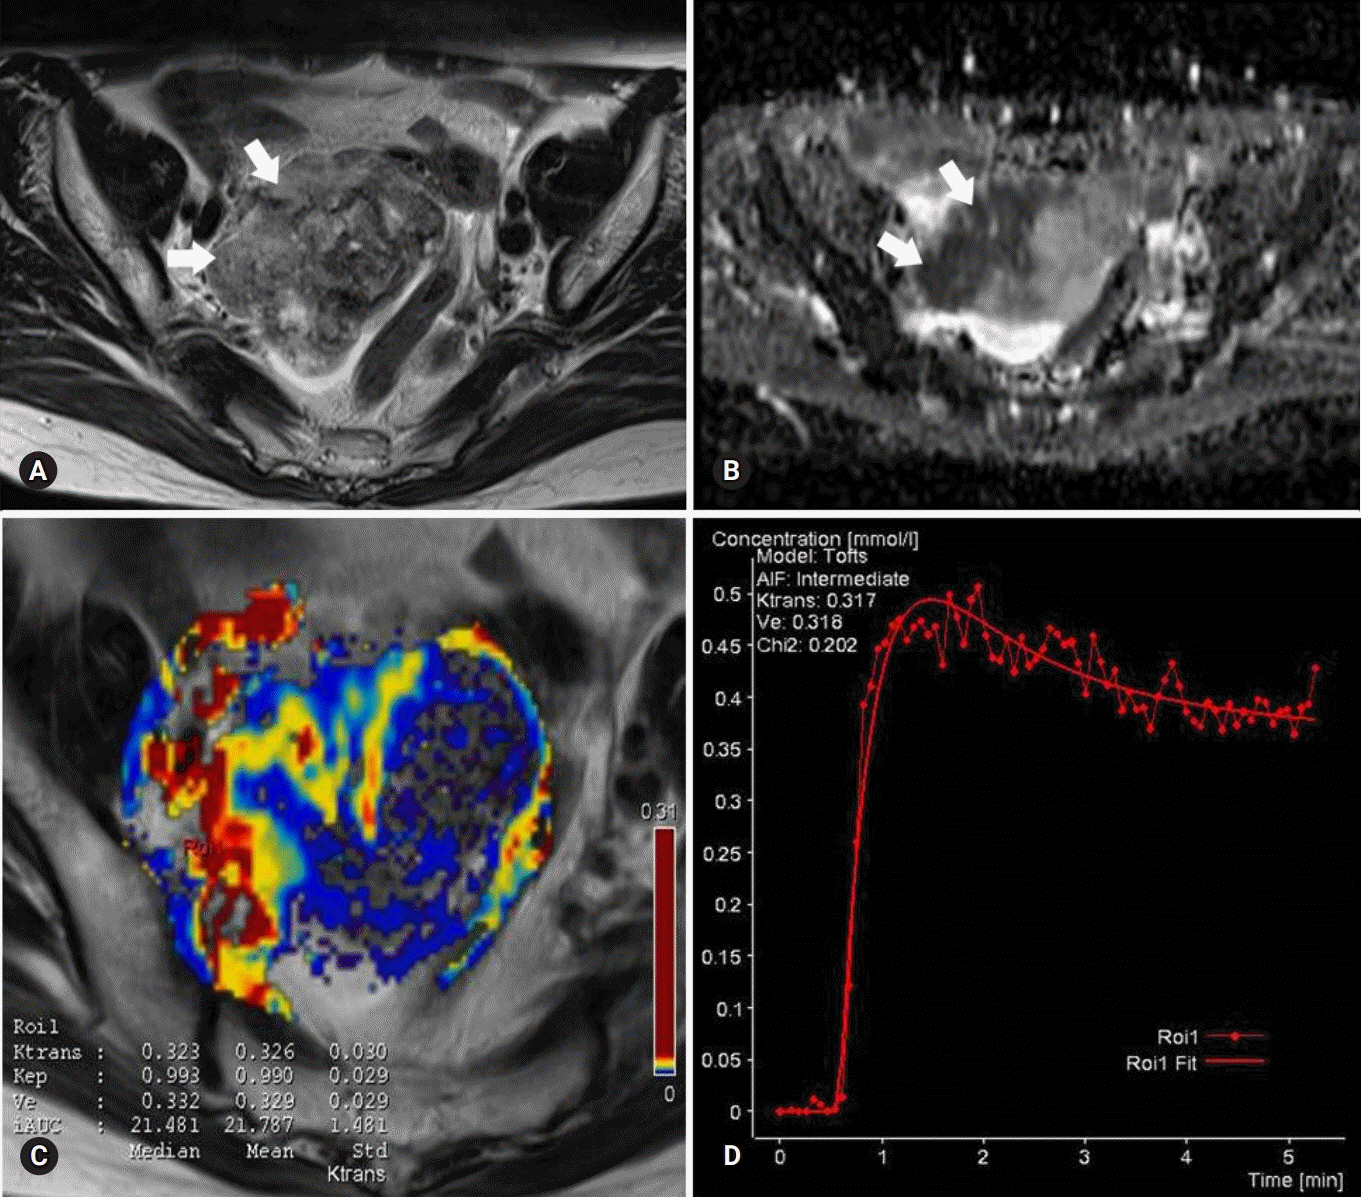
Fig. 2. Images of a stage I serous adenocarcinoma in a 42-year-old woman. (A) T2-weighted fast spin-echo axial MR image shows a right ovarian tumor with predominant solid portions (arrows) with low to intermediate signal intensity. (B) ADC map obtained at b=1,000 mm2/sec shows restricted diffusion in the solid portions (arrows, measured mean ADC map=1.07×10⁻³ mm2/sec). (C) Ktrans and Ve map color overlain on a T2-weighted MR image shows increased Ktrans and Ve values over the area corresponding to the carcinoma (measured Ktrans and Ve of the ROI1=0.323/min and 0.332). (D) Relative enhancement time fitting curve of the solid component of the carcinoma is shown. MR, magnetic resonance; ADC, apparent diffusion coefficient; ROI, region of interest.

Fig. 3. Box and whisker plot of ADC values for borderline tumors and stage I carcinomas. Data box=individual ADC value, horizontal lines=average and associated 95% confidence intervals. ADC, apparent diffusion coefficient.
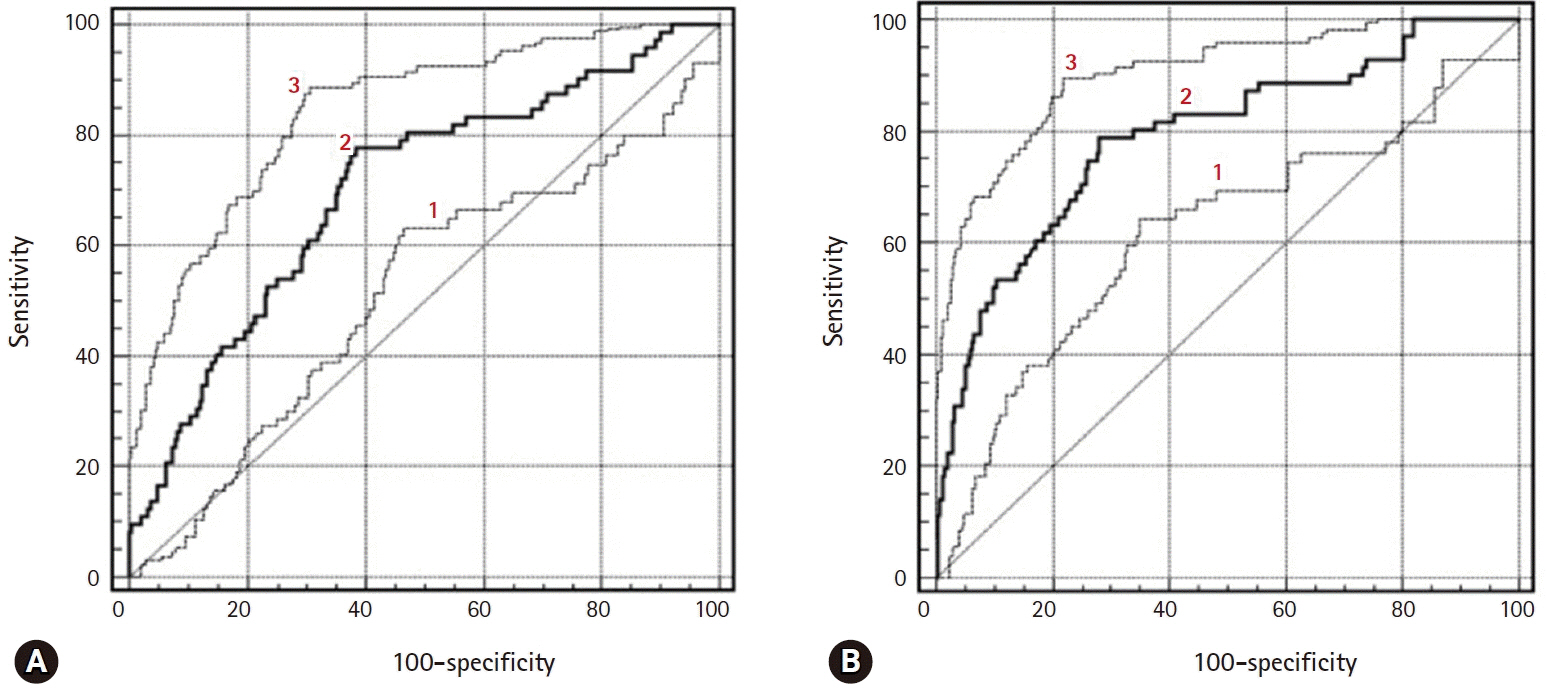
Fig. 4. ROC curves of ADC, Ve, and Ktrans parameters in the differentiation of borderline tumors (A) and stage I carcinomas (B). 1=ADC, 2=Ve, and 3=Ktrans. ROC, receiver operating characteristic; ADC, apparent diffusion coefficient.
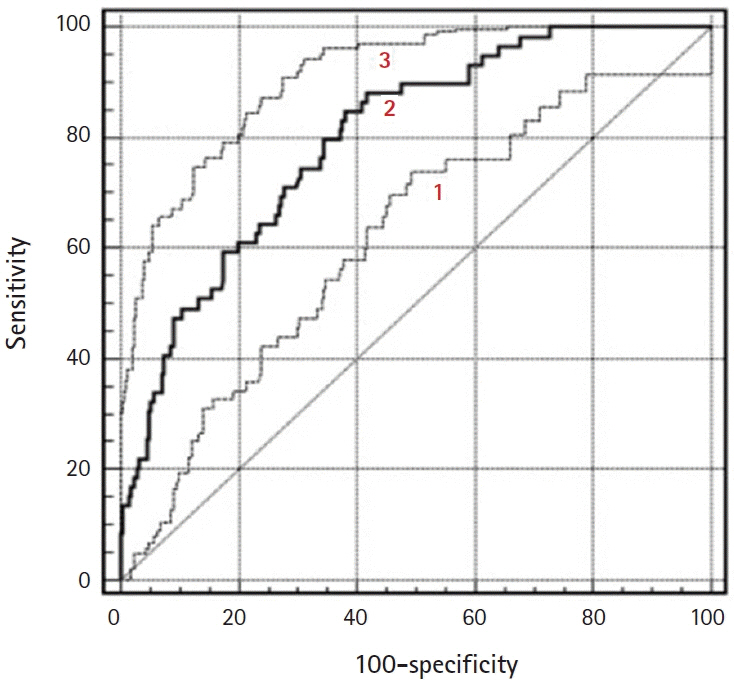
Fig. 5. ROC curves of diagnostic performance for PW sequence, DW sequence, and combining PW and DW sequences to a conventional sequence in the differentiation of borderline tumors and stage I carcinomas. 1=DW sequence only, 2=PW sequence only, and 3=combined PW+DW sequences. ROC, receiver operating characteristic; PW, perfusion-weighted; DW, diffusion-weighted.
Cited by 1 articles
-
Erratum to “Assessment of solid components of borderline ovarian tumor and stage I carcinoma: added value of combined diffusion- and perfusion-weighted magnetic resonance imaging”
See Hyung Kim
Yeungnam Univ J Med. 2020;37(2):147-147. doi: 10.12701/yujm.2019.00234.e1.
Reference
-
References
1. Aref M, Handbury JD, Xiuquan Ji J, Aref S, Wiener EC. Spatial and temporal resolution effects on dynamic contrast-enhanced magnetic resonance mammography. Magn Reson Imaging. 2007; 25:14–34.
Article2. Cuenod CA, Fournier L, Balvay D, Guinebretière JM. Tumor angiogenesis: pathophysiology and implications for contrast-enhanced MRI and CT assessment. Abdom Imaging. 2006; 31:188–93.
Article3. deSouza NM, O'Neill R, McIndoe GA, Dina R, Soutter WP. Borderline tumors of the ovary: CT and MRI features and tumor markers in differentiation from stage I disease. AJR Am J Roentgenol. 2005; 184:999–1003.
Article4. Emoto M, Iwasaki H, Mimura K, Kawarabayashi T, Kikuchi M. Differences in the angiogenesis of benign and malignant ovarian tumors, demonstrated by analyses of color Doppler ultrasound, immunohistochemistry, and microvessel density. Cancer. 1997; 80:899–907.
Article5. Fujii S, Kakite S, Nishihara K, Kanasaki Y, Harada T, Kigawa J, et al. Diagnostic accuracy of diffusion-weighted imaging in differentiating benign from malignant ovarian lesions. J Magn Reson Imaging. 2008; 28:1149–56.
Article6. Hricak H, Chen M, Coakley FV, Kinkel K, Yu KK, Sica G, et al. Complex adnexal masses: detection and characterization with MR imaging--multivariate analysis. Radiology. 2000; 214:39–46.
Article7. Kozlowski P, Chang SD, Jones EC, Berean KW, Chen H, Goldenberg SL. Combined diffusion-weighted and dynamic contrast-enhanced MRI for prostate cancer diagnosis--correlation with biopsy and histopathology. J Magn Reson Imaging. 2006; 24:108–13.
Article8. Landis JR, Koch GG. An application of hierarchical kappa-type statistics in the assessment of majority agreement among multiple observers. Biometrics. 1977; 33:363–74.
Article9. Lee EJ, Kim SH, Kim YH, Lee HJ. Is CA-125 an additional help to radiologic findings for differentiation borderline ovarian tumor from stage I carcinoma? Acta Radiol. 2011; 52:458–62.
Article10. Metz CE, Shen JH. Gains in accuracy from replicated readings of diagnostic images: prediction and assessment in terms of ROC analysis. Med Decis Making. 1992; 12:60–75.
Article11. Metz CE, Pan X. "Proper" binormal ROC curves: theory and maximum-likelihood estimation. J Math Psychol. 1999; 43:1–33.
Article12. Moore RG, Bast RC Jr. How do you distinguish a malignant pelvic mass from a benign pelvic mass? Imaging, biomarkers, or none of the above. J Clin Oncol. 2007; 25:4159–61.
Article13. Nakayama T, Yoshimitsu K, Irie H, Aibe H, Tajima T, Nishie A, et al. Diffusion-weighted echo-planar MR imaging and ADC mapping in the differential diagnosis of ovarian cystic masses: usefulness of detecting keratinoid substances in mature cystic teratomas. J Magn Reson Imaging. 2005; 22:271–8.
Article14. Timmerman D, Valentin L, Bourne TH, Collins WP, Verrelst H, Vergote I, et al. Terms, definitions and measurements to describe the sonographic features of adnexal tumors: a consensus opinion from the International Ovarian Tumor Analysis (IOTA) Group. Ultrasound Obstet Gynecol. 2000; 16:500–5.
Article15. Sohaib SA, Sahdev A, Van Trappen P, Jacobs IJ, Reznek RH. Characterization of adnexal mass lesions on MR imaging. AJR Am J Roentgenol. 2003; 180:1297–304.
Article16. Thomassin-Naggara I, Daraï E, Cuenod CA, Rouzier R, Callard P, Bazot M. Dynamic contrast-enhanced magnetic resonance imaging: a useful tool for characterizing ovarian epithelial tumors. J Magn Reson Imaging. 2008; 28:111–20.
Article17. Thomassin-Naggara I, Bazot M, Daraï E, Callard P, Thomassin J, Cuenod CA. Epithelial ovarian tumors: value of dynamic contrast-enhanced MR imaging and correlation with tumor angiogenesis. Radiology. 2008; 248:148–59.
Article18. Thomassin-Naggara I, Daraï E, Cuenod CA, Fournier L, Toussaint I, Marsault C, et al. Contribution of diffusion-weighted MR imaging for predicting benignity of complex adnexal masses. Eur Radiol. 2009; 19:1544–52.
Article19. Nishida N, Yano H, Komai K, Nishida T, Kamura T, Kojiro M. Vascular endothelial growth factor C and vascular endothelial growth factor receptor 2 are related closely to the prognosis of patients with ovarian carcinoma. Cancer. 2004; 101:1364–74.
Article20. Orre M, Lotfi-Miri M, Mamers P, Rogers PA. Increased microvessel density in mucinous compared with malignant serous and benign tumours of the ovary. Br J Cancer. 1998; 77:2204–9.
Article21. Oto A, Kayhan A, Jiang Y, Tretiakova M, Yang C, Antic T, et al. Prostate cancer: differentiation of central gland cancer from benign prostatic hyperplasia by using diffusion-weighted and dynamic contrast-enhanced MR imaging. Radiology. 2010; 257:715–23.
Article22. Padhani AR, Dzik-Jurasz A. Perfusion MR imaging of extracranial tumor angiogenesis. Top Magn Reson Imaging. 2004; 15:41–57.
Article23. Song T, Laine AF, Chen Q, Rusinek H, Bokacheva L, Lim RP, et al. Optimal k-space sampling for dynamic contrast-enhanced MRI with an application to MR renography. Magn Reson Med. 2009; 61:1242–8.24. Takemori M, Nishimura R, Hasegawa K. Clinical evaluation of MRI in the diagnosis of borderline ovarian tumors. Acta Obstet Gynecol Scand. 2002; 81:157–61.
Article25. Takeuchi M, Matsuzaki K, Nishitani H. Diffusion-weighted magnetic resonance imaging of ovarian tumors: differentiation of benign and malignant solid components of ovarian masses. J Comput Assist Tomogr. 2010; 34:173–6.26. Yankeelov TE, Lepage M, Chakravarthy A, Broome EE, Niermann KJ, Kelley MC, et al. Integration of quantitative DCE-MRI and ADC mapping to monitor treatment response in human breast cancer: initial results. Magn Reson Imaging. 2007; 25:1–13.
Article
- Full Text Links
-
- Actions
-
Cited
- CITED
-
- Close
- Share
-
- Similar articles
-
- Erratum to “Assessment of solid components of borderline ovarian tumor and stage I carcinoma: added value of combined diffusion- and perfusion-weighted magnetic resonance imaging”
- Current Applications and Future Perspectives of Brain Tumor Imaging
- Adnexal Masses: Clinical Application of Multiparametric MR Imaging & O-RADS MRI
- Usefulness of Apparent Diffusion Coefficient in Ovarian Cystic Tumors Using Diffusion-Weighted Magnetic Resonance Imaging
- Advanced Magnetic Resonance Imaging for Pediatric Brain Tumors: Current Imaging Techniques and Interpretation Algorithms
