Assessing the Optimal Cutpoint for Tumor Size in Patients with Lung Cancer Based on Linear Rank Statistics in a Competing Risks Framework
- Affiliations
-
- 1Department of Applied Statistics, University of Suwon, Suwon, Korea.
- 2Department of Statistical Science, Southern Methodist University, Dallas, TX, USA.
- 3Department of Applied Mathematics, Hanyang University, Ansan, Korea. seong@hanyang.ac.kr
- KMID: 2446956
- DOI: http://doi.org/10.3349/ymj.2019.60.6.517
Abstract
- PURPOSE
In clinical studies, patients may experience several types of events during follow up under the competing risks (CR) framework. Patients are often classified into low- and high-risk groups based on prognostic factors. We propose a method to determine an optimal cutpoint value for prognostic factors on censored outcomes in the presence of CR.
MATERIALS AND METHODS
We applied our method to data collected in a study of lung cancer patients. From September 1, 1991 to December 31, 2005, 758 lung cancer patients received tumor removal surgery at Samsung Medical Center in Korea. The proposed statistic converges in distribution to that of the supremum of a standardized Brownian bridge. To overcome the conservativeness of the test based on an approximation of the asymptotic distribution, we also propose a permutation test based on permuted samples.
RESULTS
Most cases considered in our simulation studies showed that the permutation-based test satisfied a significance level of 0.05, while the approximation-based test was very conservative: the powers of the former were larger than those of the latter. The optimal cutpoint value for tumor size (unit: cm) prior to surgery for classifying patients into two groups (low and high risks for relapse) was found to be 1.8, with decent significance reflected as p values less than 0.001.
CONCLUSION
The cutpoint estimator based on the maximally selected linear rank statistic was reasonable in terms of bias and standard deviation in the CR framework. The permutation-based test well satisfied type I error probability and provided higher power than the approximation-based test.
Keyword
Figure
-
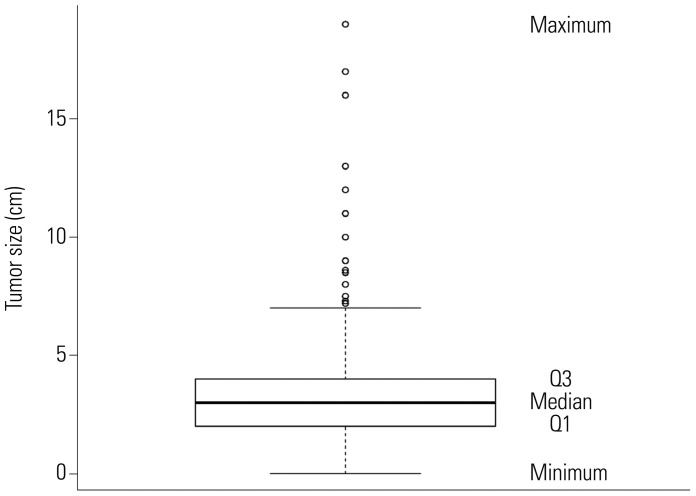
Fig. 1 Box plot of tumor size with the five numbers.
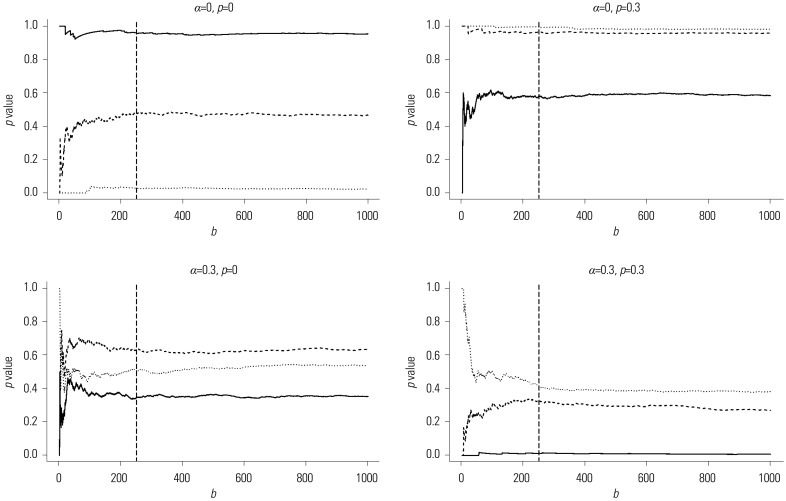
Fig. 2 Empirical p values of the proposed test Q(ε1,ε2) calculated from a simulated sample against the number of permutation times b for four combinations of α and p under H0:β=0 when ε1=0.1 and ε2=0.9: solid line for n=50, dashed line for n=100, dotted line for n=200, and the long-dashed vertical line at the 250th permutation time.
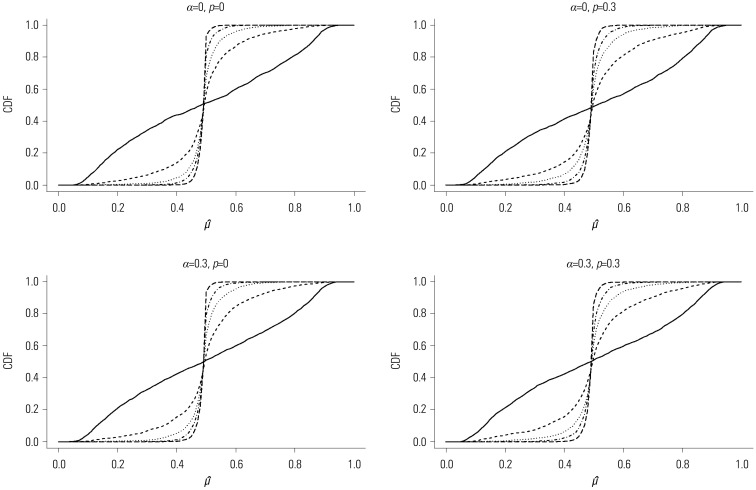
Fig. 3 Empirical distribution function (CDF) of the cutpoint estimator μ̂ for the combinations of α and p when n=100: the solid line for β=0, the dashed line for β=1, the dotted line for β=1.5, the dotted and dashed line for β=2, and the long-dashed line for β=3. CDF, cumulative distribution function.
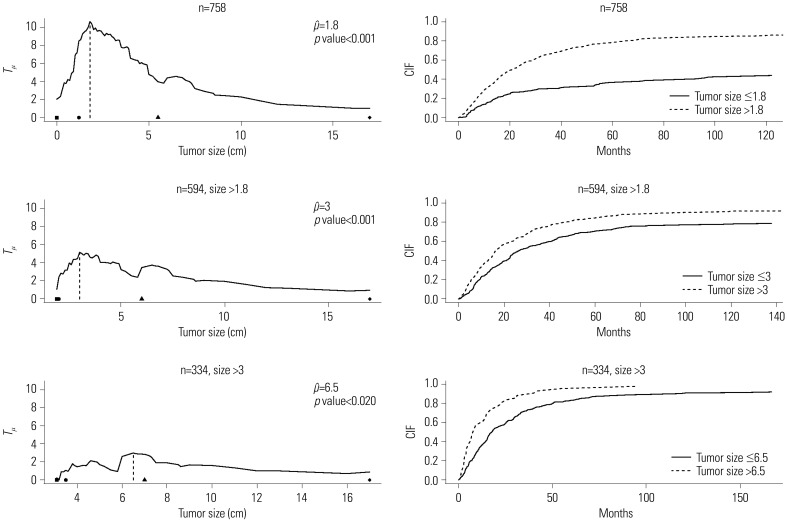
Fig. 4 Plot of standardized linear rank statistic and cumulative incidence function (CIFs) of two groups classified depending on the estimated cutpoint. Left panel: standardized linear rank statistic Tµ against tumor size (solid line), estimated cutpoint (dashed line), and the 1st, 10th, 90th, and 99th quantile points of tumor size of each sub-sample (black square, black circle, black triangle, and black diamond in order). Right panel: CIF for the event time of interest of two groups, ≤ and > μ̂.
Reference
-
1. Lausen B, Schumacher M. Maximally selected rank statistics. Biometrics. 1992; 48:73–85.
Article2. Lausen B, Schumacher M. Evaluating the effect of optimized cutoff values in the assessment of prognostic factors. Comput Stat Data Anal. 1996; 21:307–326.
Article3. Contal C, O'Quigley J. An application of changepoint methods in studying the effect of age on survival in breast cancer. Comput Stat Data Anal. 1999; 30:253–270.
Article4. Klein JP, Moeschberger ML. Survival analysis: techniques for censored and truncated data. 2nd ed. New York: Spinger;2003.5. Lausen B, Hothorn T, Bretz F, Schumacher M. Assessment of optimal selected prognostic factors. Biometr J. 2004; 46:364–374.
Article6. Woo SK, Kim S, Kim J. Determining cutoff values of prognostic factors in survival data with competing risks. Computat Stat. 2016; 31:369–386.
Article7. Gray RJ. A class of K-sample tests for comparing the cumulative incidence of a competing risk. Ann Stat. 1988; 16:1141–1154.
Article8. Pintilie M. Competing risks: a practical perspective. New York: Wiley;2006.9. Billingsley P. Convergence of probability measures. 2nd ed. New York: Wiley;1999.10. Kaplan EL, Meier P. Nonparametric estimation from incomplete observations. J Am Stat Assoc. 1958; 53:457–481.
Article11. Hájek J, Šidák Z, Sen PK. Theory of rank tests. 2nd ed. London: Academic Press;1999.12. Miller R, Siegmund D. Maximally selected chi square statistics. Biometrics. 1982; 38:1011–1016.
Article13. Kotz S, Balakrishnan N, Johnson NL. Continuous multivariate distributions, vol. 1: models and applications. 2nd ed. New York: Wiley;2000.14. Rubinstein RY, Kroese DP. Simulation and the Monte Carlo method. 2nd ed. Hoboken (NJ): John Wiley & Sons;2008.15. Fine JP, Gray RJ. A Proportional hazards model for the subdistribution of a competing risk. J Am Stat Assoc. 1999; 94:496–509.
Article
- Full Text Links
-
- Actions
-
Cited
- CITED
-
- Close
- Share
-
- Similar articles
-
- Cause-specific mortality rate of ovarian cancer in the presence of competing risks of death: a nationwide population-based cohort study
- Competing Risk Model in Survival Analysis
- Cause of death and cause-specific mortality for primary liver cancer in South Korea: A nationwide population-based study in hepatitis B virus-endemic area
- The ceRNA network of lncRNA and miRNA in lung cancer
- Temporal Changes of Lung Cancer Mortality in Korea
