Competing Risk Model in Survival Analysis
- Affiliations
-
- 1Department of Statistics, School of Medicine, Kyungpook National University, Daegu, Korea
- KMID: 2536953
- DOI: http://doi.org/10.36011/cpp.2020.2.e11
Abstract
- Survival analysis is primarily used to identify the time-to-event for events of interest. However, there subjects may undergo several outcomes; competing risks occur when other events may affect the incidence rate of the event of interest. In the presence of competing risks, traditional survival analysis such as the Kaplan-Meier method or the Cox proportional hazard regression introduces biases into the estimation of survival probability. In this review, we discuss several methods that can be used to consider competing risks in survival analysis: the cumulative incidence function, the cause-specific hazard function, and Fine and Gray's Subdistribution hazard function. We also provide a guide for conducting competing risk analysis using SAS with the bone marrow transplantation dataset presented by Klein and Moeschberger (1997).
Figure
-

Figure 1. Overview of the calculation of the CSH. The risk set starts with 30 individuals (solid circles). Over time, individuals either experience event 1 (squares) or event 2 (triangles). As individuals experience either event, they are removed from the remaining risk sets. The calculation for the cause-specific hazard is given at the bottom of the figure from Lau et al.9)CSH = cause-specific hazard.

Figure 2. Overview of the calculation of the SDH. The risk set starts with 30 individuals (solid circles). Over time, individuals either experience event 1 (squares) or event 2 (triangles). When individuals experience a competing event (event 2, triangles), they are maintained in the risk set as triangles. Thus, over time, a greater proportion of the risk set becomes full of triangles, which represent individuals who have experienced the competing event prior to that time. The SDH for event 1 is given near the bottom of the figure along with the CSH for event 1 for comparison. Note that because individuals are maintained in the risk set, the SDH tends to be lower than the CSH from Lau et al.9)CSH = cause-specific hazard; SDH = subdistribution hazard.
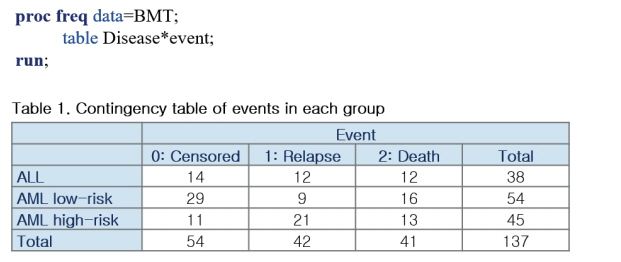
Figure 3. SAS example (1).ALL = acute lymphoblastic leukemia; AML = acute myelocytic leukemia; BMT = bone marrow transplantation.
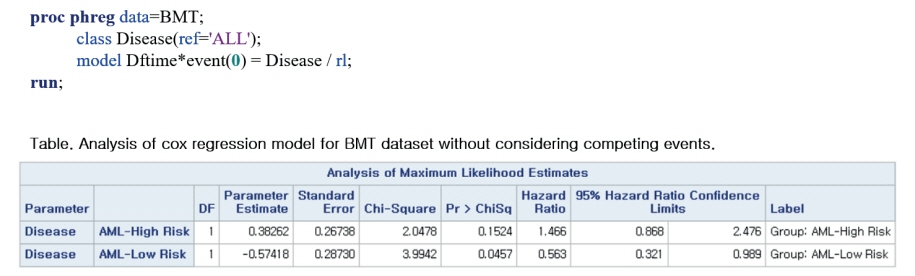
Figure 4. SAS example (2).AML = acute myelocytic leukemia; BMT = bone marrow transplantation.
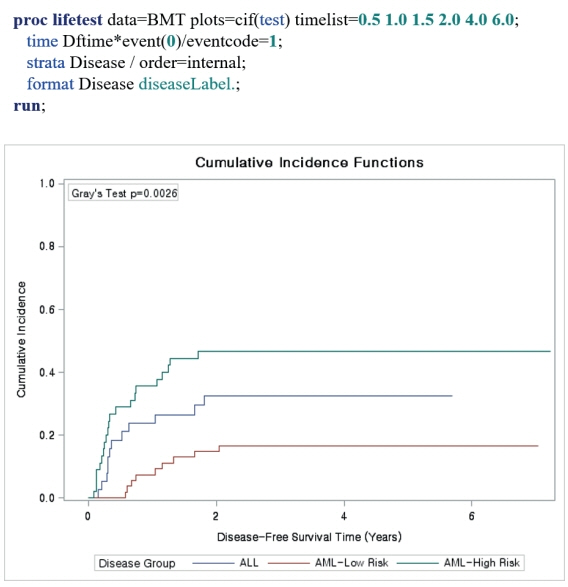
Figure 5. SAS example (3).ALL = acute lymphoblastic leukemia; AML = acute myelocytic leukemia; BMT = bone marrow transplantation.
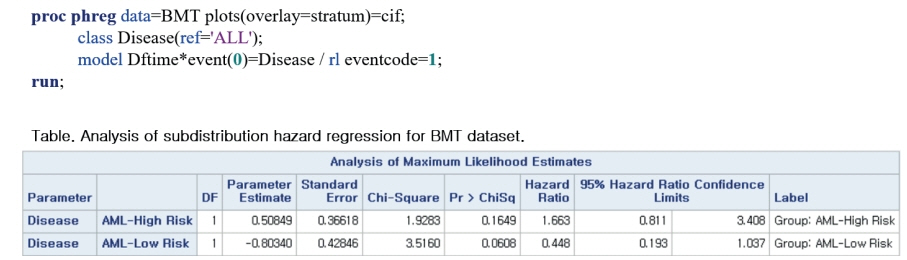
Figure 6. SAS example (4).AML = acute myelocytic leukemia; BMT = bone marrow transplantation.
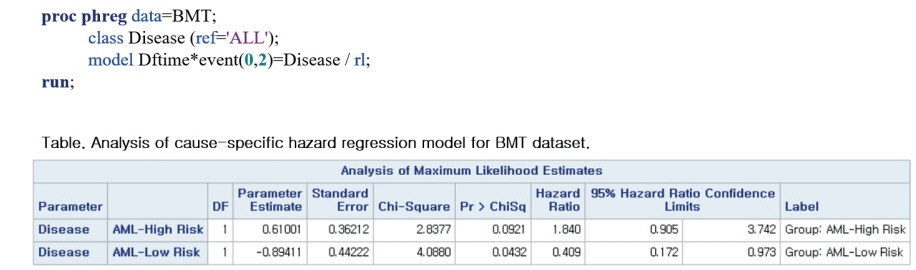
Figure 7. SAS example (5).AML = acute myelocytic leukemia; BMT = bone marrow transplantation.
Reference
-
1. Abdel-Qadir H, Fang J, Lee DS, Tu JV, Amir E, Austin PC, Anderson GM. Importance of considering competing risks in time-to-event analyses: application to stroke risk in a retrospective cohort study of elderly patients with atrial fibrillation. Circ Cardiovasc Qual Outcomes. 2018; 11:e004580.2. Glynn RJ, Rosner B. Comparison of risk factors for the competing risks of coronary heart disease, stroke, and venous thromboembolism. Am J Epidemiol. 2005; 162:975–82.
Article3. Feakins BG, McFadden EC, Farmer AJ, Stevens RJ. Standard and competing risk analysis of the effect of albuminuria on cardiovascular and cancer mortality in patients with type 2 diabetes mellitus. Diagn Progn Res. 2018; 2:13.
Article4. Wolbers M, Koller MT, Witteman JC, Steyerberg EW. Prognostic models with competing risks: methods and application to coronary risk prediction. Epidemiology. 2009; 20:555–61.5. Austin PC, Lee DS, Fine JP. Introduction to the analysis of survival data in the presence of competing risks. Circulation. 2016; 133:601–9.
Article6. Fine JP, Gray RJ. A proportional hazards model for the subdistribution of a competing risk. J Am Stat Assoc. 1999; 94:496–509.
Article7. Austin PC, Fine JP. Practical recommendations for reporting Fine-Gray model analyses for competing risk data. Stat Med. 2017; 36:4391–400.
Article8. Fanaroff AC, Roe MT, Clare RM, Lokhnygina Y, Navar AM, Giugliano RP, Wiviott SD, Tershakovec AM, Braunwald E, Blazing MA. Competing risks of cardiovascular versus noncardiovascular death during long-term follow-up after acute coronary syndromes. J Am Heart Assoc. 2017; 6:e005840.
Article9. Huebner M, Wolkewitz M, Enriquez-Sarano M, Schumacher M. Competing risks need to be considered in survival analysis models for cardiovascular outcomes. J Thorac Cardiovasc Surg. 2017; 153:1427–31.
Article10. Warnock DG. Competing risks: you only die once. Nephrol Dial Transplant. 2016; 31:1033–5.
Article11. Noordzij M, Leffondré K, van Stralen KJ, Zoccali C, Dekker FW, Jager KJ. When do we need competing risks methods for survival analysis in nephrology? Nephrol Dial Transplant. 2013; 28:2670–7.
Article12. Lau B, Cole SR, Gange SJ. Competing risk regression models for epidemiologic data. Am J Epidemiol. 2009; 170:244–56.
Article13. Klein JP, Moeschberger ML. Survival Analysis: Techniques for Censored and Truncated Data. New York, NY: Springer;1997.
- Full Text Links
-
- Actions
-
Cited
- CITED
-
- Close
- Share
-
- Similar articles
-
- The trend and outcome of postsurgical therapy for high-risk early-stage cervical cancer with lymph node metastasis in Japan: a report from the Japan Society of Gynecologic Oncology (JSGO) guidelines evaluation committee
- Economic Factors as Major Determinants of Ustekinumab Drug Survival of Patients with Chronic Plaque Psoriasis in Korea
- Comparison of New-Onset Diabetes Mellitus among Patients with Atrial Fibrillation or Atrial Flutter
- Development of a Stroke Prediction Model for Korean
- Resolution of hypertension after kidney transplantation is associated with better graft and patient survival in recipients with pretransplant hypertension
