Downward bias of conductivity based point-of-care hemoglobin measurement compared with optical methods
- Affiliations
-
- 1Department of Anesthesiology and Pain Medicine, Inje University Ilsan Paik Hospital, Goyang, Korea. ishmael1@naver.com
- 2Department of Anesthesiology and Pain Medicine, Inje University Seoul Paik Hospital, Seoul, Korea.
- KMID: 2436043
- DOI: http://doi.org/10.17085/apm.2018.13.3.323
Abstract
- BACKGROUND
Point-of-care (POC) arterial blood gas analysis (ABGA) is widely used for checking hemoglobin (Hb) level. However, there is the tendency of downward bias of conductivity-based POC ABGA Hb measurement compared with optical methods. Authors tried to correct that bias by linear regression equation.
METHODS
We retrospectively collected a total of 86 Hb result pairs during surgeries. Hb measured by the Sysmex XE-2100 in the laboratory was set as the gold standard and was compared with that measured by the GEM Premier 3500. Data were compared using the Bland-Altman analysis, the reliability of transfusion decision was assessed using three-zone error grid. The linear regression analysis was performed to find out the relation between the Hb results of POC ABGA and those of laboratory based test.
RESULTS
The bias of the Hb measured between Sysmex XE-2100 and GEM Premier 3500 was −0.9 g/dl (P < 0.001, 95% confidence interval, −1.038 to −0.665 g/dl). The percentage error was 16.4%. According to error grid methodology, zone A, B and C encompassed 89.5%, 10.5% and 0% of data pairs. After adjusting the POC ABGA Hb values, the bias of the Hb measured by two methods was 0 g/dl (P = 0.991). The percentage error was 18.2%. The zone A, B and C encompassed 91.9%, 8.1% and 0% of data pairs.
CONCLUSIONS
Hb measurements obtained with reference to conductivity via a POC ABGA were significantly lower than those obtained via optical methods. This bias may deserve attention of anesthesiologists when POC ABGA Hb level is used as a transfusion guideline.
MeSH Terms
Figure
-

Fig. 1 Bland-Altman plot of difference between ABGA measured hemoglobin and laboratory measured hemoglobin. Solid line: bias = −0.9 g/dl, Dashed lines: the upper and lower limits of agreement (1.96 times the SD). ABGA Hb: arterial blood gas analysis measured hemoglobin, Lab Hb: laboratory measured hemoglobin, SD: standard deviation.

Fig. 2 Paired hemoglobin values provided by laboratory measured hemoglobin and ABGA measured hemoglobin plotted using three zones error grid. Zone A represents the area of clinical acceptable difference, zone B represents the area of significant errors, although their magnitude is not as significant as in zone C which represents the area of major therapeutic errors leading to unnecessary or delayed transfusion. Zone A, B and C encompassed 89.5% (95% confidence interval [CI], 81.1%–95.1%), 10.5% (95% CI, 4.9%–18.9%) and 0% (95% CI, 0%–4.2%) of data pairs. ABGA Hb: arterial blood gas analysis measured hemoglobin, Lab Hb: laboratory measured hemoglobin.
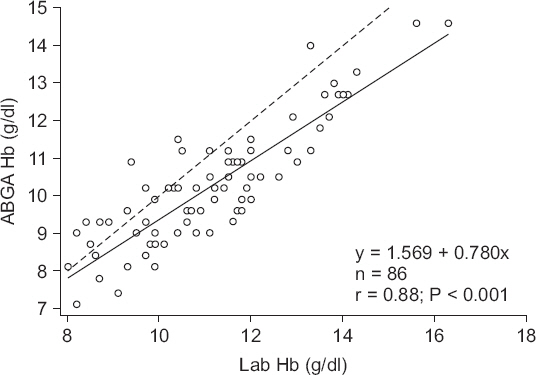
Fig. 3 Scatter plot of the laboratory measured hemoglobin and ABGA measured hemoglobin. Solid line: linear regression graph, Dashed line: y = x. ABGA Hb: arterial blood gas analysis measured hemoglobin, Lab Hb: laboratory measured hemoglobin.
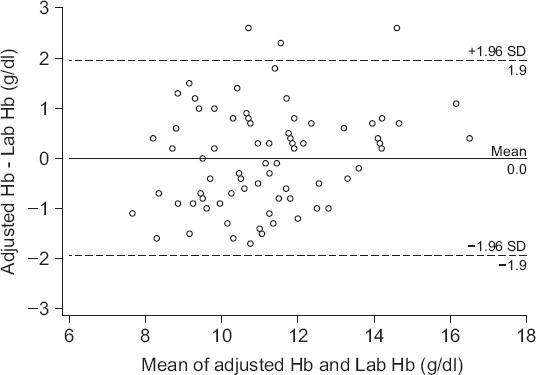
Fig. 4 Bland-Altman plot of difference between adjusted hemoglobin and laboratory measured hemoglobin. Solid line: bias = 0 g/dl, Dashed line: the upper and lower limits of agreement (1.96 times the SD). Adjusted Hb: hemoglobin adjusted by linear regression graph, Lab Hb: laboratory measured hemoglobin, SD: standard deviation.

Fig. 5 Paired hemoglobin values provided by laboratory hemoglobin and adjusted hemoglobin plotted using three zones error grid. Zone A, B and C encompassed 91.9% (95% confidence interval [CI], 83.9%–96.7%), 8.1% (95% CI, 3.3%–16.1%) and 0% (95% CI, 0%–4.2%) of data pairs. Adjusted Hb: hemoglobin adjusted by linear regression graph, Lab Hb: laboratory measured hemoglobin.
Reference
-
1. Wu P, Morey TE, Harris NS, Gravenstein N, Rice MJ. Intravenous fluids cause systemic bias in a conductivity-based point-of-care hematocrit meter. Anesth Analg. 2012; 114:314–21. DOI: 10.1213/ANE.0b013e31823fecbd. PMID: 22156329.2. Steinfelder-Visscher J, Weerwind PW, Teerenstra S, Pop GA, Brouwer RM. Conductivity-based hematocrit measurement during cardiopulmonary bypass. J Clin Monit Comput. 2007; 21:7–12. DOI: 10.1007/s10877-006-9052-x. PMID: 17086448.3. Hopfer SM, Nadeau FL, Sundra M, Makowski GS. Effect of protein on hemoglobin and hematocrit assays with a conductivity-based point-of-care testing device: comparison with optical methods. Ann Clin Lab Sci. 2004; 34:75–82. PMID: 15038671.4. Myers GJ, Browne J. Point of care hematocrit and hemoglobin in cardiac surgery: a review. Perfusion. 2007; 22:179–83. DOI: 10.1177/0267659107080826. PMID: 18018397.5. Critchley LA, Critchley JA. A meta-analysis of studies using bias and precision statistics to compare cardiac output measurement techniques. J Clin Monit Comput. 1999; 15:85–91. DOI: 10.1023/A:1009982611386.6. Morey TE, Gravenstein N, Rice MJ. Let's think clinically instead of mathematically about device accuracy. Anesth Analg. 2011; 113:89–91. DOI: 10.1213/ANE.0b013e318219a290. PMID: 21519048.7. Brown LD, Cai TT, DasGupta A. Interval estimation for a binomial proportion. Statist Sci. 2001; 16:101–33. DOI: 10.1214/ss/1009213286.8. Bénéteau-Burnat B, Bocque MC, Lorin A, Martin C, Vaubourdolle M. Evaluation of the blood gas analyzer Gem PREMIER 3000. Clin Chem Lab Med. 2004; 42:96–101. DOI: 10.1515/CCLM.2004.018. PMID: 15061388.9. Visser KR. Electric conductivity of stationary and flowing human blood at low frequencies. Med Biol Eng Comput. 1992; 30:636–40. DOI: 10.1007/BF02446796. PMID: 1297019.10. Steinfelder-Visscher J, Weerwind PW, Teerenstra S, Brouwer MH. Reliability of point-of-care hematocrit, blood gas, electrolyte, lactate and glucose measurement during cardiopulmonary bypass. Perfusion. 2006; 21:33–7. DOI: 10.1191/0267659106pf846oa. PMID: 16485697.11. Garrioch SS, Gillies MA. Which intravenous fluid for the surgical patient? Curr Opin Crit Care. 2015; 21:358–63. DOI: 10.1097/MCC.0000000000000222. PMID: 26103146.
- Full Text Links
-
- Actions
-
Cited
- CITED
-
- Close
- Share
-
- Similar articles
-
- The Ocular Electrical Conductivity by Vitreous Substitutes in rabbits
- A Study on Misclassification Arising from Random Error in Exposure Measurement
- Cellular Hemoglobin Is a Useful Alternative Parameter when Lipemia Interferes with Hemoglobin Measurement
- Comparing the Efficacy of Samsung LABGEO PT10 and Bio-Rad Variant II Turbo for HbA1c Measurement in Three Types of Blood Samples
- Principle, Development, and Application of Electrical Conductivity Mapping Using Magnetic Resonance Imaging
