Reference Values of Body Composition Indices: The Korean National Health and Nutrition Examination Surveys
- Affiliations
-
- 1Department of Pediatrics, Konkuk University Medical Center, Seoul, Korea. scchung@kuh.ac.kr
- 2Konkuk University School of Medicine, Seoul, Korea.
- 3Department of Sports Medicine, Soonchunhyang University, Asan, Korea.
- 4Department of Physical Education, Korea National University of Education, Seoul, Korea.
- KMID: 2352794
- DOI: http://doi.org/10.3349/ymj.2015.56.1.95
Abstract
- PURPOSE
An increase in the prevalence of obesity has been observed in children and adolescents. As remarkable changes in body composition occur with growth during the adolescent period, it is important that changes in body composition be monitored. The purpose of this study was to propose reference percentile values for body composition indices including body mass index (BMI) in children and adolescents in Korea.
MATERIALS AND METHODS
This study was performed using data from the Fourth and Fifth Korea National Health and Nutrition Examination Surveys. Body composition data were obtained using dual-energy X-ray absorptiometry. The percentile curves of body composition indices were constructed by the LMS method.
RESULTS
A total of 2123 children and adolescents between the ages of 10 and 19 years were included in this study. We obtained the percentile curves for BMI and body composition indices.
CONCLUSION
The reference values for body composition from this study could help with assessing body composition in Korean adolescents.
MeSH Terms
Figure
-
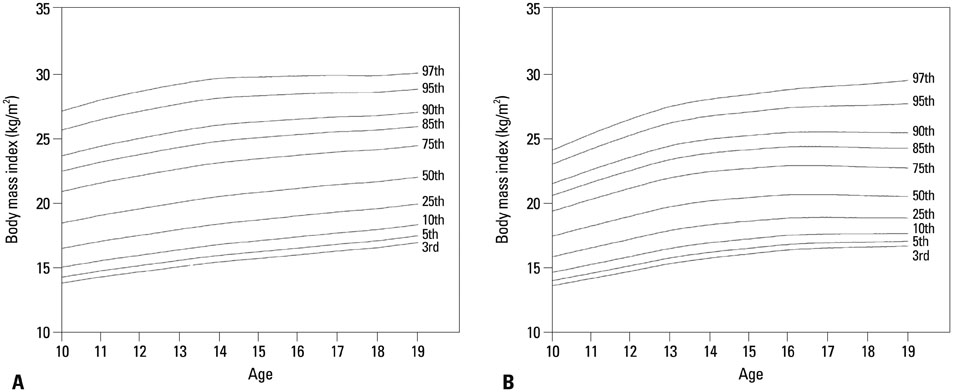
Fig. 1 Smoothed LMS percentile curves for body mass index in both genders. Curves are for the 3rd, 5th, 10th, 25th, 50th, 75th, 85th, 90th, 95th, and 97th percentiles for body mass index (kg/m2) in male (A) and female (B) adolescents. The LMS parameters are the skewness (L), median (M), and coefficient of variation (S).
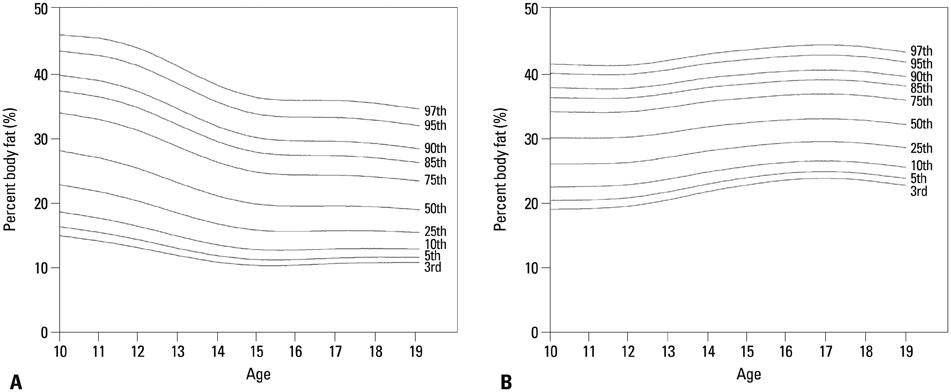
Fig. 2 Smoothed LMS percentile curves for percent body fat in both genders. Curves are for the 3rd, 5th, 10th, 25th, 50th, 75th, 85th, 90th, 95th, and 97th percentiles for percent body fat (%) in male (A) and female (B) adolescents. The LMS parameters are the skewness (L), median (M), and coefficient of variation (S).
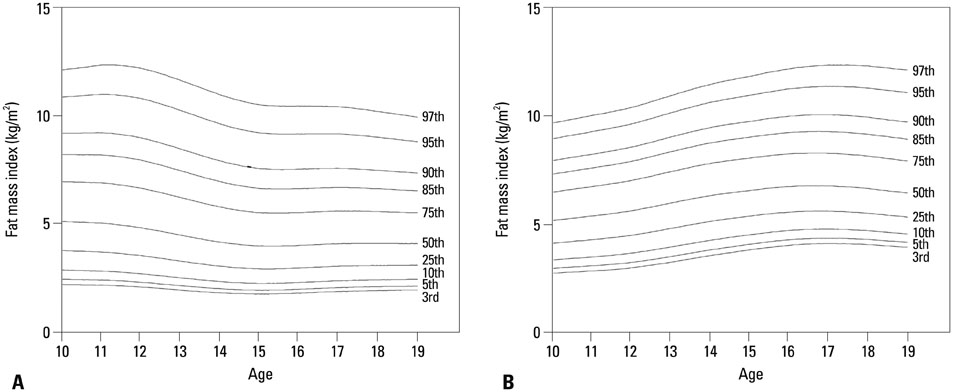
Fig. 3 Smoothed LMS percentile curves for fat mass index in both genders. Curves are for the 3rd, 5th, 10th, 25th, 50th, 75th, 85th, 90th, 95th, and 97th percentiles for fat mass index (kg/m2) in male (A) and female (B) adolescents. The LMS parameters are the skewness (L), median (M), and coefficient of variation (S).
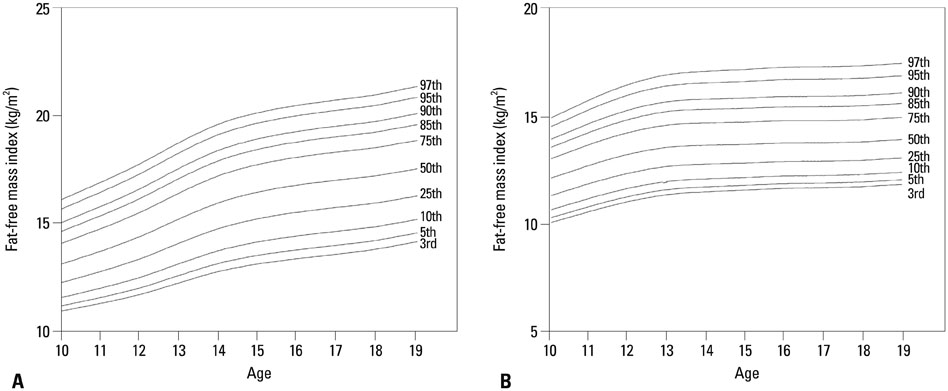
Fig. 4 Smoothed LMS percentile curves for fat-free mass index in both genders. Curves are for the 3rd, 5th, 10th, 25th, 50th, 75th, 85th, 90th, 95th, and 97th percentiles for fat-free mass index (kg/m2) in male (A) and female (B) adolescents. The LMS parameters are the skewness (L), median (M), and coefficient of variation (S).
Cited by 4 articles
-
Management of childhood obesity
Shin-Hye Kim, Mi-Jung Park
J Korean Med Assoc. 2017;60(3):233-241. doi: 10.5124/jkma.2017.60.3.233.Therapeutic approaches to obesity and metabolic syndrome in children and adolescents
Sochung Chung
J Korean Med Assoc. 2018;61(10):599-606. doi: 10.5124/jkma.2018.61.10.599.Body mass index and body composition scaling to height in children and adolescent
Sochung Chung
Ann Pediatr Endocrinol Metab. 2015;20(3):125-129. doi: 10.6065/apem.2015.20.3.125.Application of body composition zones in boys with nonalcoholic fatty liver disease
Minhye Choi, Seonhwa Lee, Sun Hwan Bae, Sochung Chung
Ann Pediatr Endocrinol Metab. 2019;24(4):243-247. doi: 10.6065/apem.2019.24.4.243.
Reference
-
1. Chan C. Childhood obesity and adverse health effects in Hong Kong. Obes Rev. 2008; 9:Suppl 1. 87–90.
Article2. Han JC, Lawlor DA, Kimm SY. Childhood obesity. Lancet. 2010; 375:1737–1748.
Article3. Barlow SE. Expert Committee. Expert committee recommendations regarding the prevention, assessment, and treatment of child and adolescent overweight and obesity: summary report. Pediatrics. 2007; 120:Suppl 4. S164–S192.
Article4. Ogden CL, Carroll MD, Kit BK, Flegal KM. Prevalence of obesity and trends in body mass index among US children and adolescents, 1999-2010. JAMA. 2012; 307:483–490.
Article5. Ogden CL, Flegal KM, Carroll MD, Johnson CL. Prevalence and trends in overweight among US children and adolescents, 1999-2000. JAMA. 2002; 288:1728–1732.
Article6. Oh K, Jang MJ, Lee NY, Moon JS, Lee CG, Yoo MH, et al. Prevalence and trends in obesity among Korean children and adolescents in 1997 and 2005. Korean J Pediatr. 2008; 51:950–955.
Article7. Juonala M, Magnussen CG, Berenson GS, Venn A, Burns TL, Sabin MA, et al. Childhood adiposity, adult adiposity, and cardiovascular risk factors. N Engl J Med. 2011; 365:1876–1885.
Article8. Heymsfield SB, Gallagher D, Mayer L, Beetsch J, Pietrobelli A. Scaling of human body composition to stature: new insights into body mass index. Am J Clin Nutr. 2007; 86:82–91.
Article9. Okorodudu DO, Jumean MF, Montori VM, Romero-Corral A, Somers VK, Erwin PJ, et al. Diagnostic performance of body mass index to identify obesity as defined by body adiposity: a systematic review and meta-analysis. Int J Obes (Lond). 2010; 34:791–799.
Article10. Hattori K, Tatsumi N, Tanaka S. Assessment of body composition by using a new chart method. Am J Hum Biol. 1997; 9:573–578.
Article11. Horlick M. Body mass index in childhood--measuring a moving target. J Clin Endocrinol Metab. 2001; 86:4059–4060.12. Freedman DS, Wang J, Thornton JC, Mei Z, Pierson RN Jr, Dietz WH, et al. Racial/ethnic differences in body fatness among children and adolescents. Obesity (Silver Spring). 2008; 16:1105–1111.
Article13. Daniels SR, Khoury PR, Morrison JA. The utility of body mass index as a measure of body fatness in children and adolescents: differences by race and gender. Pediatrics. 1997; 99:804–807.
Article14. Moon JS, Lee SY, Nam CM, Choi JM, Choe BK, Seo JW, et al. 2007 Korean National Growth Charts: review of developmental process and an outlook. Korean J Pediatr. 2008; 51:1–25.
Article15. Demerath EW, Schubert CM, Maynard LM, Sun SS, Chumlea WC, Pickoff A, et al. Do changes in body mass index percentile reflect changes in body composition in children? Data from the Fels Longitudinal Study. Pediatrics. 2006; 117:e487–e495.
Article16. Maynard LM, Wisemandle W, Roche AF, Chumlea WC, Guo SS, Siervogel RM. Childhood body composition in relation to body mass index. Pediatrics. 2001; 107:344–350.
Article17. Schwandt P, von Eckardstein A, Haas GM. Percentiles of percentage body fat in german children and adolescents: an international comparison. Int J Prev Med. 2012; 3:846–852.
Article18. Park H, Park K, Kim MH, Kim GS, Chung S. Gender differences in relationship between fat-free mass index and fat mass index among Korean children using body composition chart. Yonsei Med J. 2011; 52:948–952.
Article19. Lindsay RS, Hanson RL, Roumain J, Ravussin E, Knowler WC, Tataranni PA. Body mass index as a measure of adiposity in children and adolescents: relationship to adiposity by dual energy x-ray absorptiometry and to cardiovascular risk factors. J Clin Endocrinol Metab. 2001; 86:4061–4067.
Article20. Wang J, Rennie KL, Gu W, Li H, Yu Z, Lin X. Independent associations of body-size adjusted fat mass and fat-free mass with the metabolic syndrome in Chinese. Ann Hum Biol. 2009; 36:110–121.
Article21. Jourdan C, Petersen AK, Gieger C, Döring A, Illig T, Wang-Sattler R, et al. Body fat free mass is associated with the serum metabolite profile in a population-based study. PLoS One. 2012; 7:e40009.
Article22. Cole TJ, Freeman JV, Preece MA. Body mass index reference curves for the UK, 1990. Arch Dis Child. 1995; 73:25–29.
Article23. Kim K, Yun SH, Jang MJ, Oh KW. Body fat percentile curves for Korean children and adolescents: a data from the Korea National Health and Nutrition Examination Survey 2009-2010. J Korean Med Sci. 2013; 28:443–449.
Article24. Kurtoglu S, Mazicioglu MM, Ozturk A, Hatipoglu N, Cicek B, Ustunbas HB. Body fat reference curves for healthy Turkish children and adolescents. Eur J Pediatr. 2010; 169:1329–1335.
Article25. Laurson KR, Eisenmann JC, Welk GJ. Body fat percentile curves for U.S. children and adolescents. Am J Prev Med. 2011; 41:4 Suppl 2. S87–S92.
Article26. Ogden CL, Li Y, Freedman DS, Borrud LG, Flegal KM. Smoothed percentage body fat percentiles for U.S. children and adolescents, 1999-2004. Natl Health Stat Report. 2011; 1–7.27. Mooney SJ, Baecker A, Rundle AG. Comparison of anthropometric and body composition measures as predictors of components of the metabolic syndrome in a clinical setting. Obes Res Clin Pract. 2013; 7:e55–e66.
Article28. Park HW, Kim YH, Cho M, Kwak BO, Kim KS, Chung S. Adolescent build plotting on body composition chart and the type of diabetes mellitus. J Korean Med Sci. 2012; 27:1385–1390.
Article29. Ehtisham S, Crabtree N, Clark P, Shaw N, Barrett T. Ethnic differences in insulin resistance and body composition in United Kingdom adolescents. J Clin Endocrinol Metab. 2005; 90:3963–3969.
Article30. Plachta-Danielzik S, Gehrke MI, Kehden B, Kromeyer-Hauschild K, Grillenberger M, Willhöft C, et al. Body fat percentiles for German children and adolescents. Obes Facts. 2012; 5:77–90.
Article31. Wang J, Thornton JC, Russell M, Burastero S, Heymsfield S, Pierson RN Jr. Asians have lower body mass index (BMI) but higher percent body fat than do whites: comparisons of anthropometric measurements. Am J Clin Nutr. 1994; 60:23–28.
Article
- Full Text Links
-
- Actions
-
Cited
- CITED
-
- Close
- Share
-
- Similar articles
-
- Body Composition and Obesity in Korean Adolescents and its Impact on Diabetes Mellitus
- Body Composition, Food Intake and Clinical Blood Indices of Female College Students
- Development of a Dietary Fiber Composition Table and Intakes of Dietary Fiber in Korea National Health and Nutrition Examination Survey (KNHANES)
- Letter: Thyroid Stimulating Hormone Reference Range and Prevalence of Thyroid Dysfunction in the Korean Population: Korea National Health and Nutrition Examination Survey 2013 to 2015 (Endocrinol Metab 2017;32:106-14, Won Gu Kim et al.)
- Associations Between Body Composition and Chronic Low Back Pain in Adults: Data from the 2009 Korea National Health and Nutrition Examination Survey
