Performance of the PROTIA(TM) Allergy-Q(R) System in the Detection of Allergen-specific IgE: A Comparison With the ImmunoCAP(R) System
- Affiliations
-
- 1Division of Allergy and Immunology, Department of Internal Medicine, Yonsei University College of Medicine, Seoul, Korea. parkjw@yuhs.ac
- 2Institute of Allergy, Yonsei University College of Medicine, Seoul, Korea.
- KMID: 2130263
- DOI: http://doi.org/10.4168/aair.2015.7.6.565
Abstract
- PURPOSE
The PROTIA(TM) Allergy-Q(R) enzyme immunoassay (EIA) is a recently developed screening assay for specific immunoglobulin E (sIgE) for multiple allergens. The ImmunoCAP(R) fluorescent EIA (FEIA) system is the most widely used method for sIgE detection. In this study, we evaluated the performance of the Allergy-Q(R) system compared to the ImmunoCAP(R) system.
METHODS
We compared the 2 systems using sera from 260 Korean allergy patients suffering from asthma (26.5%), allergic rhinitis (42.3%), atopic dermatitis (67.7%), and food allergy (18.1%). We compared sIgE-measurement results for 7 inhalant allergens, 5 food allergens, and 4 microorganism allergens.
RESULTS
Overall, 1,799 paired assay results were analyzed. Except mugwort and alternaria, most of the allergen-sIgE results showed intra-class correlation coefficients of >0.5. Inter-assay class associations were reliable for most allergens (gamma=0.858-0.987, P<0.001). Passing-Bablok regression analysis showed multiple differences in intercept and slope. The inter-method concordance was moderate to substantial for most allergens (kappa=0.713-0.898, P<0.001).
CONCLUSIONS
The PROTIA(TM) Allergy-Q(R) EIA system exhibited good detection performance compared to the ImmunoCAP(R) FEIA system in Korean allergic patients. However, because of methodological differences between the 2 assays, careful clinical implication is required for the interpretation of Allergy-Q(R) EIA results.
MeSH Terms
Figure
-

Fig. 1 Scattered plots of inhalant allergen sIgE concentrations, as measured by the ImmunoCAP® assay (x-axis) and the Allergy-Q® assay (y-axis). Each line in the plot represents the class cut-off of each assay (class 0: <0.35, class 1: 0.35-0.7, class 2: 0.7-3.5, class 3: 3.5-17.5, class 4: 17.5-50, class 5: 50-100, class 6: >100 kU/L). Shaded boxes represent concordant areas in each concentration class. Each plot represents an inhalant allergen: Dermatophagoides pteronyssinus (A), D. farinae (B), cat dander (C), dog dander (D), birch pollen (E), mugwort pollen (F), and timothy pollen (G).
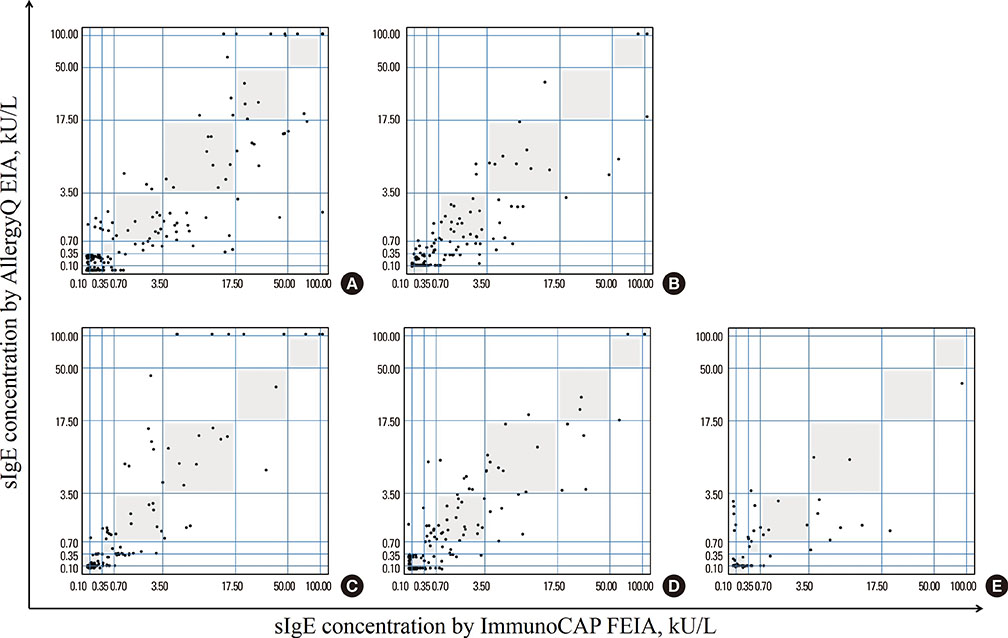
Fig. 2 Scattered plots of food allergen sIgE concentrations, as measured by the ImmunoCAP® assay (x-axis) and the Allergy-Q® assay (y-axis). Each line in the plot represents class cut-off of each assay (class 0: <0.35, class 1: 0.35-0.7, class 2: 0.7-3.5, class 3: 3.5-17.5, class 4: 17.5-50, class 5: 50-100, class 6: >100 kU/L). Shaded boxes represent concordant areas in each concentration class. Each plot represents a food allergen: egg white (A), cow's milk (B), wheat (C), peanut (D), and shrimp (E).

Fig. 3 Scattered plots of food microorganism sIgE concentrations, as measured by the ImmunoCAP® assay (x-axis) and the Allergy-Q® assay (y-axis). Each line in the plot represents class cut-off of each assay (class 0: <0.35, class 1: 0.35-0.7, class 2: 0.7-3.5, class 3: 3.5-17.5, class 4: 17.5-50, class 5: 50-100, class 6: >100 kU/L). Shaded boxes represent concordant areas in each concentration class. Each plot represents a microorganism allergen: Alernaria alternata (A), Candida albicans (B), staphylococcal enterotoxin B (C) and Trichophyton rubrum (D).
Cited by 2 articles
-
Comparison of the ImmunoCAP Assay and AdvanSure™ AlloScreen Advanced Multiplex Specific IgE Detection Assay
Kyung Hee Park, Jongsun Lee, Sang Chul Lee, Young Woong Son, Da Woon Sim, Jae-Hyun Lee, Jung-Won Park
Yonsei Med J. 2017;58(4):786-792. doi: 10.3349/ymj.2017.58.4.786.Clinical diagnostic guidelines for allergic rhinitis: diagnosis
Young Hyo Kim, Hyeon-Jong Yang, Jeong-Hee Choi, Dong-Kyu Kim, Young Yoo, Bora Lee, Mi-Ae Kim, Bong-Seong Kim, Won-Young Kim, Jeong Hee Kim, Yang Park, So Yeon Park, Woo Yong Bae, Keejae Song, Min-Suk Yang, Sang Min Lee, Young-Mok Lee, Hyun Jong Lee, Jae-Hong Cho, Hye Mi Jee, Young-Il Koh,
J Korean Med Assoc. 2017;60(1):81-88. doi: 10.5124/jkma.2017.60.1.81.
Reference
-
1. National Institutes of Health, National Heart, Lung, and Blood Institute (US). Global strategy for asthma management and prevention. . [place unknown]: Global Initiative for Asthma;2002.2. Gislason D, Bjornsson E, Gislason T, Janson C, Sjoberg O, Elfman L, et al. Sensitization to airborne and food allergens in Reykjavik (Iceland) and Uppsala (Sweden) - a comparative study. Allergy. 1999; 54:1160–1167.3. Hamilton RG, Adkinson NF Jr. Serological methods in the diagnosis and management of human allergic disease. Crit Rev Clin Lab Sci. 1984; 21:1–18.4. Wide L, Bennich H, Johansson SG. Diagnosis of allergy by an in-vitro test for allergen antibodies. Lancet. 1967; 2:1105–1107.5. Lee JH, Park KH, Kim HS, Kim KW, Sohn MH, Kim CH, et al. Specific IgE measurement using AdvanSure® system: comparison of detection performance with ImmunoCAP® system in Korean allergy patients. Clin Chim Acta. 2012; 413:914–919.6. Plebani M, Bernardi D, Basso D, Borghesan F, Faggian D. Measurement of specific immunoglobulin E: intermethod comparison and standardization. Clin Chem. 1998; 44:1974–1979.7. Lee S, Lim HS, Park J, Kim HS. A new automated multiple allergen simultaneous test-chemiluminescent assay (MAST-CLA) using an AP720S analyzer. Clin Chim Acta. 2009; 402:182–188.8. Lee YW, Sohn JH, Lee JH, Hong CS, Park JW. Allergen-specific IgE measurement with the IMMULITE 2000 system: intermethod comparison of detection performance for allergen-specific IgE antibodies from Korean allergic patients. Clin Chim Acta. 2009; 401:25–32.9. Jang WR, Nahm CH, Kim JH, Lim DH, Jang TY, Moon YS, et al. Allergen specific IgE measurement with Polycheck Allergy: comparison of three multiple allergen simultaneous tests. Korean J Lab Med. 2009; 29:465–472.10. Jung JW, Choi JC, Shin JW, Kim JY, Park IW, Choi BW. Clinical characteristics according to sensitized allergens in adult Korean patients with bronchial asthma. Allergy Asthma Immunol Res. 2010; 2:102–107.11. Swanson MC, Agarwal MK, Reed CE. An immunochemical approach to indoor aeroallergen quantitation with a new volumetric air sampler: studies with mite, roach, cat, mouse, and guinea pig antigens. J Allergy Clin Immunol. 1985; 76:724–729.12. Noh G, Ahn HS, Cho NY, Lee S, Oh JW. The clinical significance of food specific IgE/IgG4 in food specific atopic dermatitis. Pediatr Allergy Immunol. 2007; 18:63–70.13. Sonesson A, Bartosik J, Christiansen J, Roscher I, Nilsson F, Schmidtchen A, et al. Sensitization to skin-associated microorganisms in adult patients with atopic dermatitis is of importance for disease severity. Acta Derm Venereol. 2013; 93:340–345.14. Passing H, Bablok W. A new biometrical procedure for testing the equality of measurements from two different analytical methods. Application of linear regression procedures for method comparison studies in clinical chemistry, Part I. J Clin Chem Clin Biochem. 1983; 21:709–720.15. Landis JR, Koch GG. The measurement of observer agreement for categorical data. Biometrics. 1977; 33:159–174.16. Uyttebroek AP, Sabato V, Bridts CH, De Clerck LS, Ebo DG. Immunoglobulin E antibodies to atracurium: a new diagnostic tool? Clin Exp Allergy. 2015; 45:485–487.17. Palikhe NS, Kim JH, Park HS. Biomarkers predicting isocyanate-induced asthma. Allergy Asthma Immunol Res. 2011; 3:21–26.18. Sampson HA. Utility of food-specific IgE concentrations in predicting symptomatic food allergy. J Allergy Clin Immunol. 2001; 107:891–896.19. Jin HJ, Choi GS, Shin YS, Kim JH, Kim JE, Ye YM, et al. The allergenic potency of Japanese hop pollen is increasing with environmental changes in Korea. Allergy Asthma Immunol Res. 2013; 5:309–314.20. Jeong KY, Lee IY, Yong TS, Lee JH, Kim EJ, Lee JS, et al. Sequence polymorphisms of Der f 1, Der p 1, Der f 2 and Der p 2 from Korean house dust mite isolates. Exp Appl Acarol. 2012; 58:35–42.21. Jeong KY, Choi SY, Han IS, Lee JH, Lee JS, Hong CS, et al. The effects of storage conditions on the stability of house dust mite extracts. Allergy Asthma Immunol Res. 2013; 5:397–401.22. Ollert M, Weissenbacher S, Rakoski J, Ring J. Allergen-specific IgE measured by a continuous random-access immunoanalyzer: interassay comparison and agreement with skin testing. Clin Chem. 2005; 51:1241–1249.23. Zuberbier T, Bachert C, Bousquet PJ, Passalacqua G, Walter Canonica G, Merk H, et al. GA(2) LEN/EAACI pocket guide for allergen-specific immunotherapy for allergic rhinitis and asthma. Allergy. 2010; 65:1525–1530.24. Cox L, Nelson H, Lockey R, Calabria C, Chacko T, Finegold I, et al. Allergen immunotherapy: a practice parameter third update. J Allergy Clin Immunol. 2011; 127:S1–S55.25. Williams PB. Usefulness of specific IgE antibody tests: a progress report. Ann Allergy Asthma Immunol. 2003; 91:518–524.26. Crobach MJ, Hermans J, Kaptein AA, Ridderikhoff J, Petri H, Mulder JD. The diagnosis of allergic rhinitis: how to combine the medical history with the results of radioallergosorbent tests and skin prick tests. Scand J Prim Health Care. 1998; 16:30–36.
- Full Text Links
-
- Actions
-
Cited
- CITED
-
- Close
- Share
-
- Similar articles
-
- Performance Comparison of ImmunoCAP and HYTEC 288 in the Quantitative Tests of Allergen-specific IgE
- Comparison of Pharmacia CAP system and Auro Dex(R) Visual ENS(TM) screening test for detecting specific IgE in atopic patients
- Comparative Study of ImmunoCAP and ELISA for Detecting Allergen Specific IgE to Japanese Hop Pollen and Two Spotted Spider Mite
- Detection of Allergen Specific IgE by AdvanSure Allergy Screen Test
- The Age Impact on Serum Total and Allergen-Specific IgE
