Enhancement Pattern of Liver Parenchyma during Late Dynamic Phase Imaging: Comparison between Gd-EOB-DTPA and Gd-DTPA-BMA
- Affiliations
-
- 1Department of Radiology, Chonnam National University Hwasun Hospital, Hwasun, Korea.
- 2Department of Radiology, Chonnam National University Medical School, Gwangju, Korea. kjradsss@dreamwiz.com
- KMID: 2041937
- DOI: http://doi.org/10.3348/jksr.2014.70.4.269
Abstract
- PURPOSE
To evaluate the differences in enhancement patterns of liver parenchyma during the late dynamic phase imaging between gadolinium-ethoxybenzyl-diethylenetriamine-pentaacetic acid (Gd-EOB-DTPA) and gadolinium-diethylenetriamine-pentaacetic acid-bismethylamide (Gd-DTPA-BMA).
MATERIALS AND METHODS
130 patients (88 men and 42 women at the mean age of 59.4 years) and 110 patients (72 men and 38 women at the mean age of 60.2 years) underwent dynamic contrast-enhanced MR imaging, using Gd-EOB-DTPA and Gd-DTPA-BMA, respectively, at 3T MR scanner. In both groups, the patients were divided into three categories: category I for normal liver, category II for Child A cirrhotic liver, and category III for Child B and C cirrhotic liver. Late dynamic phase scanning was performed at 100, 140, and 180 seconds after injection of the contrast agent. The injected dose of Gd-EOB-DTPA and Gd-DTPA-BMA was 0.025 mmol/kg of the body weight and 0.1 mmol/kg of the body weight, respectively. Signal intensity ratio of the liver (SIR(L)), contrast ratio between liver and portal vein (LPC), and contrast ratio between liver and spleen (LSC) were calculated and compared between Gd-EOB-DTPA group and Gd-DTPA-BMA group according to the scan delay time.
RESULTS
There was no statistically significant difference between the two groups in respect to demographic characteristics. SIR(L) of Gd-EOB-DTPA group was significantly lower at 100 seconds in category I, and also at 100 and 140 seconds in category II (p < 0.05). In Gd-EOB-DTPA group, LPC and LSC showed an increasing trend according to the delayed time in all of the categories. In Gd-DTPA-BMA group, LPC and LSC showed similar values according to the delayed time in all of the categories. LPC of Gd-EOB-DTPA group was significantly higher at 100, 140, and 180 seconds in category I and II (p < 0.05). LSC of Gd-EOB-DTPA group was significantly higher at 100, 140, and 180 seconds in category I, II, and III (p < 0.05).
CONCLUSION
In contrast to Gd-DTPA-BMA, the late phase imaging using Gd-EOB-DTPA was affected by intracellular distribution of the contrast agent, which was proportional to the elapsed time after the injection of Gd-EOB-DTPA.
Figure
-
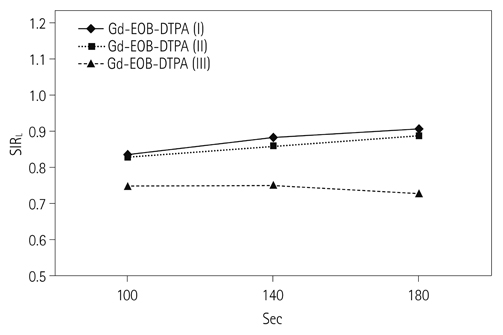
Fig. 1 Signal intensity ratio of liver parenchyma (SIRL) during late dynamic phase imaging shows the trend to increase according to delayed time in category I and II, in Gd-EOB-DTPA group. Note.-Gd-EOB-DTPA = gadolinium-ethoxybenzyl-diethylenetriamine-pentaacetic acid

Fig. 2 Signal intensity ratio of liver parenchyma (SIRL) during late dynamic phase imaging shows the trend to decrease in all categories, in Gd-DTPA-BMA group. Note.-Gd-DTPA-BMA = gadolinium-diethylenetriamine-pentaacetic acid-bismethylamide

Fig. 3 Contrast ratio between liver and portal vein (LPC) during late dynamic phase imaging shows the trend to increase according to delayed time in all categories, in Gd-EOB-DTPA group. Note.-Gd-EOB-DTPA = gadolinium-ethoxybenzyl-diethylenetriamine-pentaacetic acid

Fig. 4 Contrast ratio between liver and portal vein (LPC) during late dynamic phase imaging shows similar values according to delayed time in all categories, in Gd-DTPA-BMA group. Note.-Gd-DTPA-BMA = gadolinium-diethylenetriamine-pentaacetic acid-bismethylamide

Fig. 5 Contrast ratio between liver and spleen (LSC) during late dynamic phase imaging shows the trend to increase according to delayed time in all categories, in Gd-EOB-DTPA group. Note.-Gd-EOB-DTPA = gadolinium-ethoxybenzyl-diethylenetriamine-pentaacetic acid
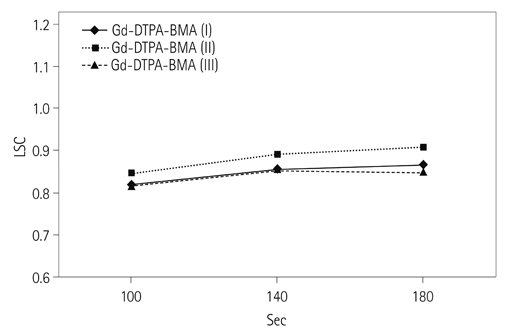
Fig. 6 Contrast ratio between liver and spleen (LSC) during late dynamic phase imaging shows similar values according to delayed time in all categories, in Gd-DTPA-BMA group. Note.-Gd-DTPA-BMA = gadolinium-diethylenetriamine-pentaacetic acid-bismethylamide
Reference
-
1. Goodwin MD, Dobson JE, Sirlin CB, Lim BG, Stella DL. Diagnostic challenges and pitfalls in MR imaging with hepatocyte-specific contrast agents. Radiographics. 2011; 31:1547–1568.2. Huppertz A, Balzer T, Blakeborough A, Breuer J, Giovagnoni A, Heinz-Peer G, et al. Improved detection of focal liver lesions at MR imaging: multicenter comparison of gadoxetic acid-enhanced MR images with intraoperative findings. Radiology. 2004; 230:266–275.3. Semelka RC, Helmberger TK. Contrast agents for MR imaging of the liver. Radiology. 2001; 218:27–38.4. Vogl TJ, Kümmel S, Hammerstingl R, Schellenbeck M, Schumacher G, Balzer T, et al. Liver tumors: comparison of MR imaging with Gd-EOB-DTPA and Gd-DTPA. Radiology. 1996; 200:59–67.5. Reimer P, Rummeny EJ, Daldrup HE, Hesse T, Balzer T, Tombach B, et al. Enhancement characteristics of liver metastases, hepatocellular carcinomas, and hemangiomas with Gd-EOB-DTPA: preliminary results with dynamic MR imaging. Eur Radiol. 1997; 7:275–280.6. Fujinaga Y, Ohya A, Matsushita T, Kurozumi M, Ueda K, Kitou Y, et al. Effect of hepatobiliary uptake of Gd-EOB-DTPA on the hepatic venous phase of dynamic magnetic resonance imaging on a 3.0-T apparatus: comparison between Gd-EOB-DTPA and Gd-DTPA. Jpn J Radiol. 2011; 29:695–670.7. Schuhmann-Giampieri G, Schmitt-Willich H, Press WR, Negishi C, Weinmann HJ, Speck U. Preclinical evaluation of Gd-EOB-DTPA as a contrast agent in MR imaging of the hepatobiliary system. Radiology. 1992; 183:59–64.8. Yoshikawa K, Inoue Y, Shimada M, Akahane M, Itoh S, Seno A, et al. Contrast-enhanced MR angiography in rats with hepatobiliary contrast agents. Magn Reson Imaging. 2004; 22:937–942.9. Hamm B, Staks T, Mühler A, Bollow M, Taupitz M, Frenzel T, et al. Phase I clinical evaluation of Gd-EOB-DTPA as a hepatobiliary MR contrast agent: safety, pharmacokinetics, and MR imaging. Radiology. 1995; 195:785–792.10. Ringe KI, Husarik DB, Sirlin CB, Merkle EM. Gadoxetate disodium-enhanced MRI of the liver: part 1, protocol optimization and lesion appearance in the noncirrhotic liver. AJR Am J Roentgenol. 2010; 195:13–28.11. Takao H, Akai H, Tajima T, Kiryu S, Watanabe Y, Imamura H, et al. MR imaging of the biliary tract with Gd-EOB-DTPA: effect of liver function on signal intensity. Eur J Radiol. 2011; 77:325–329.12. van Montfoort JE, Stieger B, Meijer DK, Weinmann HJ, Meier PJ, Fattinger KE. Hepatic uptake of the magnetic resonance imaging contrast agent gadoxetate by the organic anion transporting polypeptide Oatp1. J Pharmacol Exp Ther. 1999; 290:153–157.13. Ros PR, Freeny PC, Harms SE, Seltzer SE, Davis PL, Chan TW, et al. Hepatic MR imaging with ferumoxides: a multicenter clinical trial of the safety and efficacy in the detection of focal hepatic lesions. Radiology. 1995; 196:481–488.14. Petersein J, Spinazzi A, Giovagnoni A, Soyer P, Terrier F, Lencioni R, et al. Focal liver lesions: evaluation of the efficacy of gadobenate dimeglumine in MR imaging--a multicenter phase III clinical study. Radiology. 2000; 215:727–736.15. Bluemke DA, Sahani D, Amendola M, Balzer T, Breuer J, Brown JJ, et al. Efficacy and safety of MR imaging with liver-specific contrast agent: U.S. multicenter phase III study. Radiology. 2005; 237:89–98.16. Huppertz A, Haraida S, Kraus A, Zech CJ, Scheidler J, Breuer J, et al. Enhancement of focal liver lesions at gadoxetic acid-enhanced MR imaging: correlation with histopathologic findings and spiral CT--initial observations. Radiology. 2005; 234:468–478.17. Kühn JP, Hegenscheid K, Siegmund W, Froehlich CP, Hosten N, Puls R. Normal dynamic MRI enhancement patterns of the upper abdominal organs: gadoxetic acid compared with gadobutrol. AJR Am J Roentgenol. 2009; 193:1318–1323.18. Cruite I, Schroeder M, Merkle EM, Sirlin CB. Gadoxetate disodium-enhanced MRI of the liver: part 2, protocol optimization and lesion appearance in the cirrhotic liver. AJR Am J Roentgenol. 2010; 195:29–41.
- Full Text Links
-
- Actions
-
Cited
- CITED
-
- Close
- Share
-
- Similar articles
-
- Hepatic Lymphoma Representing Iso-Signal Intensity on Hepatobiliary Phase, in Gd-EOB-DTPA-Enhanced MRI: Case Report
- Supradiaphragmatic Liver Confirmed by a Hepatocyte-specific Contrast Agent (Gd-EOB-DTPA): A Case Report
- (17)O NMR Study On Water Exchange Rate of Paramagnetic Contrast Agents
- Image Findings of Sarcomatous Intrahepatic Cholangiocarcinoma Focused on Gd-EOB-DTPA Enhanced MRI: A Case Report
- Dynamic MR Imaging of Hepatic Hemangioma and Hepatocellular: Findings and Differential Diagnosis
