J Korean Soc Magn Reson Med.
2011 Apr;15(1):67-71. 10.13104/jksmrm.2011.15.1.67.
T2 Relaxation Times of the Cingulate Cortex, Amygdaloid Body, Hippocampal Body, and Insular Cortex: Comparison of 1.5 T and 3.0 T
- Affiliations
-
- 1Department of Radiology, Research Institute of Radiologic Science, Yonsei University College of Medicine, Korea. eungykim@yuhs.ac
- KMID: 2041229
- DOI: http://doi.org/10.13104/jksmrm.2011.15.1.67
Abstract
- PURPOSE
To compare T2 relaxation times (T2) in the cingulate cortex, amygdaloid body, hippocampal body, and insular cortex between 1.5T and 3.0T MR imagers.
MATERIALS AND METHODS
Twelve healthy volunteers underwent FLAIR and CPMG imaging perpendicular to the hippocampal body at both 3.0T and 1.5T. T2 was measured in the cingulate cortex, amygdaloid body, hippocampal body, and insular cortex. The T2 relaxation time ratios of the cingulate cortex, insular cortex, and amygdaloid body to the hippocampal body were compared between 1.5T and 3.0T.
RESULTS
The mean T2 of the cingulate cortex, amygdaloid body, hippocampal body, and insular cortex at 1.5T were 109.5+/-3.1, 117.0+/-7.1, 114.7+/-2.4, and 111.3+/-2.4, respectively; 99.7+/-3.8, 100.7+/-4.3, 97.9+/-3.4, and 96.2+/-2.0, respectively, at 3.0T. Percentage changes of T2 in the cingulate cortex, insular cortex, amygdaloid body, and hippocampal body at 3.0T with respect to those at 1.5T were -8.9%, -13.5%, -14.6%, and -13.5%, respectively. The mean T2 ratios of the cingulate gyrus, insular cortex, and amygdaloid body to the hippocampal body at 1.5T and 3.0T were 0.96 and 1.02 (p=0.003); 1.02 and 1.03 (p>0.05); 0.97 and 0.98 (p>0.05), respectively.
CONCLUSION
T2 decrease in the cingulate cortex was less than the amygdaloid body, insular cortex, and hippocampal body at 3.0T. The mean T2 ratio of the cingulate gyrus to the hippocampal body was significantly different between 1.5T and 3.0T.
Figure
-
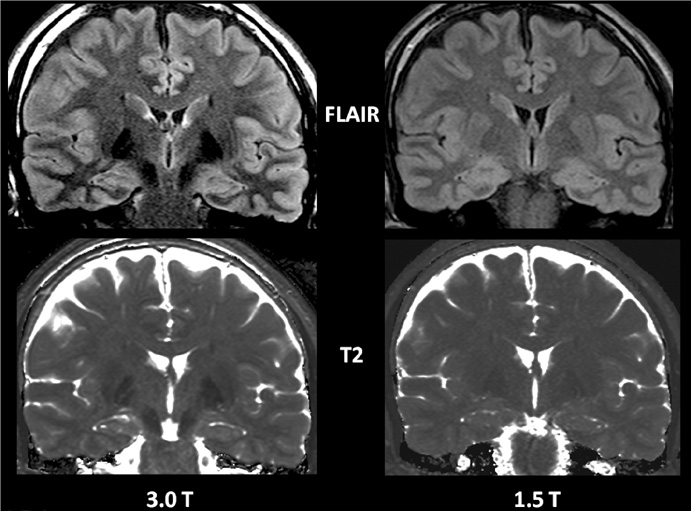
Fig. 1 Representative Images of FLAIR and T2 Relaxation Time Maps at 1.5T and 3.0T (FLAIR, fluid-attenuated inversion recovery; T2, T2 relaxation time maps).
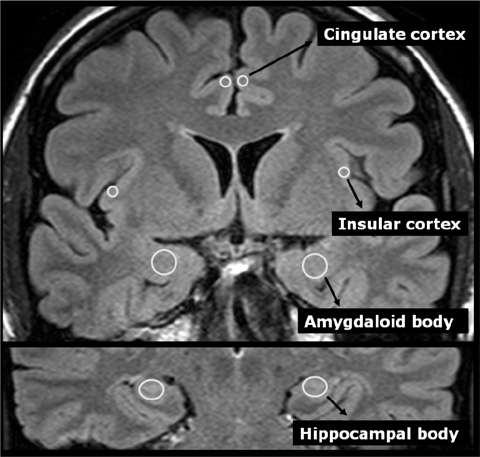
Fig. 2 Regions of Interests
Reference
-
1. Frayne R, Goodyear BG, Dickhoff P, Lauzon ML, Sevick RJ. Magnetic resonance imaging at 3.0 Tesla: challenges and advantages in clinical neurological imaging. Investigative radiology. 2003. 38(7):385–402.2. Trattnig S, Ba-Ssalamah A, Noebauer-Huhmann IM, et al. MR contrast agent at high-field MRI (3 Tesla). Top Magn Reson Imaging. 2003. 14(5):365–375.3. Lu H, Nagae-Poetscher LM, Golay X, Lin D, Pomper M, van Zijl PC. Routine clinical brain MRI sequences for use at 3.0 Tesla. J Magn Reson Imaging. 2005. 22(1):13–22.4. Hirai T, Korogi Y, Yoshizumi K, Shigematsu Y, Sugahara T, Takahashi M. Limbic lobe of the human brain: evaluation with turbo fluid-attenuated inversion-recovery MR imaging. Radiology. 2000. 215(2):470–475.5. Whittall KP, MacKay AL, Graeb DA, Nugent RA, Li DK, Paty DW. In vivo measurement of T2 distributions and water contents in normal human brain. Magn Reson Med. 1997. 37(1):34–43.6. Schwerdtfeger WK. Structure and fiber connections of the hippocampus. A comparative study. Adv Anat Embryol Cell Biol. 1984. 83:1–7.7. Duvernoy HM, Delon S, Vannson JL. Cortical blood vessels of the human brain. Brain Res Bull. 1981. 7(5):519–579.8. Vymazal J, Brooks RA, Baumgarner C, et al. The relation between brain iron and NMR relaxation times: an in vitro study. Magn Reson Med. 1996. 35(1):56–61.9. Michaeli S, Garwood M, Zhu XH, et al. Proton T2 relaxation study of water, N-acetylaspartate, and creatine in human brain using Hahn and Carr-Purcell spin echoes at 4T and 7T. Magn Reson Med. 2002. 47(4):629–633.10. Hirai T, Korogi Y, Sakamoto Y, Hamatake S, Ikushima I, Takahashi M. T2 shortening in the motor cortex: effect of aging and cerebrovascular diseases. Radiology. 1996. 199(3):799–803.11. Georgiades CS, Itoh R, Golay X, van Zijl PC, Melhem ER. MR imaging of the human brain at 1.5 T: regional variations in transverse relaxation rates in the cerebral cortex. AJNR Am J Neuroradiol. 2001. 22(9):1732–1737.12. Briellmann RS, Syngeniotis A, Jackson GD. Comparison of hippocampal volumetry at 1.5 tesla and at 3 tesla. Epilepsia. 2001. 42(8):1021–1024.13. Briellmann RS, Syngeniotis A, Fleming S, Kalnins RM, Abbott DF, Jackson GD. Increased anterior temporal lobe T2 times in cases of hippocampal sclerosis: a multi-echo T2 relaxometry study at 3 T. AJNR Am J Neuroradiol. 2004. 25(3):389–394.14. Pell GS, Briellmann RS, Waites AB, Abbott DF, Jackson GD. Voxel-based relaxometry: a new approach for analysis of T2 relaxometry changes in epilepsy. Neuroimage. 2004. 21(2):707–713.
- Full Text Links
-
- Actions
-
Cited
- CITED
-
- Close
- Share
-
- Similar articles
-
- Magnetic resonance imaging of rabbit kidney after renal vein ligation
- Mass on Left Cingulate Cortex in Patient with Localized Amnesia
- Clinical Usefulness of T2 Relaxometry in Temporal Lobe Epilepsy
- An Experimental Study on the Effects of Bilateral Amygdaloid Destruction
- The Role of Insular Cortex in Response to Group Therapy in Vaginismus Patients: Magnetic Resonance Spectroscopy Study
