Morphologic Characteristics of the Outer Retina in Cone Dystrophy on Spectral-domain Optical Coherence Tomography
- Affiliations
-
- 1Department of Ophthalmology, Seoul National University Bundang Hospital, Seoul National University College of Medicine, Seongnam, Korea. sejoon1@snu.ac.kr
- 2Department of Ophthalmology, Seoul National University Hospital, Seoul National University College of Medicine, Seoul, Korea.
- KMID: 1501791
- DOI: http://doi.org/10.3341/kjo.2013.27.1.19
Abstract
- PURPOSE
To investigate the morphologic changes in the outer retina of patients with cone dystrophy, using spectral-domain optical coherence tomography (SD-OCT).
METHODS
The medical records of 15 cone dystrophy patients examined from January 2007 to January 2012 were reviewed retrospectively. All patients underwent ophthalmic evaluation including best-corrected visual acuity (BCVA), color vision testing, fundus examination, full-field standard electroretinography (ERG), multifocal (mf) ERG, and SD-OCT. Qualitative and quantitative SD-OCT data and ERG responses were analyzed and compared among the patient categories and the normal control group.
RESULTS
There were 4 major categories of SD-OCT findings, based on the status of the ellipsoid portion of the photoreceptor inner segment (ISe), outer segment (OS) contact cylinder, and retinal pigment epithelium (RPE) layer. Category 0 showed no structural abnormalities. Category 1 showed foveal ISe loss and obscurity of the border between the ISe band and the external limiting membrane (ELM). Category 2 showed foveal thinning and focal foveal ISe disruption with an intact ELM. Category 3 showed foveal thickening and perifoveal disruption of the ISe layer. Category 1 to 3 showed OS contact cylinder layer absence and RPE thickening. The patients in category 0 tended to be younger (mean, 10.0 years) than those in categories 1 to 3 (mean, 17.6 years), although this difference was not statistically significant. Category 1 to 3 patients exhibited statistically significant thinning of the central retina and outer nuclear layer and thickening of the RPE layer relative to the category 0 and normal control group. There was a significant correlation between the central foveal thickness and BCVA in the patients with cone dystrophy. ERG and mfERG responses did not differ significantly among the different cone dystrophy categories.
CONCLUSIONS
The morphologic features of cone dystrophy as revealed by SD-OCT, could be categorized as either normal or 1 of 3 different types of outer retinal changes. The presence of normal retinal structures in young cone dystrophy patients with functional impairment (category 0) indicates that electrophysiologic studies are superior to current imaging modalities for the early diagnosis of cone dystrophy. The characteristic SD-OCT findings in cone dystrophy patients may aid in differential diagnosis and be useful for future research on the pathology of cone dystrophy.
Keyword
MeSH Terms
-
Adolescent
Adult
Child
Child, Preschool
Electroretinography
Female
Fluorescein Angiography
Fundus Oculi
Humans
Male
Middle Aged
Ophthalmoscopy
Reproducibility of Results
Retinal Cone Photoreceptor Cells/*pathology
Retinal Dystrophies/*pathology/physiopathology
Retrospective Studies
Tomography, Optical Coherence/*methods
Visual Acuity
Young Adult
Figure
-
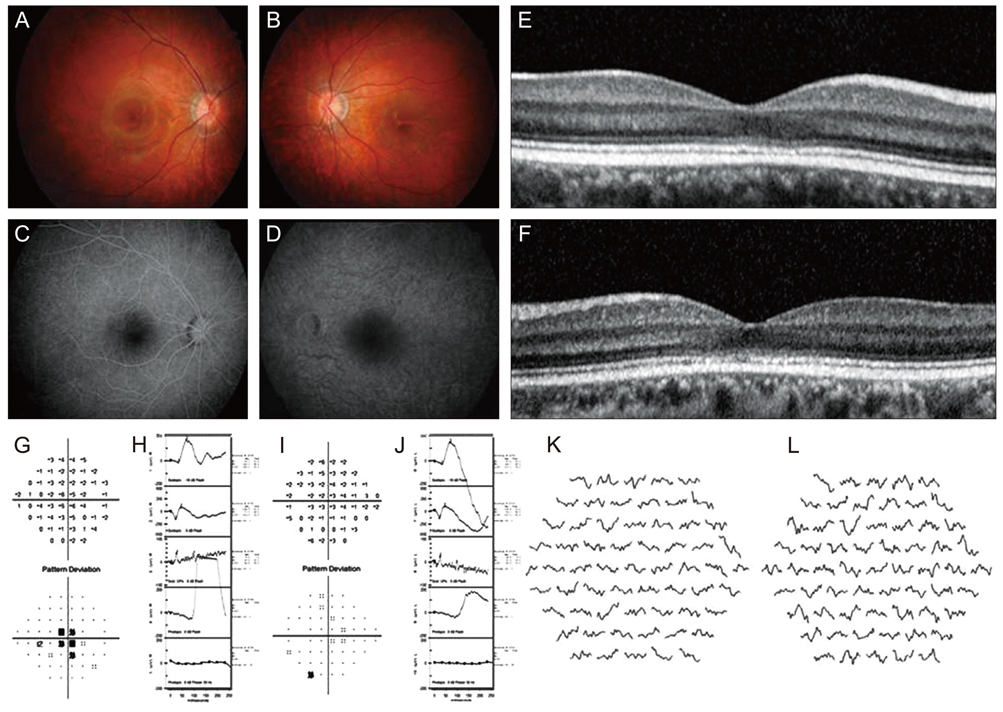
Fig. 1 A 21-year-old man (case 9) with cone dystrophy. (A,B) Fundus photographs showing focal degeneration around the fovea in both eyes. (C,D) Fundus fluorescein angiography showing normal angiographic patterns in the (C) early and (D) late phases. (E,F) Optical coherence tomography showing irregular loss of the ellipsoid portion of the photoreceptor inner segment (ISe) in both eyes. (G,I) Visual field tests by Humphrey field analyzer central 24-2 threshold testing showing a deep central scotoma in the (G) right eye and generalized reduction of sensitivity in the (I) left eye. (H,J) Full-field standard electroretinography showing decreased amplitudes of the photopic (graph of the fourth row) and 30-Hz flicker response (graph of the fifth row) in both eyes. (K,L) Trace arrays of multifocal electroretinography showing decreased central retinal responses in both eyes.

Fig. 2 Spectral-domain optical coherence tomography (SD-OCT) horizontal scan images of a normal control eye (A) and representative cases of each category of cone dystrophy patients (B-E). (A) SD-OCT of normal eyes showed 4 distinct high-signal bands in the outer retinal layer OS. (B) Category 0, OS, case 6, with normal SD-OCT findings. (C) Category 1, OD, case 8, with irregular foveal loss of the ellipsoid portion of the inner segment (ISe) band and obscurity of the border between the ISe and external limiting membrane. (D) Category 2, OS, case 3, with central retinal thinning and segmental foveal loss of the ISe band. (E) Category 3, OD, case 4, with central foveal thickening of the ISe band and irregular perifoveal loss of the ISe band. Loss of the outer segment contact cylinder layer and the thickening of the retinal pigment epithelium layer were found in category 1 to 3 patients.

Fig. 3 Optical coherence tomography thickness in the normal control and cone dystrophy grouped categories. (A,B,C) Central foveal thickness (CFT), outer nuclear layer (ONL), and photoreceptor (PR) + retinal pigment epithelium (RPE) thicknesses were significantly lower in category 1 to 3 eyes than in normal control or category 0 eyes. (D) RPE thickness was greater in category 1 to 3 eyes than in normal control or category 0 eyes. The open circles reveal the means of the thicknesses, and the vertical error bars represent the standard deviation. The asterisk indicates a statistically significant difference in thickness (p < 0.05).
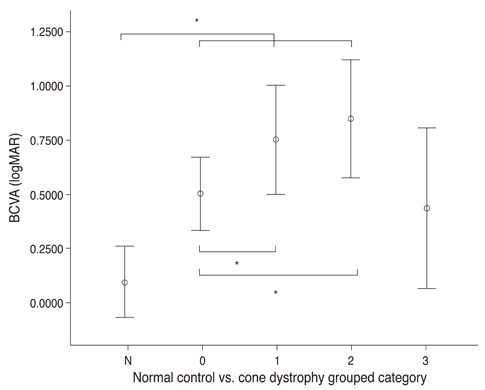
Fig. 4 Best-corrected visual acuity (BCVA) in the cone dystrophy category. The open circles reveal the means of the BCVA, and the vertical error bars represent the standard deviation. The asterisk indicates a statistically significant difference in BCVA (p < 0.05). logMAR = logarithm of the minimum angle of resolution.
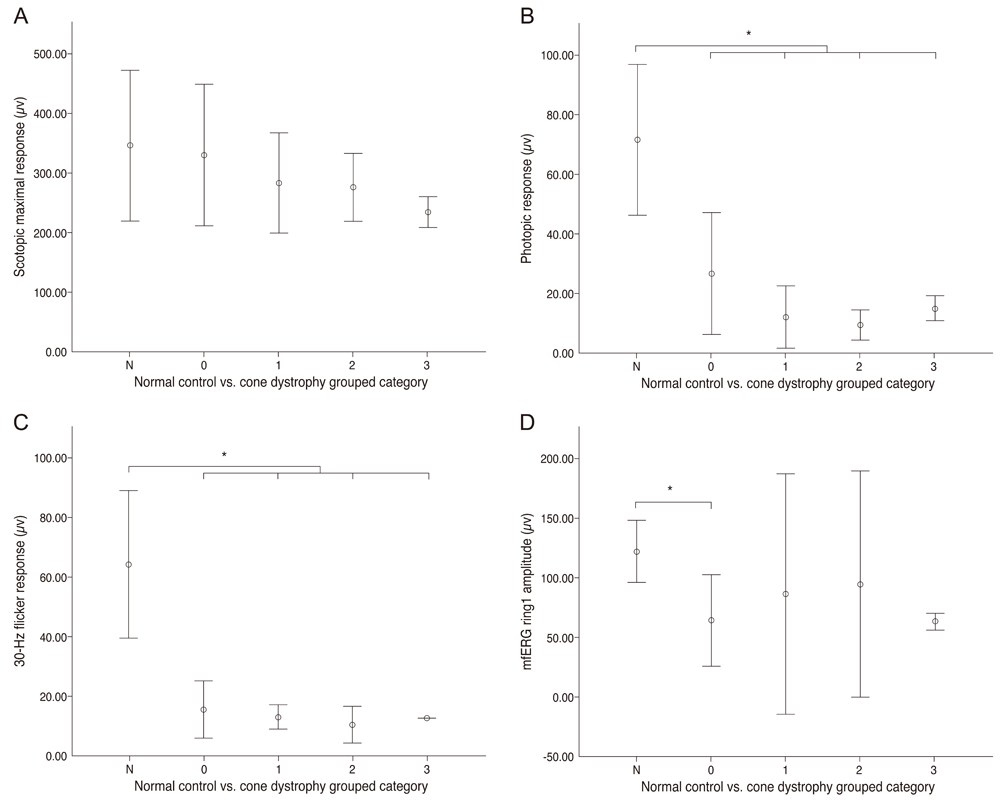
Fig. 5 Full-field and multifocal electroretinography (mfERG) amplitudes in the normal control and cone dystrophy grouped categories. (A) Scotopic maximal response. (B) Photopic response. (C) 30-Hz flicker response. (D) mfERG ring 1 amplitude. The open circles reveal the means of the amplitudes and the vertical error bars represent the standard deviation. The asterisk indicates a statistically significant difference in amplitude (p < 0.05).
Reference
-
1. Spaide RF, Koizumi H, Freund KB. Photoreceptor outer segment abnormalities as a cause of blind spot enlargement in acute zonal occult outer retinopathy-complex diseases. Am J Ophthalmol. 2008. 146:111–120.2. Inoue M, Morita S, Watanabe Y, et al. Inner segment/outer segment junction assessed by spectral-domain optical coherence tomography in patients with idiopathic epiretinal membrane. Am J Ophthalmol. 2010. 150:834–839.3. Oh J, Smiddy WE, Flynn HW Jr, et al. Photoreceptor inner/outer segment defect imaging by spectral domain OCT and visual prognosis after macular hole surgery. Invest Ophthalmol Vis Sci. 2010. 51:1651–1658.4. Chang LK, Koizumi H, Spaide RF. Disruption of the photoreceptor inner segment-outer segment junction in eyes with macular holes. Retina. 2008. 28:969–975.5. Hood DC, Lazow MA, Locke KG, et al. The transition zone between healthy and diseased retina in patients with retinitis pigmentosa. Invest Ophthalmol Vis Sci. 2011. 52:101–108.6. Birch DG, Wen Y, Locke K, Hood DC. Rod sensitivity, cone sensitivity, and photoreceptor layer thickness in retinal degenerative diseases. Invest Ophthalmol Vis Sci. 2011. 52:7141–7147.7. Hood DC, Zhang X, Ramachandran R, et al. The inner segment/outer segment border seen on optical coherence tomography is less intense in patients with diminished cone function. Invest Ophthalmol Vis Sci. 2011. 52:9703–9709.8. Spaide RF, Curcio CA. Anatomical correlates to the bands seen in the outer retina by optical coherence tomography: literature review and model. Retina. 2011. 31:1609–1619.9. Lim JI, Tan O, Fawzi AA, et al. A pilot study of Fourier-domain optical coherence tomography of retinal dystrophy patients. Am J Ophthalmol. 2008. 146:417–426.10. Choi SS, Doble N, Hardy JL, et al. In vivo imaging of the photoreceptor mosaic in retinal dystrophies and correlations with visual function. Invest Ophthalmol Vis Sci. 2006. 47:2080–2092.11. Kim BJ, Ibrahim MA, Goldberg MF. Use of spectral domain OCT to visualize photoreceptor abnormalities in cone/rod dystrophy-6. Retin Cases Brief Rep. 2011. 5:56–61.12. Querques G, Carrillo P, Querques L, et al. High-definition optical coherence tomographic visualization of photoreceptor layer and retinal flecks in fundus albipunctatus associated with cone dystrophy. Arch Ophthalmol. 2009. 127:703–706.13. Emfietzoglou I, Grigoropoulos V, Nikolaidis P, et al. Optical coherence tomography findings in a case of cone-rod dystrophy. Ophthalmic Surg Lasers Imaging. 2010. 41 Online:e1–e3.14. Duncan JL, Talcott KE, Ratnam K, et al. Cone structure in retinal degeneration associated with mutations in the peripherin/RDS gene. Invest Ophthalmol Vis Sci. 2011. 52:1557–1566.15. Thiadens AA, Phan TM, Zekveld-Vroon RC, et al. Clinical course, genetic etiology, and visual outcome in cone and cone-rod dystrophy. Ophthalmology. 2012. 119:819–826.16. Gass JD, Agarwal A, Scott IU. Acute zonal occult outer retinopathy: a long-term follow-up study. Am J Ophthalmol. 2002. 134:329–339.17. Park SJ, Woo SJ, Park KH, et al. Morphologic photoreceptor abnormality in occult macular dystrophy on spectral-domain optical coherence tomography. Invest Ophthalmol Vis Sci. 2010. 51:3673–3679.
- Full Text Links
-
- Actions
-
Cited
- CITED
-
- Close
- Share
-
- Similar articles
-
- Three Cases of Outer Retinal Tubulation in Bietti's Crystalline Dystrophy
- Spectral-domain Optical Coherence Tomography of Combined Hamartoma of the Retina and Retinal Pigment Epithelium in Neurofibromatosis
- Spectral Domain Optical Coherence Tomography Findings of Butterfly Shaped Pigment Dystrophy
- Fundus Autofluorescence, Fluorescein Angiography and Spectral Domain Optical Coherence Tomography Findings of Retinal Astrocytic Hamartomas in Tuberous Sclerosis
- Outer Retinal Layers Alterations in Chronic Central Serous Chorioretinopathy: Spectral Domain-OCT and Fundus Autofluorescence Findings
