The Susceptibility Vessel Sign of the Middle Cerebral Artery on the T2*-Weighted Gradient Echo Imaging: Semi-quantification to Predict the Response to Multimodal Intra-Arterial Thrombolysis
- Affiliations
-
- 1Department of Radiology, Catholic University of Daegu Medical Center, Daegu, South Korea.
- 2Department of Radiology, Seoul National University Bundang Hospital, Seongnam-si, South Korea. jck0097@gmail.com
- 3Department of Neurosurgery, Seoul National University Bundang Hospital, Seongnam-si, South Korea.
- 4Department of Neurology, Seoul National University Bundang Hospital, Seongnam-si, South Korea.
- 5Department of Radiology, Kwandong University Myongji Hospital, Goyang-si, South Korea.
- 6Department of Radiology, Seoul National University Hospital, Seoul, South Korea.
- KMID: 1443575
- DOI: http://doi.org/10.3348/jksr.2011.64.1.1
Abstract
- PURPOSE
We wanted to determine whether or not the "susceptibility asymmetry index" (SAI) of acute stroke on the T2*-weighted image is related with successful recanalization using multimodal intra-arterial thrombolysis (IAT).
MATERIALS AND METHODS
The 81 patients who underwent multimodal IAT for middle cerebral artery (MCA) territory acute stroke were included in this retrospective study. The multimodal IAT included intra-arterial urokinase infusion, clot disruption by a microwire, microcatheter and balloon manipulation, and balloon angioplasty and/or stenting for the flow-limiting stenosis. The diameter of the susceptibility vessel sign was measured on the T2*-weighted gradient echo imaging (GRE), and the diameter of the contralateral normal MCA at the corresponding level was measured on magnetic resonance angiography (MRA); the ratio between these two diameters was defined as the susceptibility asymmetry index. The relation between the TICI (Thrombolysis In Cerebral Infarction) score of 2-3 after multimodal IAT and the SAI was assessed. The receiver operating characteristic (ROC) curve analysis was performed on the SAI to predict a TICI score of 2-3 after multimodal IAT.
RESULTS
The mean SAI of 81 patients was 1.66 +/- 0.66. Seventy nine percent of the patients had a TICI of 2-3 after multimodal IAT. According to the ROC curve analysis, an SAI less than 1.3 was optimal for predicting the presence of stenotic lesion after recanalization (area under the curve: 0.821, sensitivity: 88.2%, specificity: 69.8%, p=0.0001), and the SAI < or = 1.61 (area under the curve: 0.652, sensitivity: 60.9%, specificity: 70.6%, p=0.0226) could predict a TICI score of 2-3. The TICI score of 2-3 after multimodal IAT was achieved in 88.6% of the cases with a SAI < or = 1.61 and in 67.6% of the cases with a SAI >1.61 (p=0.028).
CONCLUSION
The lower SAI on T2*-GRE could predict stenotic lesion and successful recanalization after performing IAT.
MeSH Terms
Figure
-
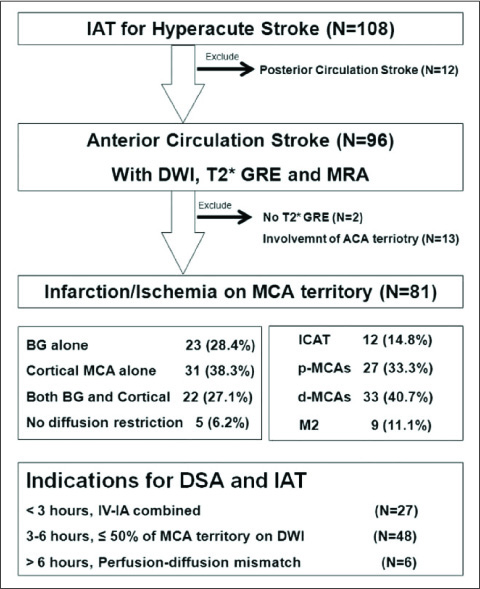
Fig. 1 Inclusion of the patients who underwent intra-arterial thrombolysis (IAT) for acute middle cerebral artery (MCA) stroke from January 2005 to January 2007. DWI = diffusion-weighted imaging, T2* GRE = T2*-weighted gradient echo imaging, MRA = magnetic resonance angiography, MCA = middle cerebral artery, ICAT = internal carotid artery terminal, p-MCAs = proximal middle cerebral artery, d-MCAs = distal middle cerebral artery, M2 = M2 segment of the MCA, DSA = digital subtraction angiography, IV-IA = intravenousintra-arterial thrombolysis
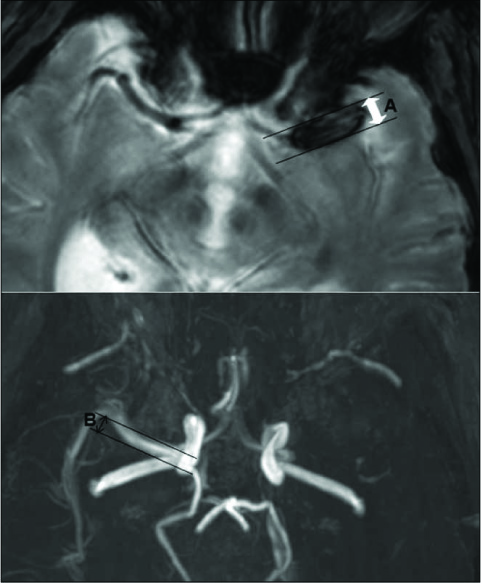
Fig. 2 The definition of the susceptibility asymmetry index (SAI). The diameter of the susceptibility vessel sign on the T2*-GRE (A; white double arrow) and that on the contralateral normal middle cerebral artery at the level corresponding to the MRA (B; black double arrow) is measured. SAI = A / B . The patient was the 70-year-old male with acute left MCA occlusion and atrial fibrillation. The SAI was measured as 2.92. After mechanical disruption with wire and balloon, the occluded MCA was not recanalized.
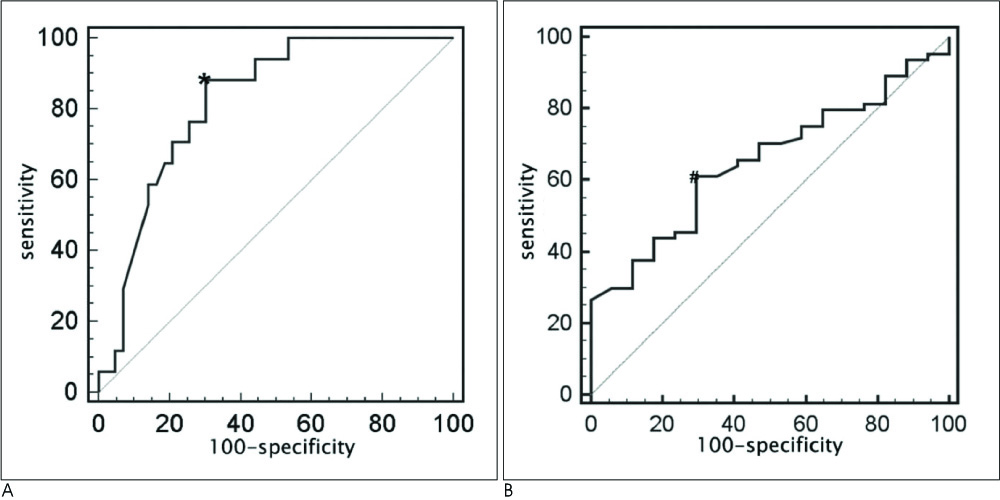
Fig. 3 The receiver operating characteristic (ROC) curve analysis between the susceptibility asymmetry index (SAI) and the presence of stenotic lesion (A), and between the SAI and successful recanalization (B). A. The SAI≤1.3 is optimal for predicting the presence of stenotic lesion (asterisk: area under the curve= 0.821, sensitivity: 88.2%, specificity: 69.8%, p=0.0001). B. Successful recanalization is optimally predicted by a SAI≤1.61 (sharp the area under the curve= 0.652, sensitivity: 60.94%, specificity: 70.59%, p=0.0226).
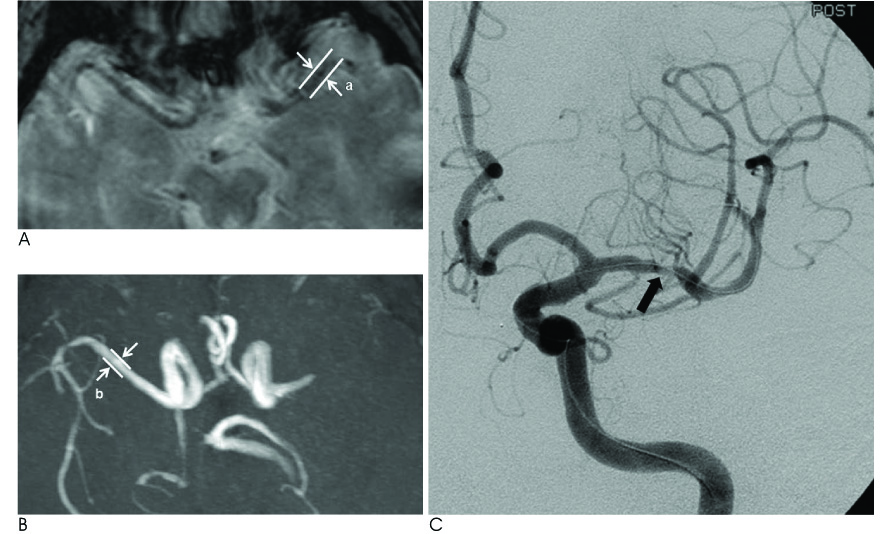
Fig. 4 A 60-year-old male with acute left MCA occlusion. The SAI was measure as 1.07 (= a/b in A and B). After balloon angioplasty, a TICI score of 3 was achieved with residual stenosis (arrow C).
Reference
-
1. Lee DH, Kang DW, Ahn JS, Choi CG, Kim SJ, Suh DC. Imaging of the ischemic penumbra in acute stroke. Korean J Radiol. 2005; 6:64–74.2. Rovira A, Orellana P, Alvarez-Sabin J, Arenillas JF, Aymerich X, Grive E, et al. Hyperacute ischemic stroke: middle cerebral artery susceptibility sign at echo-planar gradient-echo MR imaging. Radiology. 2004; 232:466–473.3. Cho KH, Kim JS, Kwon SU, Cho AH, Kang DW. Significance of susceptibility vessel sign on T2*-weighted gradient echo imaging for identification of stroke subtypes. Stroke. 2005; 36:2379–2383.4. Flacke S, Urbach H, Keller E, Traber F, Hartmann A, Textor J, et al. Middle cerebral artery (MCA) susceptibility sign at susceptibility-based perfusion MR imaging: clinical importance and comparison with hyperdense MCA sign at CT. Radiology. 2000; 215:476–482.5. Kim HS, Lee DH, Choi CG, Kim SJ, Suh DC. Progression of middle cerebral artery susceptibility sign on T2*-weighted images: its effect on recanalization and clinical outcome after thrombolysis. AJR Am J Roentgenol. 2006; 187:W650–W657.6. Molina CA, Montaner J, Arenillas JF, Ribo M, Rubiera M, Alvarez-Sabin J. Differential pattern of tissue plasminogen activator-induced proximal middle cerebral artery recanalization among stroke subtypes. Stroke. 2004; 35:486–490.7. Schellinger PD, Chalela JA, Kang DW, Latour LL, Warach S. Diagnostic and prognostic value of early MR Imaging vessel signs in hyperacute stroke patients imaged < 3 hours and treated with recombinant tissue plasminogen activator. AJNR Am J Neuroradiol. 2005; 26:618–624.8. Blinc A, Keber D, Lahajnar G, Zupancic I, Zorec-Karlovsek M, Demsar F. Magnetic resonance imaging of retracted and nonretracted blood clots during fibrinolysis in vitro. Haemostasis. 1992; 22:195–201.9. Taber KH, Hayman LA, Herrick RC, Kirkpatrick JB. Importance of clot structure in gradient-echo magnetic resonance imaging of hematoma. J Magn Reson Imaging. 1996; 6:878–883.10. Viereck J, Ruberg FL, Qiao Y, Perez AS, Detwiller K, Johnstone M, et al. MRI of atherothrombosis associated with plaque rupture. Arterioscler Thromb Vasc Biol. 2005; 25:240–245.11. Marder VJ, Chute DJ, Starkman S, Abolian AM, Kidwell C, Liebeskind D, et al. Analysis of thrombi retrieved from cerebral arteries of patients with acute ischemic stroke. Stroke. 2006; 37:2086–2093.12. Adams HP Jr, Bendixen BH, Kappelle LJ, Biller J, Love BB, Gordon DL, et al. Classification of subtype of acute ischemic stroke. Definitions for use in a multicenter clinical trial. TOAST. Trial of Org 10172 in Acute Stroke Treatment. Stroke. 1993; 24:35–41.13. Ueda T, Sakaki S, Nochide I, Kumon Y, Kohno K, Ohta S. Angioplasty after intra-arterial thrombolysis for acute occlusion of intracranial arteries. Stroke. 1998; 29:2568–2574.14. Brott T, Adams HP Jr, Olinger CP, Marler JR, Barsan WG, Biller J, et al. Measurements of acute cerebral infarction: a clinical examination scale. Stroke. 1989; 20:864–870.15. Kase CS, Furlan AJ, Wechsler LR, Higashida RT, Rowley HA, Hart RG, et al. Cerebral hemorrhage after intra-arterial thrombolysis for ischemic stroke: the PROACT II trial. Neurology. 2001; 57:1603–1610.16. Higashida RT, Furlan AJ, Roberts H, Tomsick T, Connors B, Barr J, et al. Trial design and reporting standards for intra-arterial cerebral thrombolysis for acute ischemic stroke. Stroke. 2003; 34:e109–e137.17. Kidwell CS, Chalela JA, Saver JL, Starkman S, Hill MD, Demchuk AM, et al. Comparison of MRI and CT for detection of acute intracerebral hemorrhage. JAMA. 2004; 292:1823–1830.18. Molina CA. Imaging the clot: does clot appearance predict the efficacy of thrombolysis? Stroke. 2005; 36:2333–2334.19. Leach JL, Strub WM, Gaskill-Shipley MF. Cerebral venous thrombus signal intensity and susceptibility effects on gradient recalled-echo MR imaging. AJNR Am J Neuroradiol. 2007; 28:940–945.20. Assouline E, Benziane K, Reizine D, Guichard JP, Pico F, Merland JJ, et al. Intra-arterial thrombus visualized on T2* gradient echo imaging in acute ischemic stroke. Cerebrovasc Dis. 2005; 20:6–11.21. Barreto AD, Albright KC, Hallevi H, Grotta JC, Noser EA, Khaja AM, et al. Thrombus burden is associated with clinical outcome after intra-arterial therapy for acute ischemic stroke. Stroke. 2008; 39:3231–3235.
- Full Text Links
-
- Actions
-
Cited
- CITED
-
- Close
- Share
-
- Similar articles
-
- A newly Developed Hyperintensity Within a Posterior Cerebral Artery Susceptibility Vessel Sign in T2*-Weighted Gradient-Echo Imaging: a Case Report and Correlation with Magnetic Resonance Angiography and Black-Blood Imaging
- Gradient-Echo MRI in Defining the Severity of Cerebral Fat Embolism
- Diagnostic Value of Thrombus Size on T2*-weighted Gradient Echo Imaging in Acute Middle Cerebral Artery Occlusion
- Background Gradient Correction using Excitation Pulse Profile for Fat and T2* Quantification in 2D Multi-Slice Liver Imaging
- Susceptibility Vessel Sign for the Detection of Hyperacute MCA Occlusion: Evaluation with Susceptibility-weighted MR Imaging
