Relationship between the Retinal Thickness Analyzer and the GDx VCC Scanning Laser Polarimeter, Stratus OCT Optical Coherence Tomograph, and Heidelberg Retina Tomograph II Confocal Scanning Laser Ophthalmoscopy
- Affiliations
-
- 1Siloam Eye Hospital, Seoul, Korea.
- 2Institute of Vision Research, Department of Ophthalmology, Yonsei University College of Medicine, Seoul, Korea.
- 3Nune Eye Hospital, Seoul, Korea. youngjhong@gmail.com
- KMID: 1107485
- DOI: http://doi.org/10.3341/kjo.2008.22.1.10
Abstract
- PURPOSE: To assess the relationship between the retinal thickness analyzer (RTA) parameters, and those of the GDx VCC scanning laser polarimeter (GDx VCC), Stratus OCT optical coherence tomography (Stratus OCT), and Heidelberg retinal tomograph II confocal scanning laser ophthalmoscopy (HRT II). METHODS: Twenty-nine primary open-angle glaucoma patients were retrospectively included in this study. Measurements were obtained using the RTA, GDx VCC, Stratus OCT, and HRT II. We calculated the correlation coefficients between the parameters of RTA and those of the other studies. RESULTS: Among the optic disc parameters of RTA, the cup volume was best correlated with Stratus OCT (R=0.780, p<0.001) and HRT II (R=0.896, p<0.001). Among the posterior pole retinal thickness parameters, the posterior pole abnormally thin area (PPAT) of the RTA and the inferior average of the GDx VCC were best correlated (R=-0.596, p=0.001). The PPAT of the RTA and the inferior maximum of the Stratus OCT were best correlated (R=-0.489, p=0.006). The perifoveal minimum thickness (PFMT) of the RTA and the cup shape measurement of the HRT II were best correlated (R=-0.565, p=0.004). CONCLUSIONS: Many RTA optic disc parameters were significantly correlated with those of the Stratus OCT and HRT II. The RTA posterior pole retinal thickness parameters were significantly correlated with those of the GDx VCC, Stratus OCT and HRT II. The RTA optic disc and posterior pole retinal thickness parameters may be valuable in the diagnosis of glaucoma.
Keyword
MeSH Terms
Figure
-
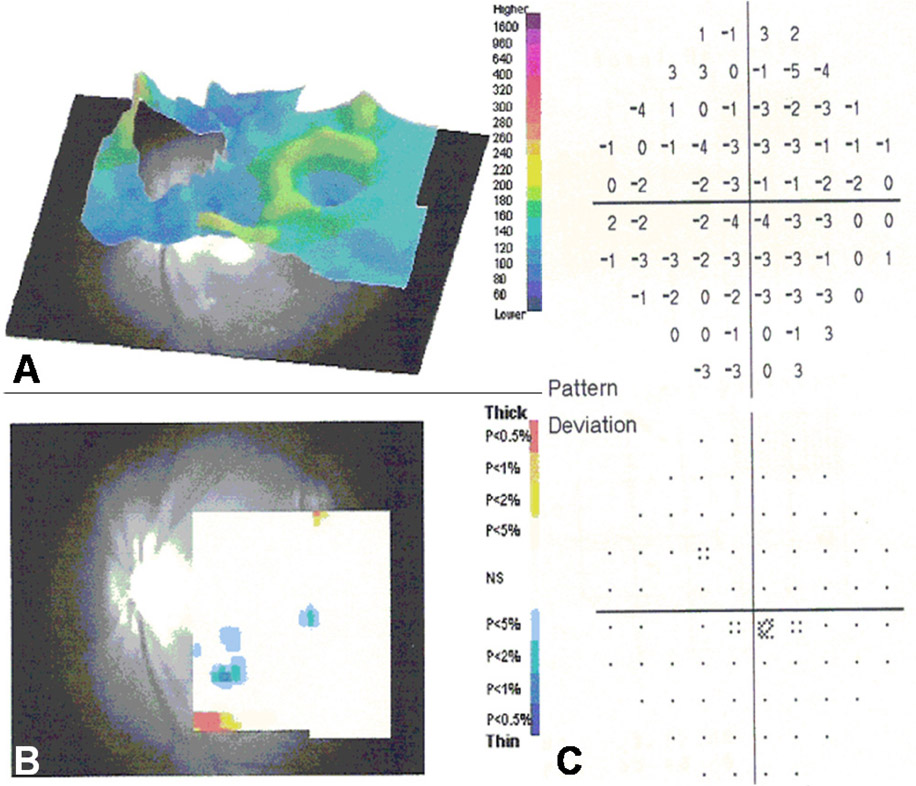
Fig. 1 This patient has a normal range of the GDx parameters, but low RTA perifoveal minimum thickness. (A) The three-dimensional image map shows a thin retinal area, inferior and nasal to the macula (B) The deviation probability map shows a thin retinal area inferior and nasal to the macula, and the perifoveal thin retinal area (C) Visual field testing shows a decreased sensitivity at the corresponding area of thin retina.
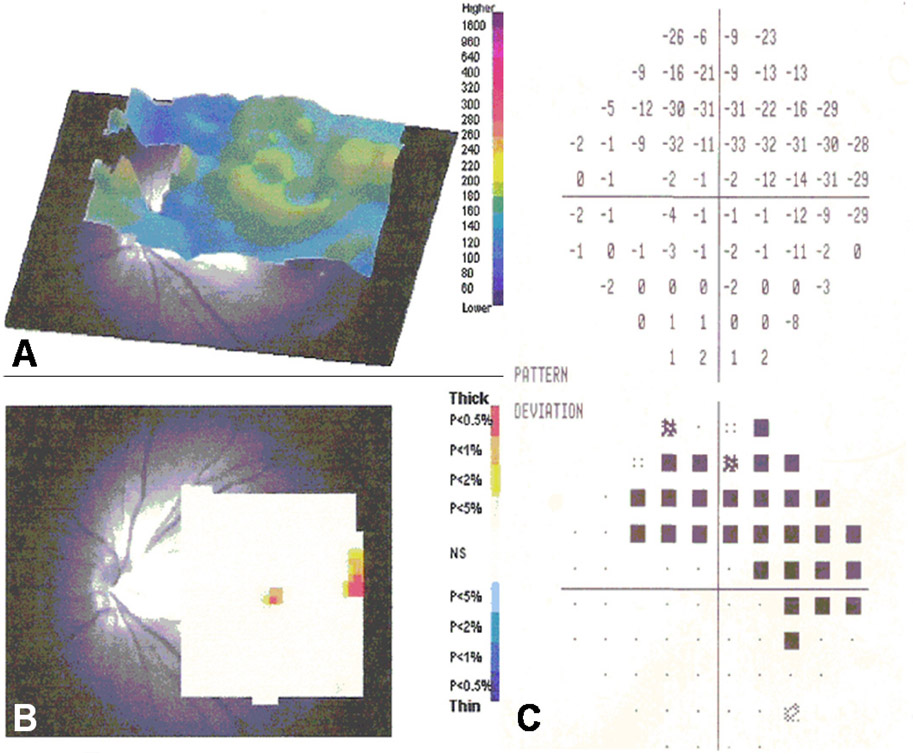
Fig. 2 This patient has a normal RTA perifoveal thickness and glaucomatous GDx parameters. (A) and (B) A three dimensional map and deviation probability shows normal retinal thickness. (C) Visual field testing shows a superior arcuate scotoma.
Cited by 1 articles
-
Correlation Between Macular, Retinal Nerve Fiber Layer Thickness, and Visual Field in Open Angle Glaucoma
Won-Do Jeong, Dongeun Lee, Joo-Hwa Lee, Joon-Woo Shin
J Korean Ophthalmol Soc. 2009;50(2):227-234. doi: 10.3341/jkos.2009.50.2.227.
Reference
-
1. Danias J, Shen F, Kavalarakis M, et al. Characterization of retinal damage in the episcleral vein cauterization rat glaucoma model. Exp Eye Res. 2006. 82:219–228.2. Ji J, Chang P, Pennesi ME, et al. Effects of elevated intraocular pressure on mouse retinal ganglion cells. Vision Res. 2005. 45:169–179.3. Guo L, Moss SE, Alexander RA, et al. Retinal ganglion cell apoptosis in glaucoma is related to intraocular pressure and IOP-induced effects on extracellular matrix. Invest Ophthalmol Vis Sci. 2005. 46:175–182.4. Glovinsky Y, Quigley HA, Pease ME. Foveal ganglion cell loss is size dependent in experimental glaucoma. Invest Ophthalmol Vis Sci. 1993. 34:395–400.5. Tanito M, Itai N, Ohira A, Chihara E. Reduction of posterior pole retinal thickness in glaucoma detected using the Retinal Thickness Analyzer. Ophthalmology. 2004. 111:265–275.6. Cvenkel B. Retinal thickness at the posterior pole in glaucoma and ocular hypertension. Graefes Arch Clin Exp Ophthalmol. 2004. 242:920–925.7. Arsani S, Zeimer R, Goldberg MF, Zou S. Application of rapid scanning retinal thickness analysis in retinal diseases. Ophthalmology. 1997. 104:1145–1151.8. Leibovitch I, Azmon B, Pianka P, et al. Macular hole secondary to branch retinal vein occlusion diagnosed by Retinal Thickness Analyzer. Ophthalmic Surg Lasers Imaging. 2003. 34:53–56.9. Funatsu H, Yamashita H, Shimizu E, et al. Quantitative measurement of retinal thickness in patients with diabetic macular edema is useful for evaluation of therapeutic agents. Diabetes Res Clin Pract. 2004. 66:219–227.10. Reus NJ, Colen TP, Lemij HG. Visualization of localized retinal nerve fiber layer defects with the GDx with individualized and with fixed compensation of anterior segment birefringence. Ophthalmology. 2003. 110:1512–1516.11. Budenz DL, Michael A, Chang RT, et al. Sensitivity and specificity of the StratusOCT for perimetric glaucoma. Ophthalmology. 2005. 112:3–9.12. Reus NJ, Lemij HG. The relationship between standard automated perimetry and GDx VCC measurements. Invest Ophthalmol Vis Sci. 2004. 45:840–845.13. Medeiros FA, Zangwill LM, Bowd C, et al. Evaluation of retinal nerve fiber layer, optic nerve head, and macular thickness measurements for glaucoma detection using optical coherence tomography. Am J Ophthalmol. 2005. 139:44–55.14. Harasymowycz PJ, Papamatheakis DG, Fansi AK, et al. Validity of screening for glaucomatous optic nerve damage using confocal scanning laser ophthalmoscopy (Heidelberg Retina Tomograph II) in high risk populations: a pilot study. Ophthalmology. 2005. 112:2164–2171.15. Strouthidis NG, White ET, Owen VM, et al. Factors affecting the test retest variability of Heidelberg retina tomograph and Heidelberg retina tomograph II measurements. Br J Ophthalmol. 2005. 89:1427–1432.16. Martinez de la Casa JM, Garcia Feijoo J, Castillo Gomez A, Garcia Sanchez J. Correlations between retinal thickness analyzer (RTA) and confocal scanning laser tomography (HRT) in optic disc analysis. Arch Soc Esp Oftalmol. 2004. 79:21–25.17. Quigley HA, Addicks EM, Green WR. Optic nerve damage in human glaucoma. III. Quantitative correlation of nerve fiber loss and visual field defect in glaucoma, ischemic neuropathy, papilledema, and toxic neuropathy. Arch Ophthalmol. 1982. 100:135–146.18. Harwerth RS, Carter Dawson L, Shen F, et al. Ganglion cell losses underlying visual field defects from experimental glaucoma. Invest Ophthalmol Vis Sci. 1999. 40:2242–2250.19. Asrani S, Zou S, d'Anna S, et al. Noninvasive mapping of the normal retinal thickness at the posterior pole. Ophthalmology. 1999. 106:269–273.20. Brigatti L, Caprioli J. Correlation of visual field with scanning confocal laser optic disc measurements in glaucoma. Arch Ophthalmol. 1995. 113:1191–1194.21. Bathija R, Zangwill L, Berry CC, et al. Detection of early glaucomatous structural damage with confocal scanning laser tomography. J Glaucoma. 1998. 7:121–127.
- Full Text Links
-
- Actions
-
Cited
- CITED
-
- Close
- Share
-
- Similar articles
-
- The Relationship between Optical Coherence Tomography and Scanning Laser Polarimetry Measurements in Glaucoma
- Comparison of Stratus OCT and GDx VCC in Detecting Localized Retinal Nerve Fiber Layer Defects
- The Parameters of the Retinal Nerve Fiber Layer Measured with Confocal Scanning Laser Ophthalmoscope & Nerve Fiber Analyzer
- Scanning Laser Polarimetry and Optical Coherence Tomography for Detection of Retinal Nerve Fiber Layer Defects
- Changes in RNFL Thickness According to the Myopia in Patients with Glaucoma and Ocular Hypertension
