Functional Reference Limits: Describing Physiological Relationships and Determination of Physiological Limits for Enhanced Interpretation of Laboratory Results
- Affiliations
-
- 1Department of General Medicine (Rheumatology), Sengkang General Hospital,Singapore, Singapore
- 2Engineering Cluster, Singapore Institute of Technology, Singapore, Singapore
- 3Faculty of Medicine Siriraj Hospital, Mahidol University, Bangkok, Thailand
- 4Department of Laboratory Medicine, National University Hospital, Singapore, Singapore
- 5Department of Clinical Biochemistry, PathWest Laboratory Medicine, Adelaide, Australia
- 6Flinders University International Centre for Point-of-Care Testing, Flinders Health and Medical Research Institute, Flinders University, Adelaide, Australia
- KMID: 2551988
- DOI: http://doi.org/10.3343/alm.2023.43.5.408
Abstract
- Functional reference limits describe key changes in the physiological relationship between a pair of physiologically related components. Statistically, this can be represented by a significant change in the curvature of a mathematical function or curve (e.g., an observed plateau). The point at which the statistical relationship changes significantly is the point of curvature inflection and can be mathematically modeled from the relationship between the interrelated biomarkers. Conceptually, they reside between reference intervals, which describe the statistical boundaries of a single biomarker within the reference population, and clinical decision limits that are often linked to the risk of morbidity or mortality and set as thresholds. Functional reference limits provide important physiological and pathophysiological insights that can aid laboratory result interpretation. Laboratory professionals are in a unique position to harness data from laboratory information systems to derive clinically relevant values. Increasing research on and reporting of functional reference limits in the literature will enhance their contribution to laboratory medicine and widen the evidence base used in clinical decision limits, which are currently almost exclusively contributed to by clinical trials. Their inclusion in laboratory reports will enhance the intellectual value of laboratory professionals in clinical care beyond the statistical boundaries of a healthy reference population and pave the way to them being considered in shaping clinical decision limits. This review provides an overview of the concepts related to functional reference limits, clinical examples of their use, and the impetus to include them in laboratory reports.
Figure
-

Fig. 1 Relationship between plasma osmolality and plasma antidiuretic hormone concentration. Not drawn to scale.

Fig. 2 Relationship between serum vitamin D and plasma parathyroid hormone concentrations represented by a regression line (solid line) and its 95% confidence interval (dashed lines). Not drawn to scale.
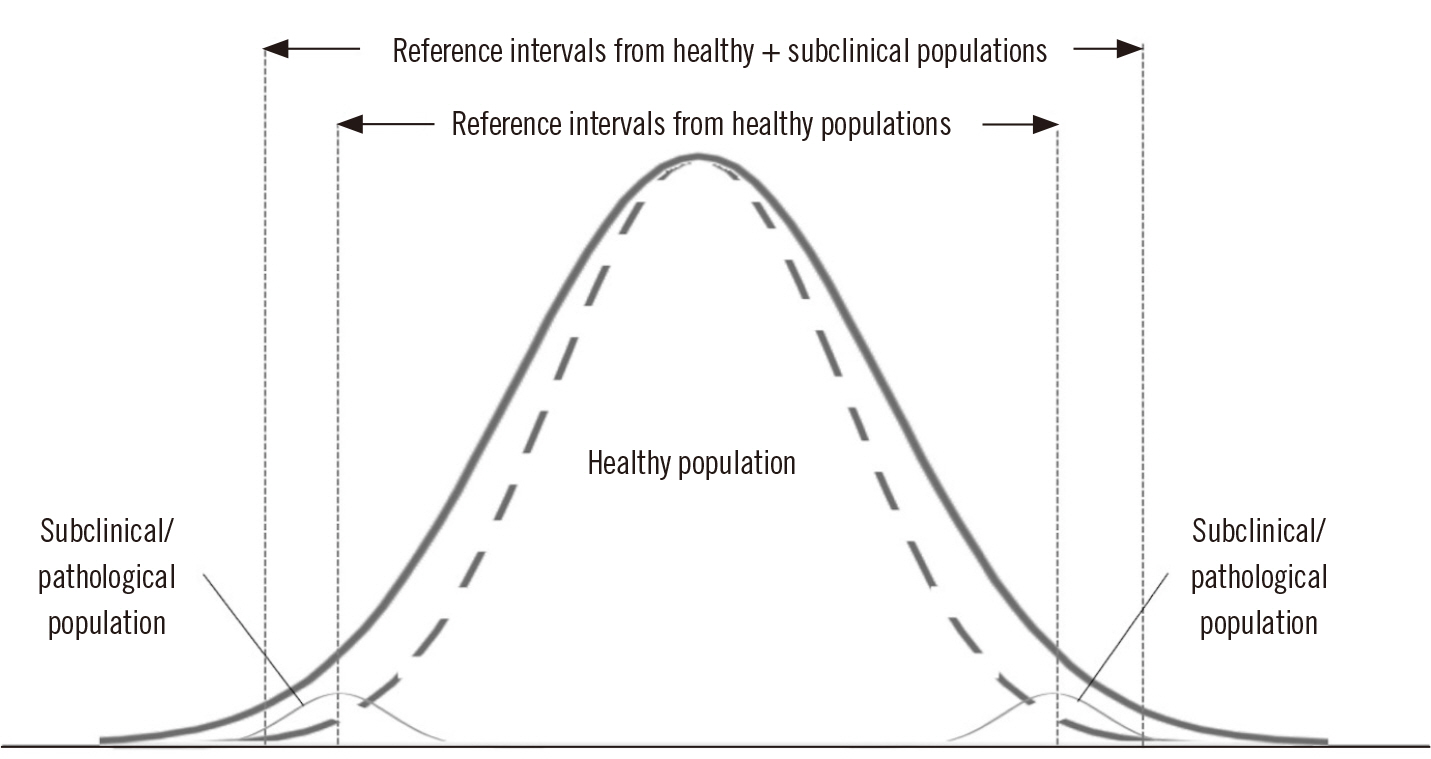
Fig. 3 Inclusion of subclinical/pathological populations may inappropriately broaden lower and upper reference limits. The dashed lines represent the distribution of the healthy population while the solid line represents the broadened distribution when subclinical/pathological populations are included.
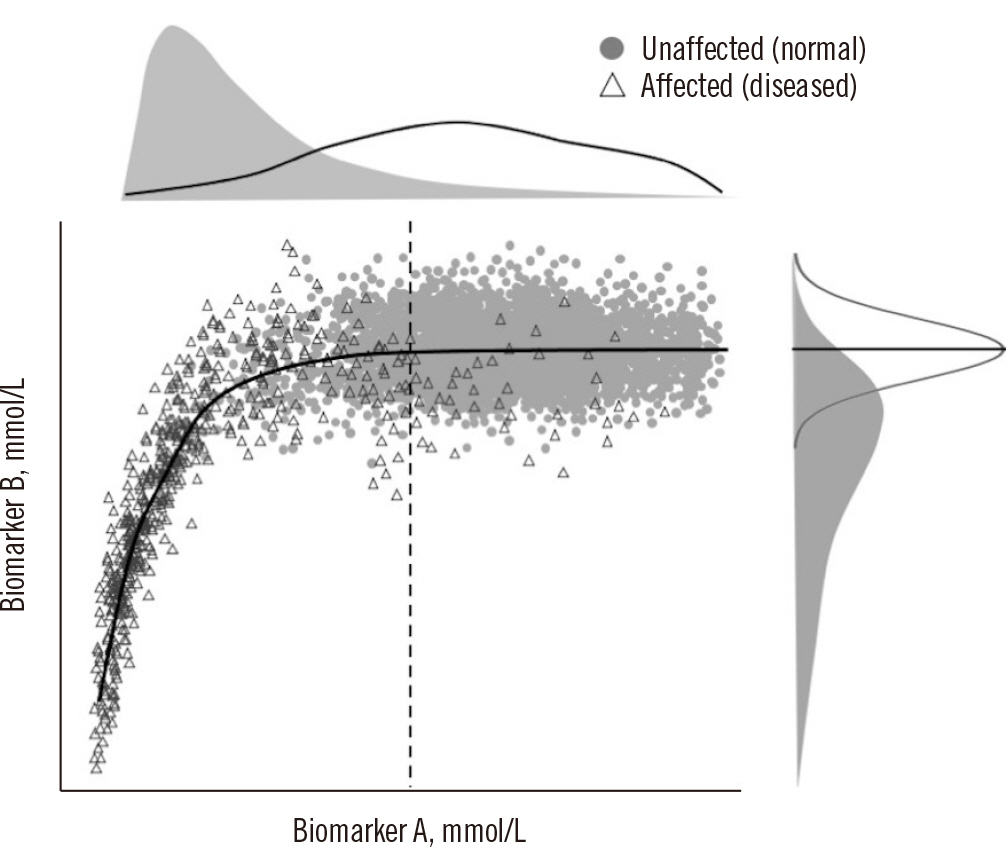
Fig. 4 Relationship between two interrelated biomarkers in different overlapping populations, normal subjects (gray circles), and pathological subjects (open triangles). The concentrations of biomarkers A and B both increase until a point where they start to plateau (change in curvature, dashed vertical line), which is considered the functional reference limit.
Reference
-
1. Miller WG, Horowitz GL, Ceriotti F, Fleming JK, Greenberg N, Katayev A, et al. 2016; Reference intervals: strengths, weaknesses, and challenges. Clin Chem. 62:916–23. DOI: 10.1373/clinchem.2016.256511. PMID: 27230874.
Article2. Ozarda Y, Sikaris K, Streichert T, Macri J. IFCC Committee on Reference intervals and Decision Limits (C-RIDL). 2018; Distinguishing reference intervals and clinical decision limits - a review by the IFCC Committee on Reference Intervals and Decision Limits. Crit Rev Clin Lab Sci. 55:420–31. DOI: 10.1080/10408363.2018.1482256. PMID: 30047297.
Article3. Jones G, Barker A. 2008; Reference intervals. Clin Biochem Rev. 29(Suppl 1):S93–7.4. Billman GE. 2020; Homeostasis: the underappreciated and far too often ignored central organizing principle of physiology. Front Physiol. 11:200. DOI: 10.3389/fphys.2020.00200. PMID: 32210840. PMCID: PMC7076167.
Article5. Rondon-Berrios H, Berl T. 2019; Physiology and pathophysiology of water homeostasis. Front Horm Res. 52:8–23. DOI: 10.1159/000493233. PMID: 32097945.
Article6. Sikaris KA. 2014; Physiology and its importance for reference intervals. Clin Biochem Rev. 35:3–14.7. Sezgin G, Loh TP, Markus C. 2021; Functional reference limits: a case study of serum ferritin. J Lab Med. 45:69–77. DOI: 10.1515/labmed-2020-0127.
Article8. Tan RZ, Markus C, Vasikaran S, Loh TP. APFCB Harmonization of Reference Intervals Working Group. 2022; Comparison of 8 methods for univariate statistical exclusion of pathological subpopulations for indirect reference intervals and biological variation studies. Clin Biochem. 103:16–24. DOI: 10.1016/j.clinbiochem.2022.02.006. PMID: 35181292.
Article9. Hawkins R. 2013; Total 25-OH vitamin D concentrations in Chinese, Malays and Indians. Ann Lab Med. 33:156–8. DOI: 10.3343/alm.2013.33.2.156. PMID: 23479565. PMCID: PMC3589645.
Article10. Holick MF, Binkley NC, Bischoff-Ferrari HA, Gordon CM, Hanley DA, Heaney RP, et al. 2011; Evaluation, treatment, and prevention of vitamin D deficiency: an Endocrine Society clinical practice guideline. J Clin Endocrinol Metab. 96:1911–30. DOI: 10.1210/jc.2011-0385. PMID: 21646368.
Article11. Morris HA. 2014; Vitamin D activities for health outcomes. Ann Lab Med. 34:181–6. DOI: 10.3343/alm.2014.34.3.181. PMID: 24790904. PMCID: PMC3999315.
Article12. Ginde AA, Wolfe P, Camargo CA Jr, Schwartz RS. 2012; Defining vitamin D status by secondary hyperparathyroidism in the U.S. population. J Endocrinol Invest. 35:42–8.13. Kirk LF Jr, Hash RB, Katner HP, Jones T. Cushing's disease: clinical manifestations and diagnostic evaluation. Am Fam Physician. 2000; 62:1119–27. 1133–4.14. Carlton E, Greenslade J, Cullen L, Body R, Than M, Pickering JW, et al. 2016; Evaluation of high-sensitivity cardiac troponin I levels in patients with suspected acute coronary syndrome. JAMA Cardiol. 1:405–12. DOI: 10.1001/jamacardio.2016.1309. PMID: 27438316.
Article15. Grundy SM, Stone NJ, Bailey AL, Beam C, Birtcher KK, Blumenthal RS, et al. 2019; 2018 AHA/ACC/AACVPR/AAPA/ABC/ACPM/ADA/AGS/APhA/ASPC/NLA/PCNA guideline on the management of blood cholesterol: a report of the American College of Cardiology/American Heart Association Task Force on Clinical Practice guidelines. Circulation. 139:e1082–143. DOI: 10.1161/CIR.0000000000000624.16. American Diabetes Association Professional Practice Committee. 2022; 2. Classification and diagnosis of diabetes: standards of medical care in Diabetes-2022. Diabetes Care. 45:S17–S38. DOI: 10.2337/dc22-S002. PMID: 34964875.17. Tan EH, Yang Z, Li Y, Metz MP, Loh TP. 2019; Outcome-based critical result thresholds in the adult patient population. Am J Clin Pathol. 152:177–84. DOI: 10.1093/ajcp/aqz026. PMID: 31067292.
Article18. Du H, Markus C, Metz M, Feng M, Loh TP. 2018; Derivation of outcome-based pediatric critical values. Am J Clin Pathol. 149:324–31. DOI: 10.1093/ajcp/aqx165. PMID: 29474506.
Article19. Agha F, Akhter P, Khan RA. 1987; Serum ferritin levels in apparently healthy subjects. J Pak Med Assoc. 37:63–6.20. Sezgin G, Monagle P, Loh TP, Ignjatovic V, Hoq M, Pearce C, et al. 2020; Clinical thresholds for diagnosing iron deficiency: comparison of functional assessment of serum ferritin to population based centiles. Sci Rep. 10:18233. DOI: 10.1038/s41598-020-75435-5. PMID: 33106588. PMCID: PMC7589482.
Article21. Markus C, Saxon B, Metz M. 2019; Ferritin as a functional biomarker of iron status in children and young adults. Br J Haematol. 184:640–2. DOI: 10.1111/bjh.15127. PMID: 29468653.
Article22. Foy BH, Li A, McClung JP, Ranganath R, Higgins JM. 2020; Data-driven physiologic thresholds for iron deficiency associated with hematologic decline. Am J Hematol. 95:302–9. DOI: 10.1002/ajh.25706. PMID: 31849101.
Article23. Shah S, Chiang C, Sikaris K, Lu Z, Bui M, Zebaze R, et al. 2017; Serum 25-hydroxyvitamin D insufficiency in search of a bone disease. J Clin Endocrinol Metab. 102:2321–8. DOI: 10.1210/jc.2016-3189. PMID: 28379394.
Article24. Jones GRD, Haeckel R, Loh TP, Sikaris K, Streichert T, Katayev A, et al. 2018; Indirect methods for reference interval determination - review and recommendations. Clin Chem Lab Med. 57:20–9. DOI: 10.1515/cclm-2018-0073. PMID: 29672266.
Article25. Kang T, Yoo J, Jekarl DW, Chae H, Kim M, Park YJ, et al. 2023; Indirect method for estimation of reference intervals of inflammatory markers. Ann Lab Med. 43:55–63. DOI: 10.3343/alm.2023.43.1.55. PMID: 36045057. PMCID: PMC9467833.
Article26. Sung JY, Seo JD, Ko DH, Park MJ, Hwang SM, Oh S, et al. 2021; Establishment of pediatric reference intervals for routine laboratory tests in Korean population: a retrospective multicenter analysis. Ann Lab Med. 41:155–70. DOI: 10.3343/alm.2021.41.2.155. PMID: 33063677. PMCID: PMC7591287.
Article27. Tan RZ, Markus C, Vasikaran S, Loh TP. APFCB Harmonization of Reference Intervals Working Group. APFCB Harmonization of Reference Intervals Working Group. Comparison of two (data mining) indirect approaches for between-subject biological variation determination. Clin Biochem. 2022; 105-106:57–63. DOI: 10.1016/j.clinbiochem.2022.04.015. PMID: 35489473.
Article28. Tan RZ, Markus C, Vasikaran S, Loh TP. APFCB Harmonization of Reference Intervals Working Group. 2022; Comparison of four indirect (data mining) approaches to derive within-subject biological variation. Clin Chem Lab Med. 60:636–44. DOI: 10.1515/cclm-2021-0442. PMID: 35107229.
Article29. Loh TP, Ranieri E, Metz MP. 2014; Derivation of pediatric within-individual biological variation by indirect sampling method: an LMS approach. Am J Clin Pathol. 142:657–63. DOI: 10.1309/AJCPHZLQAEYH94HI. PMID: 25319981.30. Loh TP, Metz MP. 2015; Indirect estimation of pediatric between-individual biological variation data for 22 common serum biochemistries. Am J Clin Pathol. 143:683–93. DOI: 10.1309/AJCPB7Q3AHYLJTPK. PMID: 25873502.
Article31. Chai JH, Flatman R, Teis B, Sethi SK, Badrick T, Loh TP. 2019; Indirect derivation of biological variation data and analytical performance specifications for therapeutic drug monitoring activities. Pathology. 51:281–5. DOI: 10.1016/j.pathol.2018.12.418. PMID: 30803737.
Article32. Yang Z, Tan EH, Li Y, Lim B, Metz MP, Loh TP. 2019; Relative criticalness of common laboratory tests for critical value reporting. J Clin Pathol. 72:325–8. DOI: 10.1136/jclinpath-2018-205549. PMID: 30593460.
Article33. Loh TP, Metz MP. 2015; Trends and physiology of common serum biochemistries in children aged 0-18 years. Pathology. 47:452–61. DOI: 10.1097/PAT.0000000000000274. PMID: 26126034.
Article34. Loh TP, Antoniou G, Baghurst P, Metz MP. 2014; Development of paediatric biochemistry centile charts as a complement to laboratory reference intervals. Pathology. 46:336–43. DOI: 10.1097/PAT.0000000000000118. PMID: 24798150.
Article35. Krause JR, Stolc V. 1980; Serum ferritin and bone marrow biopsy iron stores. II. Correlation with low serum iron and Fe/TIBC ratio less than 15%. Am J Clin Pathol. 74:461–4. DOI: 10.1093/ajcp/74.4.461. PMID: 7424828.
Article36. Åsberg A, Mikkelsen G, Thorstensen K, Åsberg AE. 2013; Lower hemoglobin with lower ferritin: it is not just a question of anemia. Scand J Clin Lab Invest. 73:622–6. DOI: 10.3109/00365513.2013.835863. PMID: 24047331.
Article37. Abdullah K, Birken CS, Maguire JL, Fehlings D, Hanley AJ, Thorpe KE, et al. 2017; Re-evaluation of serum ferritin cut-off values for the diagnosis of iron deficiency in children aged 12-36 months. J Pediatr. 188:287–90. DOI: 10.1016/j.jpeds.2017.03.028. PMID: 28431746.
Article38. Choy KW, Sezgin G, Wijeratne N, Calleja J, Liwayan R, Rathnayake G, et al. 2022; Assessment of analytical bias in ferritin assays and impact on functional reference limits. Pathology. 54:302–7. DOI: 10.1016/j.pathol.2021.06.123. PMID: 34538480.
Article39. Mrazek C, Lippi G, Keppel MH, Felder TK, Oberkofler H, Haschke-Becher E, et al. 2020; Errors within the total laboratory testing process, from test selection to medical decision-making - a review of causes, consequences, surveillance and solutions. Biochem Med (Zagreb). 30:020502. DOI: 10.11613/BM.2020.020502. PMID: 32550813. PMCID: PMC7271754.
Article40. Hickner J, Thompson PJ, Wilkinson T, Epner P, Sheehan M, Pollock AM, et al. 2014; Primary care physicians' challenges in ordering clinical laboratory tests and interpreting results. J Am Board Fam Med. 27:268–74. DOI: 10.3122/jabfm.2014.02.130104. PMID: 24610189.
Article41. Gandhi TK, Kachalia A, Thomas EJ, Puopolo AL, Yoon C, Brennan TA, et al. 2006; Missed and delayed diagnoses in the ambulatory setting: a study of closed malpractice claims. Ann Intern Med. 145:488–96. DOI: 10.7326/0003-4819-145-7-200610030-00006. PMID: 17015866.
Article42. Kachalia A, Gandhi TK, Puopolo AL, Yoon C, Thomas EJ, Griffey R, et al. 2007; Missed and delayed diagnoses in the emergency department: a study of closed malpractice claims from 4 liability insurers. Ann Emerg Med. 49:196–205. DOI: 10.1016/j.annemergmed.2006.06.035. PMID: 16997424.
Article
- Full Text Links
-
- Actions
-
Cited
- CITED
-
- Close
- Share
-
- Similar articles
-
- Usefulness of Reference Change Values for Delta Check Limits in Clinical Laboratory Testing
- The variability in detection and interpretation of roentgenographic pulmonary shadow
- Deviated nose: Physiological and pathological changes of the nasal cavity
- Physiological spaces and multicompartmental pharmacokinetic models
- Establishing Reference Intervals for Soluble ST2 Assay in a Korean Population
