A New Concept in Antidiabetic Therapeutics: A Concerted Removal of Labile Iron and Intracellular Deposition of Zinc
- Affiliations
-
- 1Department of Biochemistry and Molecular Biology, Institute of Medical Research Israel-Canada, The Hebrew University of Jerusalem, Jerusalem (HUJI), Jerusalem, Israel
- 2Concenter Biopharma, Jerusalem, Israel
- KMID: 2551263
- DOI: http://doi.org/10.4093/dmj.2022.0292
Abstract
- Background
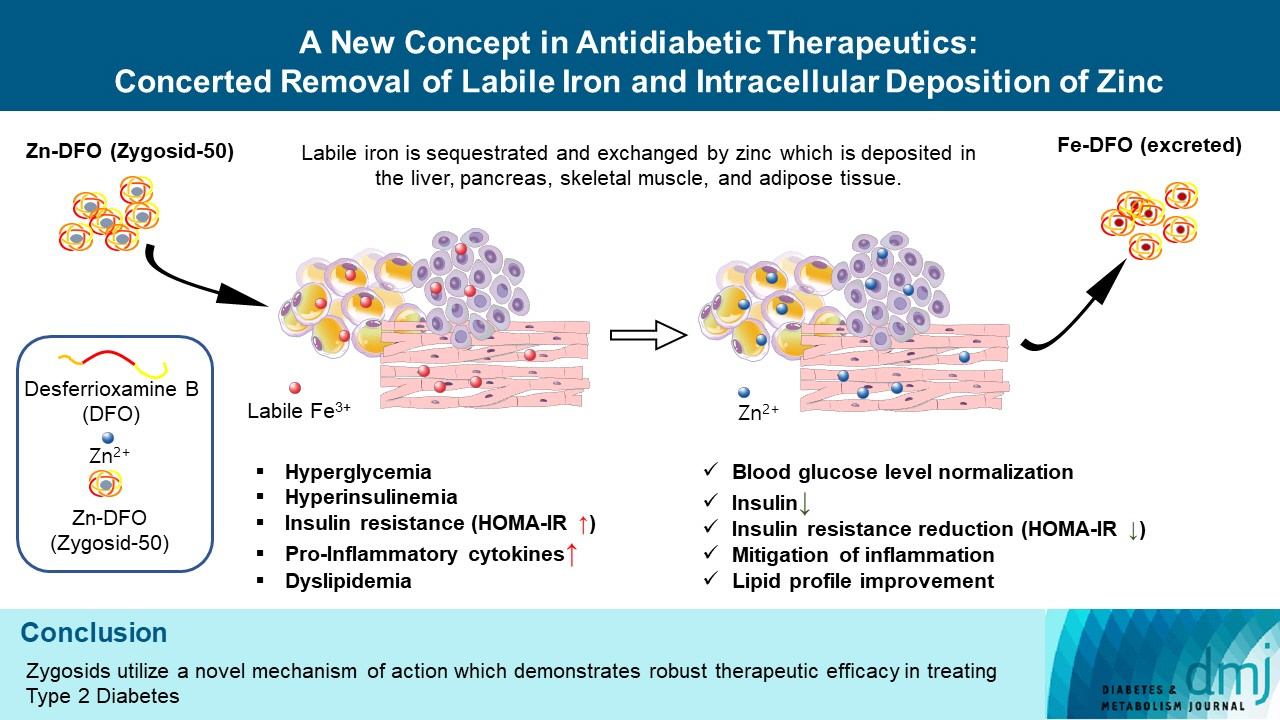
The inflammatory process is known to be an integral part of the pathophysiology of type 2 diabetes mellitus (T2DM). The “labile,” redox-active iron, serving as a catalyst in Fenton reaction, producing the deleterious reactive oxygen species, triggering and maintaining inflammation, is hypothesized to play a causative role in this process. Concenter Biopharma continued the development of a new platform of iron chelators (Zygosids), first initiated at the Hebrew University of Jerusalem, Israel (HUJI), acting via the novel mechanism, based on a sequestration of the labile redox-active iron and its substitution by zinc or gallium. The mode of action of Zygosids is based on the higher affinity of the metal-binding moiety of the complex to Fe3+ in comparison to already bound ion, leading to rapid release of the ion of another metal and chelation of Fe3+. Concomitantly, zinc ion, released by the complex, is known for its antidiabetic and anti-inflammatory role.
Methods
The therapeutic effect of zinc-desferrioxamine (Zygosid-50) and gallium-desferrioxamine, was tested on fat sand rat (Psammomys obesus) model of diet-induced T2DM and on Leprdb transgenic diabetic mice.
Results
Zygosids demonstrated an ability to noticeably reduce blood glucose and insulin levels and improve the lipid profile. Moreover, an ability to mitigate insulin resistance by >90% was shown on the sand rat model. In addition, a potent anti-inflammatory effect, expressed as a diminishment of the proinflammatory cytokines in tissue levels, was demonstrated.
Conclusion
Zygosids demonstrated robust therapeutic efficacy in treatment of T2DM. Importantly, no adverse effects were detected, in all the experiments, indicating high safety profile.
Figure
-
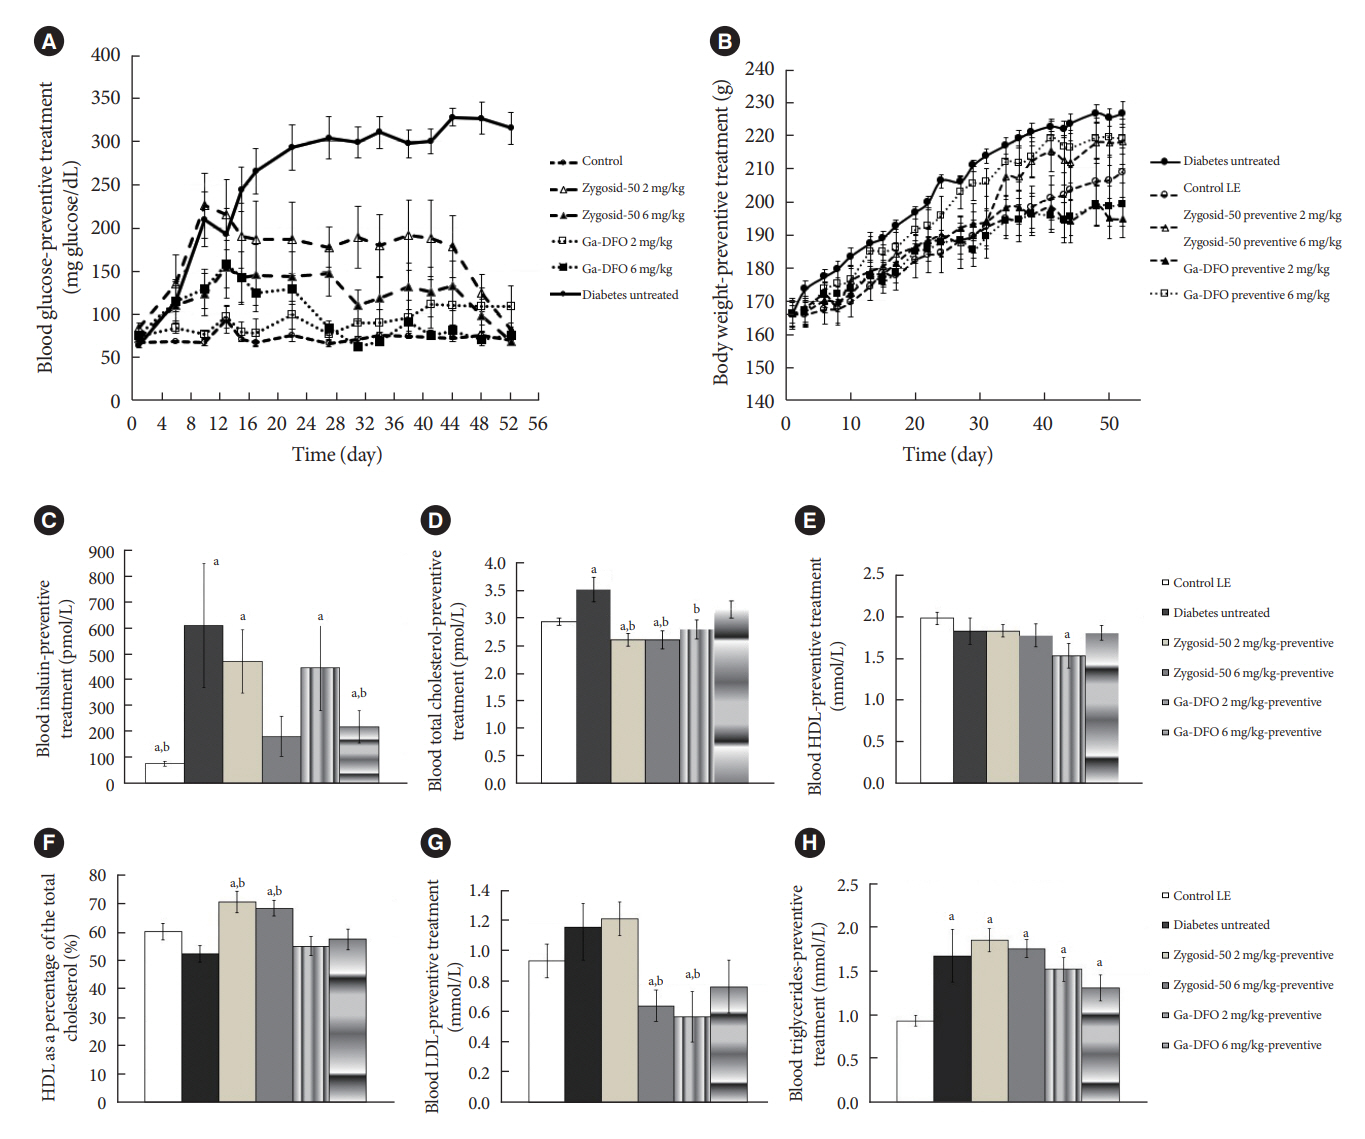
Fig. 1. Effect of the preventive administration of Zygosid-50 and gallium-desferrioxamine (Ga-DFO) on sand rats’ (A) blood glucose level (BGL), (B) body weight, (C) serum insulin, (D) total cholesterol, (E) high-density lipoprotein (HDL), (F) HDL as a percentage of the total cholesterol, (G) low-density lipoprotein (LDL), and (H) triglycerides. Ten 12 weeks old male sand rats (Psammomys obesus) from the diabetes-prone sub-strain were transferred onto the high-energy diet (HED) on day 1. The animals were divided into six groups. Group 1: low energy (LE) diet, untreated controls (n=12); Group 2: HED, sham-treated (n=10); Group 3: HED, treated with Zygosid-50 2 mg/kg (n=8); Group 4: HED, treated with Zygosid-50 6 mg/kg (n=9); Group 5: HED, treated with Ga-DFO 2 mg/kg (n=8); Group 6: HED, treated with Ga-DFO 6 mg/kg (n=8). Treatment was started from day 1 of the study. The drugs were given by intraperitoneal injection 3×/week. Throughout the experiment the animals’ blood glucose was monitored three times a week (A) body weight twice a week (B). On day 52 the animals were euthanized, and blood was taken for assessment of serum insulin (C), and lipid profile (total serum cholesterol, HDL, LDL, triglycerides) (D, E, F, G, H). (A) Starting from day 16, the values observed in all groups were significantly lower (P<0.05) than those in HED sham-treated one. Treatment with either Zygosid had no statistically significant effect on the body weight (B). The values are shown as average±standard error. aP≤ 0.05 vs. control group, bP≤0.05 vs. diabetes sham-treated group.
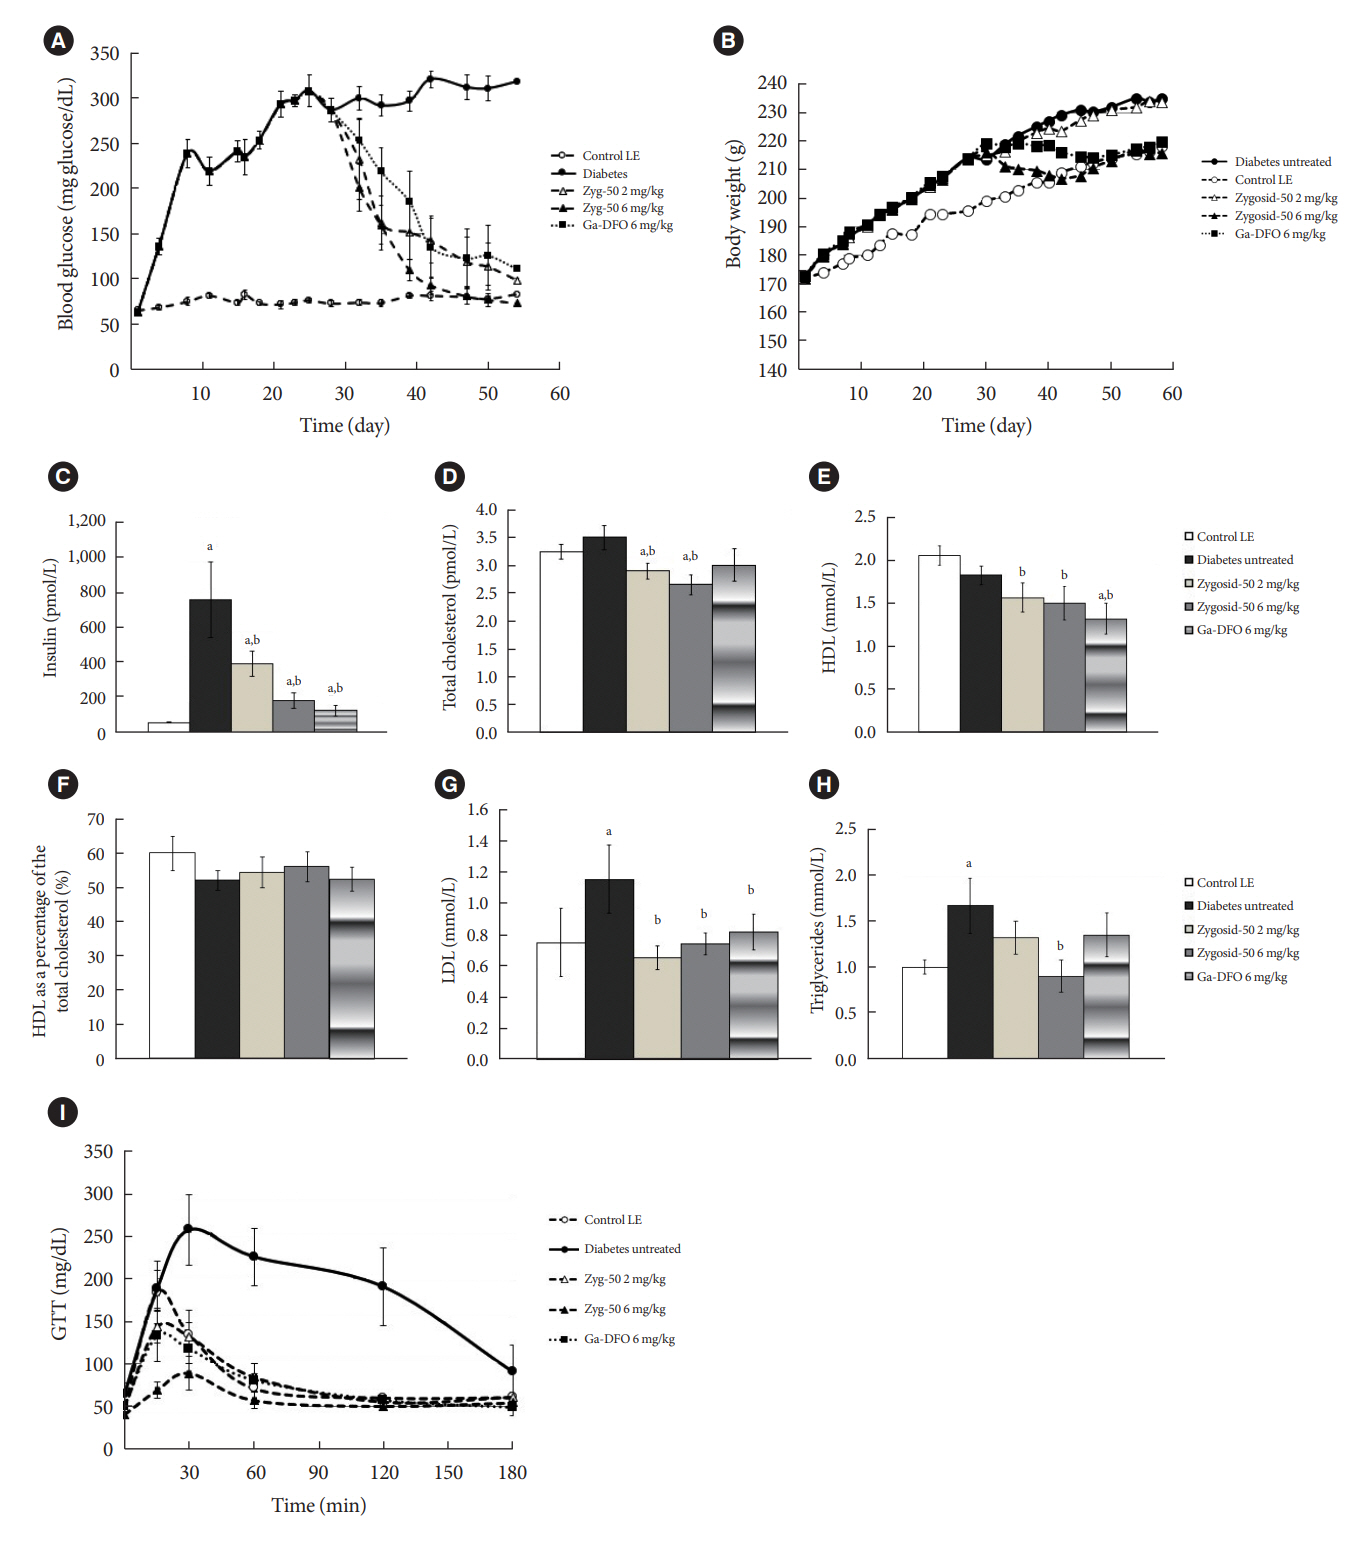
Fig. 2. Effect of treatment of the diabetic sand rats with Zygosid-50 and gallium-desferrioxamine (Ga-DFO) on (A) blood glucose level (BGL), (B) body weight, (C) serum insulin, (D) total cholesterol, (E) high-density lipoprotein (HDL), (F) HDL as a percentage of the total cholesterol, (G) low-density lipoprotein (LDL), (H) triglycerides, and (I) glucose tolerance, shown as results of intraperitoneal (i.p.)-glucose tolerance test (GTT). Ten 12 weeks old male sand rats (Psammomys obesus) from the diabetes-prone sub-strain were transferred onto the high-energy diet (HED) on day 1. The animals were divided into five groups. Group 1: low energy (LE) diet, untreated controls (n=8); Group 2: HED, sham-treated (n=14); Group 3: HED, treated with Zygosid-50 2 mg/kg (n=10); Group 4: HED, treated with Zygosid-50 6 mg/kg (n=12); Group 5: HED, treated Ga-DFO 6 mg/kg (n=10). Treatment was started from days 27/28 of the experiment. The drug was given by i.p. injection 3×/week. Throughout the experiment blood glucose was measured thrice a week (A), and body weight twice a week (B). On day 57 the animals were euthanized, and blood was taken for assessment of serum insulin (C) and lipid profile (D, E, F, G, H). (A) Starting from day 30, the values observed in all groups were significantly lower (P<0.05) than those in HED shamtreated one. (I) The i.p.-GTT and homeostasis model assessment of insulin resistance (Fig. 3) calculations were conducted at the end of the study. In i.p.-GTT results the values of HED sham-treated group from 30 minutes. were significantly higher than all other groups. The P values of all treatment groups versus the control increased to >0.05 after 60 minutes. The values are shown as average±standard error. aP≤0.05 vs. control group, bP≤0.05 vs. diabetes sham-treated group.
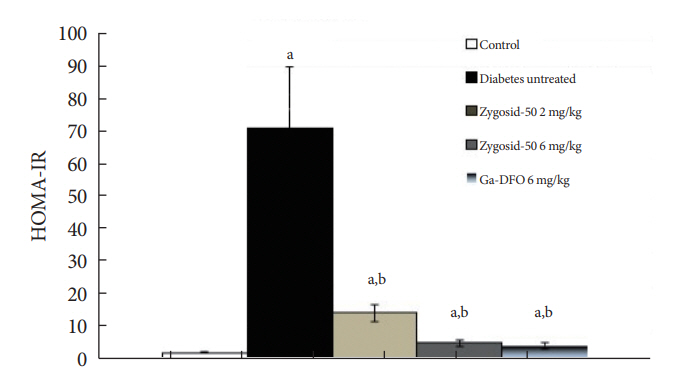
Fig. 3. Effect of treatment of the diabetic sand rats with Zygosid-50 and gallium-desferrioxamine (Ga-DFO) on insulin resistance, expressed as homeostasis model assessment of insulin resistance (HOMA-IR). The values are shown as average±standard error. aP≤0.05 vs. control group, bP≤0.05 vs. diabetes sham-treated group.

Fig. 4. Effect of treatment of the diabetic sand rats with Zygosid-50 and gallium-desferrioxamine (Ga-DFO) on indicators of diabetic complications, e.g., (A) alanine transaminase (ALT), (B) non-alcoholic steatohepatitis (NASH) severity score, and (C) cataract. (D) These representative images of type 2 diabetes mellitus-induced cataracts in sand rat. Immediately after euthanasia, ALT, the blood marker of NASH was measured (A). Samples from the liver underwent H&E staining and analyzed for NASH severity score as described by Brunt et al. [27], measuring the percent of intra-hepatocyte macro-vesicular fat, as following: 0%, score 0; <30%, score 1; 31%–50%, score 2; >51%, score 3 (B). On the last day of the experiment cataract formation was visually assessed, according to the following score: 3: cataract covering more than 75% of the visible area on at least one eye; 2–3: cataract covering more than 50% of the visible area on at least one eye; 1–2: cataract covering <50% of the visible area on at least one eye; 0: no signs of cataract detected (C). The values are shown as average±standard error. aP≤0.05 vs. control group, bP≤0.05 vs. diabetes shamtreated group.
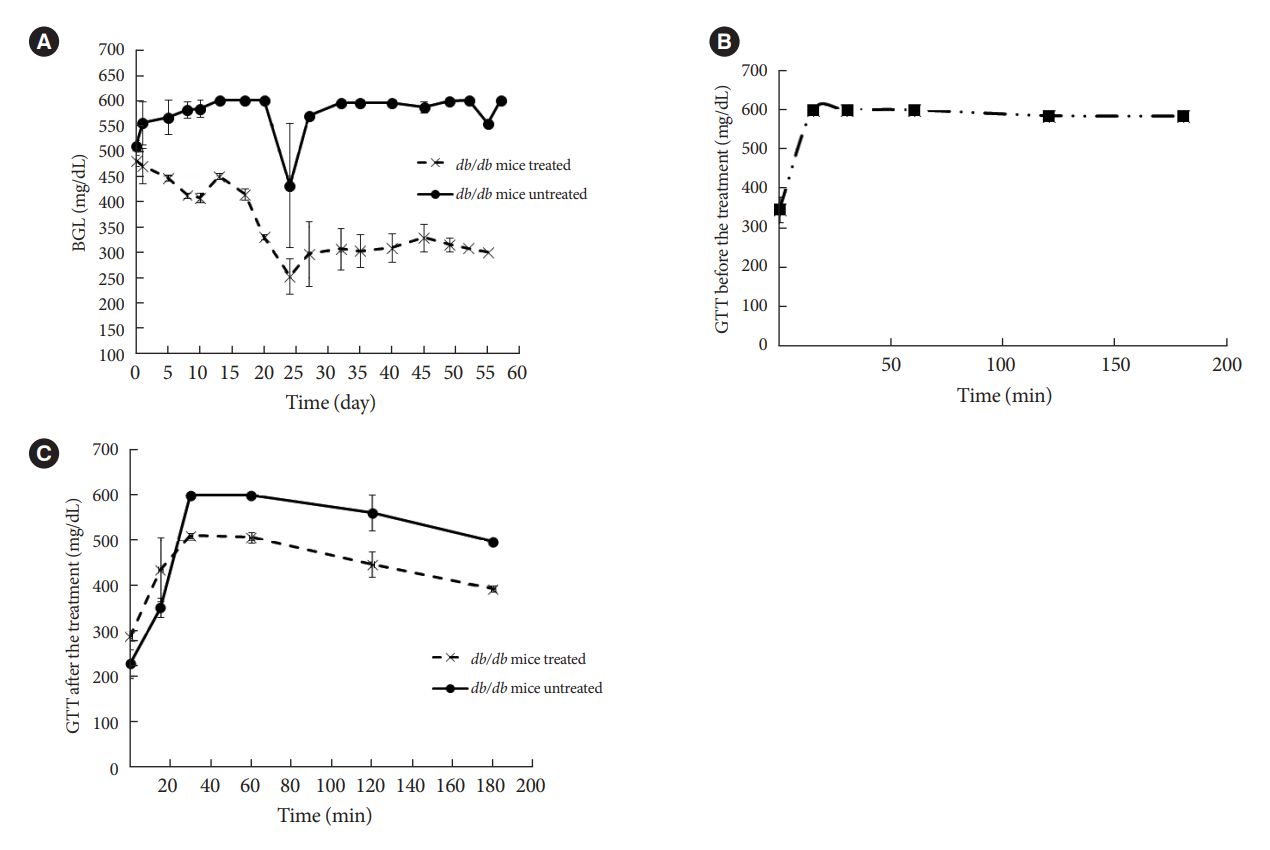
Fig. 5. Effect of treatment of diabetic leptin receptor (Lepr)db mice with Zygosid-50 on (A) blood glucose level (BGL) and (B, C) intraperitoneal (i.p.)-glucose tolerance test (GTT). Eight male BKS.Cg-Dock7m+/+ Leprdb/J mice 8 to 9 weeks old were divided into two groups of n=4. Group 1 was treated with Zygosid-50 6 mg/kg body weight thrice a week for 60 days, while the second one served as a sham-treated control. i.p.-GTT was performed in the beginning of the experiment and 2 days before the euthanasia. (A, C) The P value between the treated and untreated groups was <0.05 in all time points. The values are shown as average±standard error.
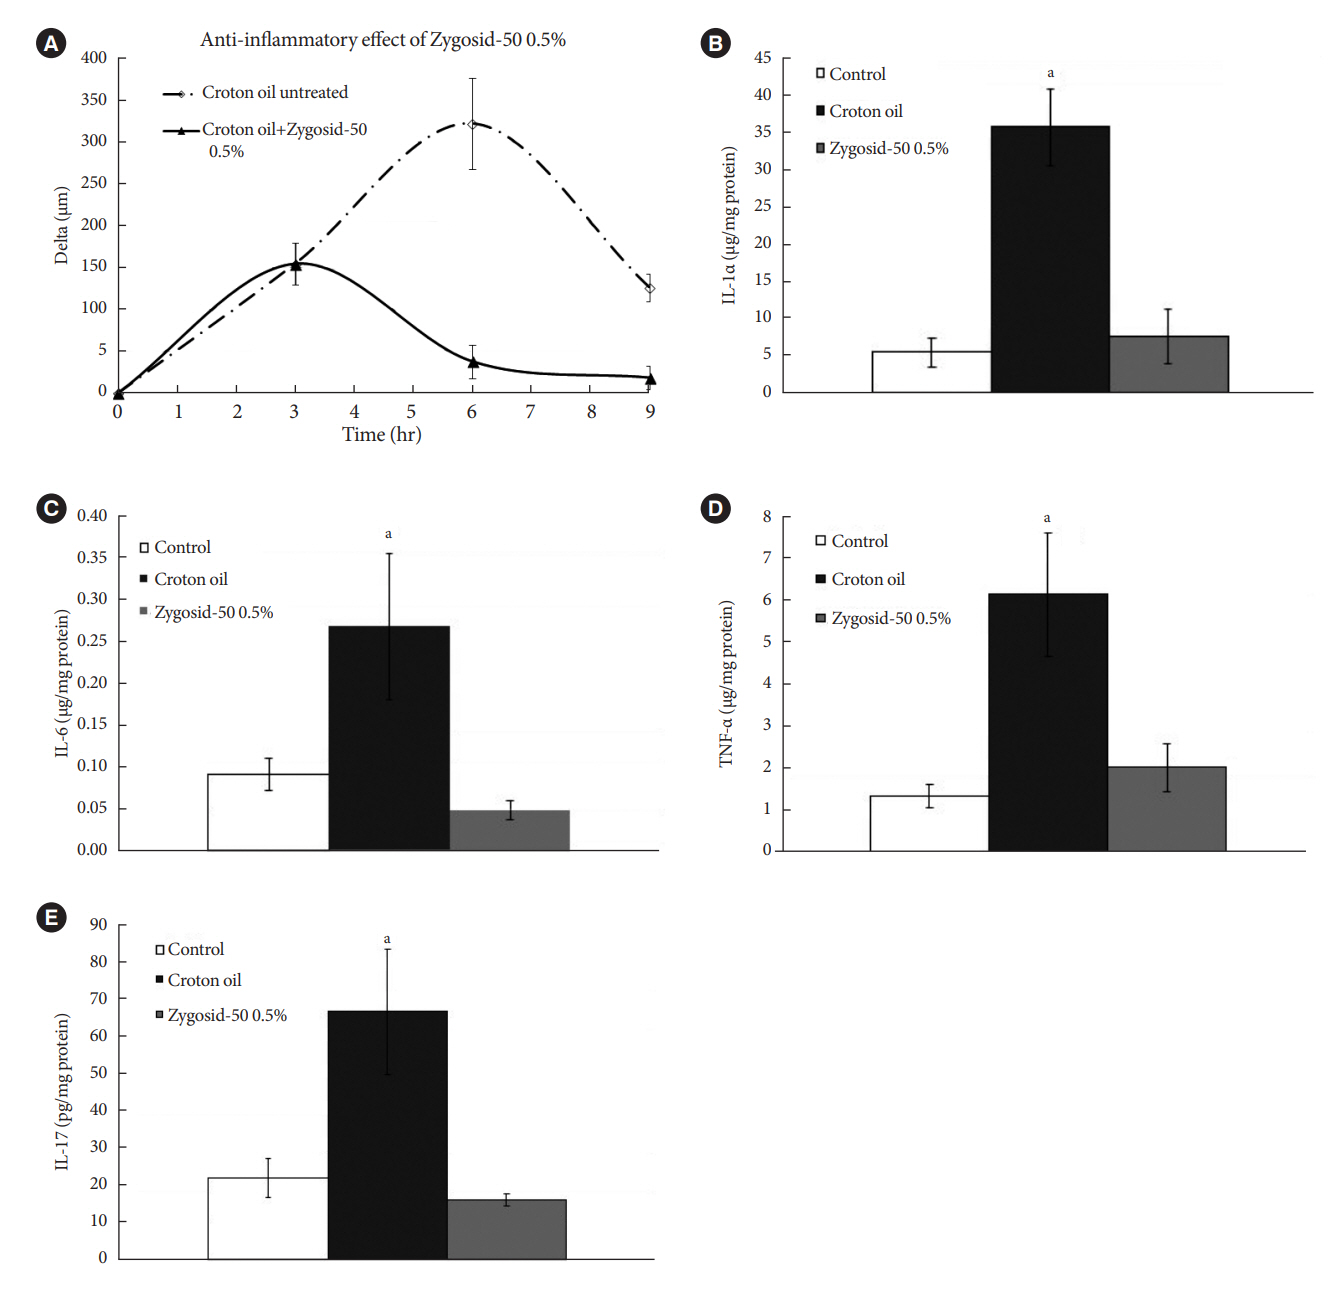
Fig. 6. The therapeutic effect of Zygosid-50 delivered topically against croton oil-induced inflammation, expressed as (A) ear swelling, (B) interleukin 1α (IL-1α), (C) IL-6, (D) tumor necrosis factor-α (TNF-α), and (E) IL-17. Three groups of 12-week-old female Balb/c mice (n=6 per group) were used. Irritant contact dermatitis was induced by epicutaneous application of croton oil solution on ear. Ear thickness was monitored with an engineer’s micrometer, along the experiment: immediately before the exposure to the croton oil, and at 3, 6, 9 hours following the exposure. The pre-exposure thickness value was subtracted from the post-exposure values at each time point, quantifying the severity of inflammation. Group 1 remained untreated. A fingertip of Vaseline (Group 2) or Zygosid-50 0.5% ointment (Group 3) was applied once, 3 hours after the first exposure to the irritant. Six hours after the exposure the mice were euthanized, the ears were immediately harvested. Cytokine concentrations (relative to protein levels) were determined by enzyme-linked immunosorbent assay (ELISA) methods, employing commercially available kits, according to the Manufacturers’ protocols. The cytokines measured included: IL-1α (ELM-IL1a-1, RayBiotech), IL-6 (ELM-IL6-CL-1, RayBiotech), TNF-α (ELM-TNFa-CL-1, RayBiotech), and IL-17 (EKA51897, Biomatik). The values are shown as average±standard error. aP≤0.05 vs. control.
Reference
-
1. O’Connell JM, Manson SM. Understanding the economic costs of diabetes and prediabetes and what we may learn about reducing the health and economic burden of these conditions. Diabetes Care. 2019; 42:1609–11.2. GlobalData. Type 2 diabetes market to more than double, to $64 billion by 2026. Available from: https://www.globaldata.com/media/press-release/type-2-diabetes-market-double-64-billion-2026 (cited 2023 May 15).3. Fernandez-Real JM, McClain D, Manco M. Mechanisms linking glucose homeostasis and iron metabolism toward the onset and progression of type 2 diabetes. Diabetes Care. 2015; 38:2169–76.4. Chirumbolo S, Rossi AP, Rizzatti V, Zoico E, Franceschetti G, Girelli D, et al. Iron primes 3T3-L1 adipocytes to a TLR4-mediated inflammatory response. Nutrition. 2015; 31:1266–74.5. Andrews M, Soto N, Arredondo-Olguin M. Association between ferritin and hepcidin levels and inflammatory status in patients with type 2 diabetes mellitus and obesity. Nutrition. 2015; 31:51–7.6. MacDonald MJ, Cook JD, Epstein ML, Flowers CH. Large amount of (apo)ferritin in the pancreatic insulin cell and its stimulation by glucose. FASEB J. 1994; 8:777–81.7. Aigner E, Felder TK, Oberkofler H, Hahne P, Auer S, Soyal S, et al. Glucose acts as a regulator of serum iron by increasing serum hepcidin concentrations. J Nutr Biochem. 2013; 24:112–7.8. Niederau C, Berger M, Stremmel W, Starke A, Strohmeyer G, Ebert R, et al. Hyperinsulinaemia in non-cirrhotic haemochromatosis: impaired hepatic insulin degradation? Diabetologia. 1984; 26:441–4.9. Davis RJ, Corvera S, Czech MP. Insulin stimulates cellular iron uptake and causes the redistribution of intracellular transferrin receptors to the plasma membrane. J Biol Chem. 1986; 261:8708–11.10. Ferrannini E. Insulin resistance, iron, and the liver. Lancet. 2000; 355:2181–2.11. Dongiovanni P, Ruscica M, Rametta R, Recalcati S, Steffani L, Gatti S, et al. Dietary iron overload induces visceral adipose tissue insulin resistance. Am J Pathol. 2013; 182:2254–63.12. Fernandez-Real JM, Lopez-Bermejo A, Ricart W. Cross-talk between iron metabolism and diabetes. Diabetes. 2002; 51:2348–54.13. Cutler P. Deferoxamine therapy in high-ferritin diabetes. Diabetes. 1989; 38:1207–10.14. Kaye TB, Guay AT, Simonson DC. Non-insulin-dependent diabetes mellitus and elevated serum ferritin level. J Diabetes Complications. 1993; 7:246–9.15. De Sanctis V, Soliman A, Yassin M. Iron overload and glucose metabolism in subjects with β-thalassaemia major: an overview. Curr Diabetes Rev. 2013; 9:332–41.16. Chevion M. Protection against free radical-induced and transition metal-mediated damage: the use of “pull” and “push” mechanisms. Free Radic Res Commun. 1991; 12-13 Pt 2:691–6.17. Keberle H. The biochemistry of desferrioxamine and its relation to iron metabolism. Ann N Y Acad Sci. 1964; 119:758–68.18. Hjorth CF, Norrman M, Wahlund PO, Benie AJ, Petersen BO, Jessen CM, et al. Structure, aggregation, and activity of a covalent insulin dimer formed during storage of neutral formulation of human insulin. J Pharm Sci. 2016; 105:1376–86.19. Egefjord L, Petersen AB, Rungby J. Zinc, alpha cells and glucagon secretion. Curr Diabetes Rev. 2010; 6:52–7.20. Norouzi S, Adulcikas J, Sohal SS, Myers S. Zinc transporters and insulin resistance: therapeutic implications for type 2 diabetes and metabolic disease. J Biomed Sci. 2017; 24:87.21. Wu Y, Lu H, Yang H, Li C, Sang Q, Liu X, et al. Zinc stimulates glucose consumption by modulating the insulin signaling pathway in L6 myotubes: essential roles of Akt-GLUT4, GSK3β and mTOR-S6K1. J Nutr Biochem. 2016; 34:126–35.22. Olechnowicz J, Tinkov A, Skalny A, Suliburska J. Zinc status is associated with inflammation, oxidative stress, lipid, and glucose metabolism. J Physiol Sci. 2018; 68:19–31.23. Jansen J, Rosenkranz E, Overbeck S, Warmuth S, Mocchegiani E, Giacconi R, et al. Disturbed zinc homeostasis in diabetic patients by in vitro and in vivo analysis of insulinomimetic activity of zinc. J Nutr Biochem. 2012; 23:1458–66.24. Kaiser N, Cerasi E, Leibowitz G. Diet-induced diabetes in the sand rat (Psammomys obesus). Methods Mol Biol. 2012; 933:89–102.25. Bibi H, Vinokur V, Waisman D, Elenberg Y, Landesberg A, Faingersh A, et al. Zn/Ga-DFO iron-chelating complex attenuates the inflammatory process in a mouse model of asthma. Redox Biol. 2014; 2:814–9.26. Anis Y, Leshem O, Reuveni H, Wexler I, Ben Sasson R, Yahalom B, et al. Antidiabetic effect of novel modulating peptides of G-protein-coupled kinase in experimental models of diabetes. Diabetologia. 2004; 47:1232–44.27. Brunt EM, Janney CG, Di Bisceglie AM, Neuschwander-Tetri BA, Bacon BR. Nonalcoholic steatohepatitis: a proposal for grading and staging the histological lesions. Am J Gastroenterol. 1999; 94:2467–74.28. Goebeler M, Gutwald J, Roth J, Sorg C. The severity of irritant contact dermatitis in various strains of mice correlates with endothelial expression of migration inhibitory factor (MIF). Arch Dermatol Res. 1991; 283:246–50.29. Ryan BJ, Van Pelt DW, Guth LM, Ludzki AC, Gioscia-Ryan RA, Ahn C, et al. Plasma ferritin concentration is positively associated with in vivo fatty acid mobilization and insulin resistance in obese women. Exp Physiol. 2018; 103:1443–7.30. Liu P, Gan W, Inuzuka H, Lazorchak AS, Gao D, Arojo O, et al. Sin1 phosphorylation impairs mTORC2 complex integrity and inhibits downstream Akt signalling to suppress tumorigenesis. Nat Cell Biol. 2013; 15:1340–50.31. Cui R, Choi SE, Kim TH, Lee HJ, Lee SJ, Kang Y, et al. Iron overload by transferrin receptor protein 1 regulation plays an important role in palmitate-induced insulin resistance in human skeletal muscle cells. FASEB J. 2019; 33:1771–86.32. Koenig G, Seneff S. Gamma-glutamyltransferase: a predictive biomarker of cellular antioxidant inadequacy and disease risk. Dis Markers. 2015; 2015:818570.33. Sun L, Qi Q, Zong G, Ye X, Li H, Liu X, et al. Elevated plasma retinol-binding protein 4 is associated with increased risk of type 2 diabetes in middle-aged and elderly Chinese adults. J Nutr. 2014; 144:722–8.34. Juanola-Falgarona M, Candido-Fernandez J, Salas-Salvado J, Martinez-Gonzalez MA, Estruch R, Fiol M, et al. Association between serum ferritin and osteocalcin as a potential mechanism explaining the iron-induced insulin resistance. PLoS One. 2013; 8:e76433.35. Wieser V, Moschen AR, Tilg H. Inflammation, cytokines and insulin resistance: a clinical perspective. Arch Immunol Ther Exp (Warsz). 2013; 61:119–25.36. Ruz M, Carrasco F, Rojas P, Codoceo J, Inostroza J, Basfi-fer K, et al. Zinc as a potential coadjuvant in therapy for type 2 diabetes. Food Nutr Bull. 2013; 34:215–21.37. Prasad AS. Zinc is an antioxidant and anti-inflammatory agent: its role in human health. Front Nutr. 2014; 1:14.38. Luo YY, Zhao J, Han XY, Zhou XH, Wu J, Ji LN. Relationship between serum zinc level and microvascular complications in patients with type 2 diabetes. Chin Med J (Engl). 2015; 128:3276–82.39. Chieppa M, Galleggiante V, Serino G, Massaro M, Santino A. Iron chelators dictate immune cells inflammatory ability: potential adjuvant therapy for IBD. Curr Pharm Des. 2017; 23:2289–98.40. Vinokur V, Berenshtein E, Chevion MM, Eliashar R. Iron homeostasis and methionine-centred redox cycle in nasal polyposis. Free Radic Res. 2011; 45:366–73.41. Phillipson OT. Management of the aging risk factor for Parkinson’s disease. Neurobiol Aging. 2014; 35:847–57.42. Martins AC, Almeida JI, Lima IS, Kapitao AS, Gozzelino R. Iron metabolism and the inflammatory response. IUBMB Life. 2017; 69:442–50.43. Wong CP, Rinaldi NA, Ho E. Zinc deficiency enhanced inflammatory response by increasing immune cell activation and inducing IL6 promoter demethylation. Mol Nutr Food Res. 2015; 59:991–9.44. Li HT, Jiao M, Chen J, Liang Y. Roles of zinc and copper in modulating the oxidative refolding of bovine copper, zinc superoxide dismutase. Acta Biochim Biophys Sin (Shanghai). 2010; 42:183–94.45. Banin E, Berenshtein E, Kitrossky N, Pe’er J, Chevion M. Gallium-desferrioxamine protects the cat retina against injury after ischemia and reperfusion. Free Radic Biol Med. 2000; 28:315–23.
- Full Text Links
-
- Actions
-
Cited
- CITED
-
- Close
- Share
-
- Similar articles
-
- A New Concept in Antidiabetic Therapeutics: A Concerted Removal of Labile Iron and Intracellular Deposition of Zinc
- Concentrations of lead, iron and zinc in blood of coal workers' pneumoconiosis patients
- HDL cholesterol, copper, ceruloplasmin, zinc, iron values of the blood in newborn
- Therapeutic Iron and Zinc Supplementation in Children
- A Study on the Balance of Iron and Zinc in Korean Children
