Measuring Glutathione Regeneration Capacity in Stem Cells
- Affiliations
-
- 1Department of Pharmacy, College of Pharmacy, Jeju Research Institute of Pharmaceutical Sciences, Jeju National University, Jeju, Korea
- 2Interdisciplinary Graduate Program in Advanced Convergence Technology and Science, Bio-Health Materials Core-Facility Center and Practical Translational Research Center, Jeju National University, Jeju, Korea
- KMID: 2545234
- DOI: http://doi.org/10.15283/ijsc23047
Abstract
- Glutathione (GSH) is a chief cellular antioxidant, affecting stem cell functions. The cellular GSH level is dynamically altered by the redox buffering system and transcription factors, including NRF2. Additionally, GSH is differentially regulated in each organelle. We previously reported a protocol for monitoring the real-time GSH levels in live stem cells using the reversible GSH sensor FreSHtracer. However, GSH-based stem cell analysis needs be comprehensive and organelle-specific. Hence, in this study, we demonstrate a detailed protocol to measure the GSH regeneration capacity (GRC) in living stem cells by measuring the intensities of the FreSHtracer and the mitochondrial GSH sensor MitoFreSHtracer using a high-content screening confocal microscope. This protocol typically analyses the GRC in approximately 4 h following the seeding of the cells onto plates. This protocol is simple and quantitative. With some minor modifications, it can be employed flexibly to measure the GRC for the whole-cell area or just the mitochondria in all adherent mammalian stem cells.
Figure
-
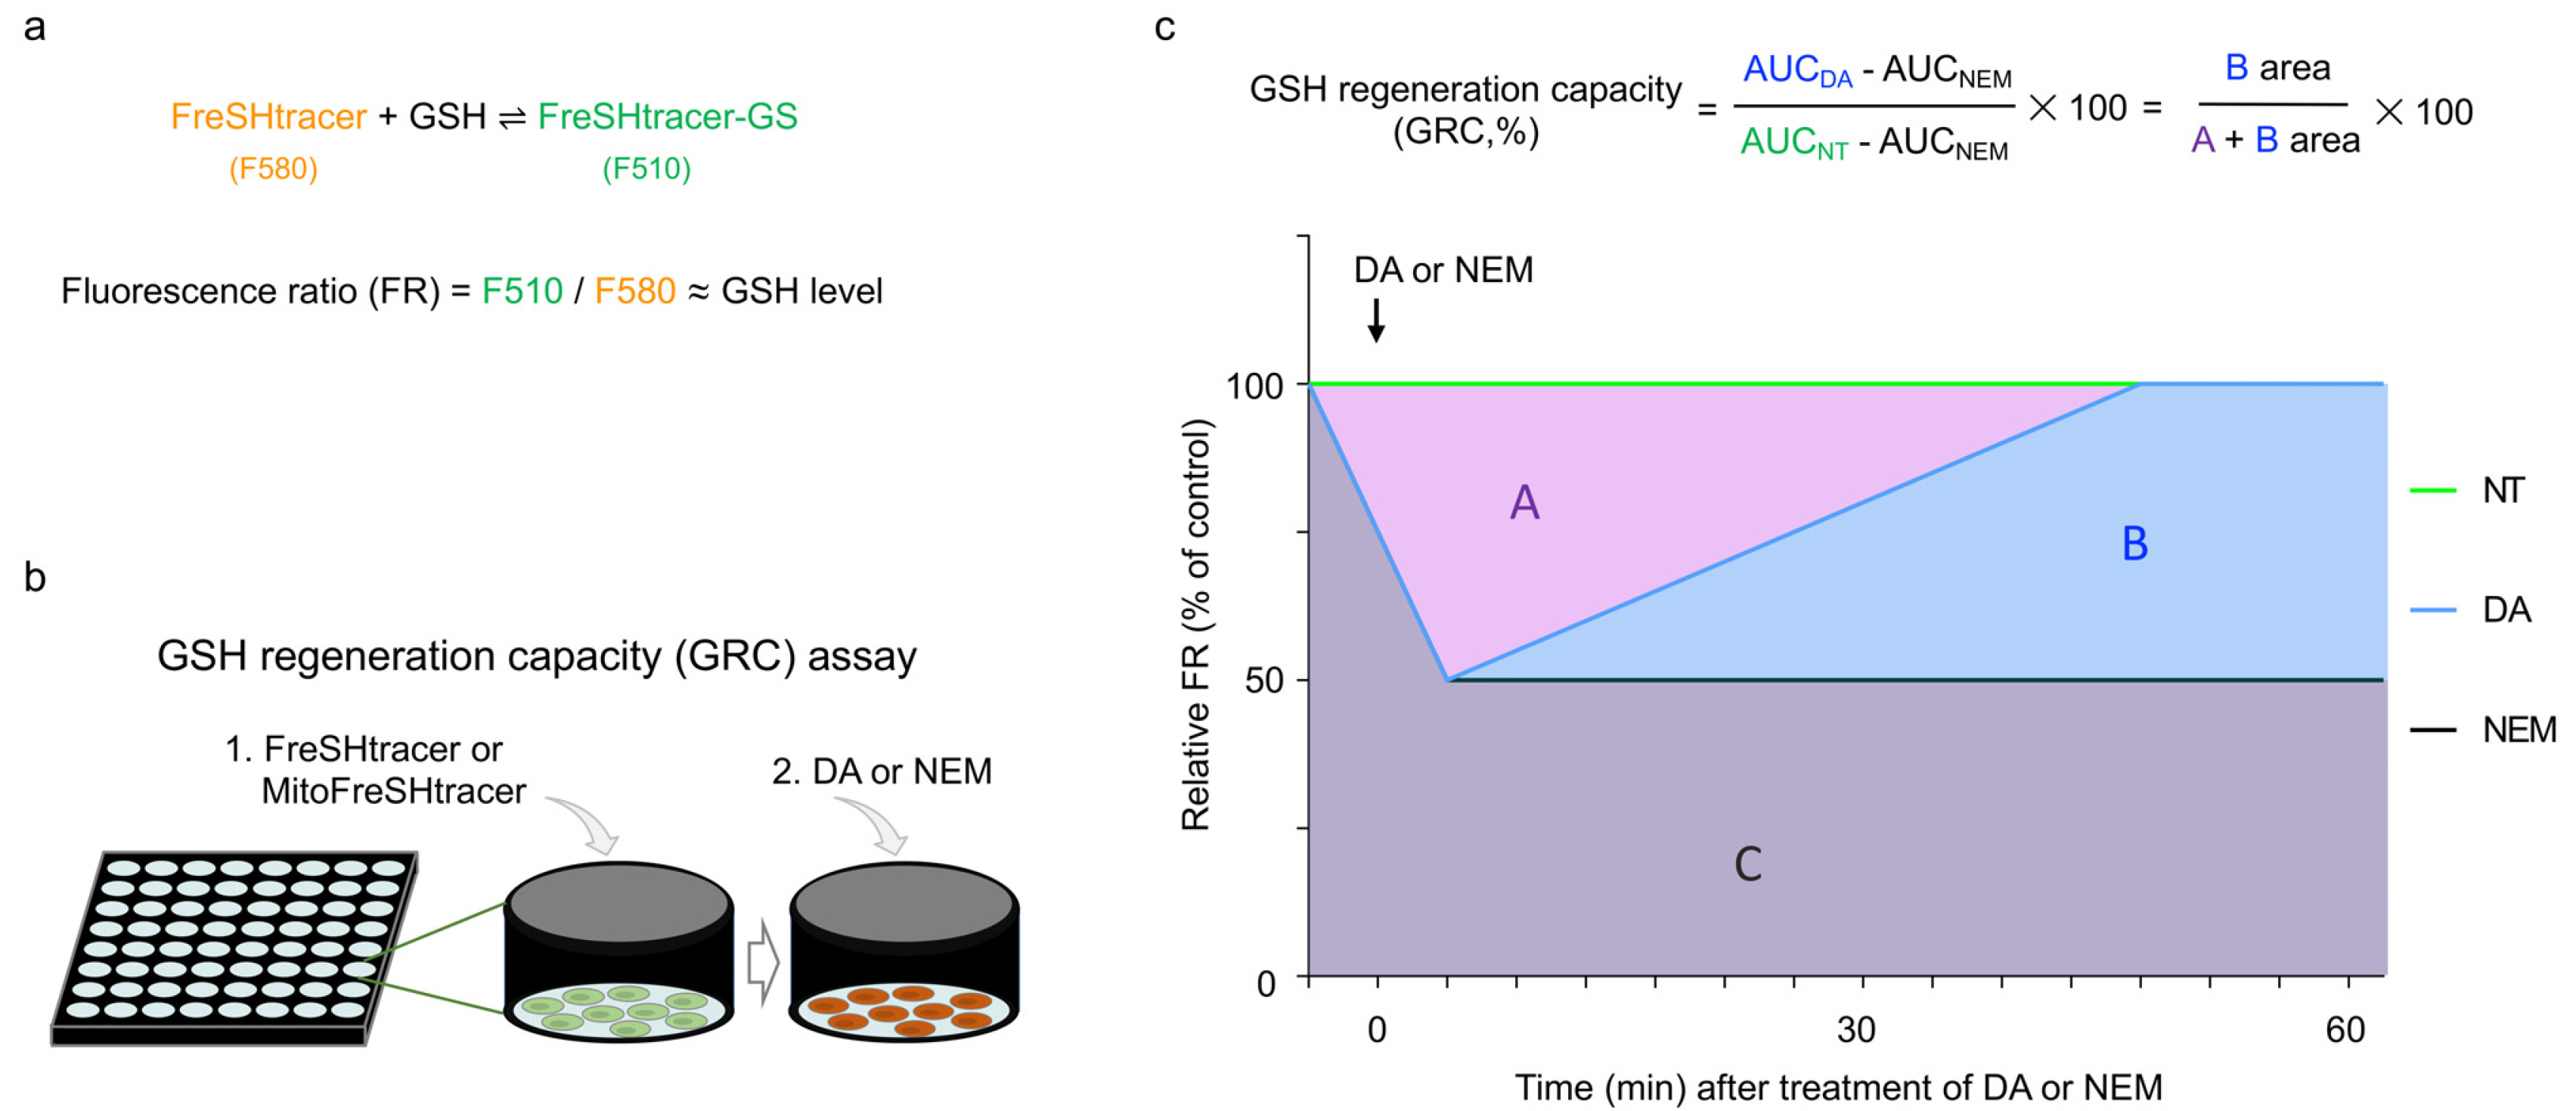
Fig. 1 FreSHtracer-based glutathione regeneration capacity (GRC) assay. (a) A reaction equation for FreSHtracer and glutathione (GSH). F510 (Ex430-510), GSH unbound signal; F580 (Ex520-Em580), GSH bound signal. Fluorescence ratio of FreSHtracer (FR, F510/F580) is proportional to GSH level. (b) Experimental overview for quantifying GRC using FreSHtracer or MitoFreSHtracer. Cells loaded with FreSHtracer or MitoFreSHtracer are observed after treatment with diamide (DA) or N-ethylmaleimide (NEM). (c) GRC was quantified on the basis of the area under the curves (AUC) after non-treatment (A+B+C area), treatment of DA (for GRC, B+C area) and NEM (for the basal thiol level in cells, C area). The ratio of B area and A plus B area is assumed to be GRC.
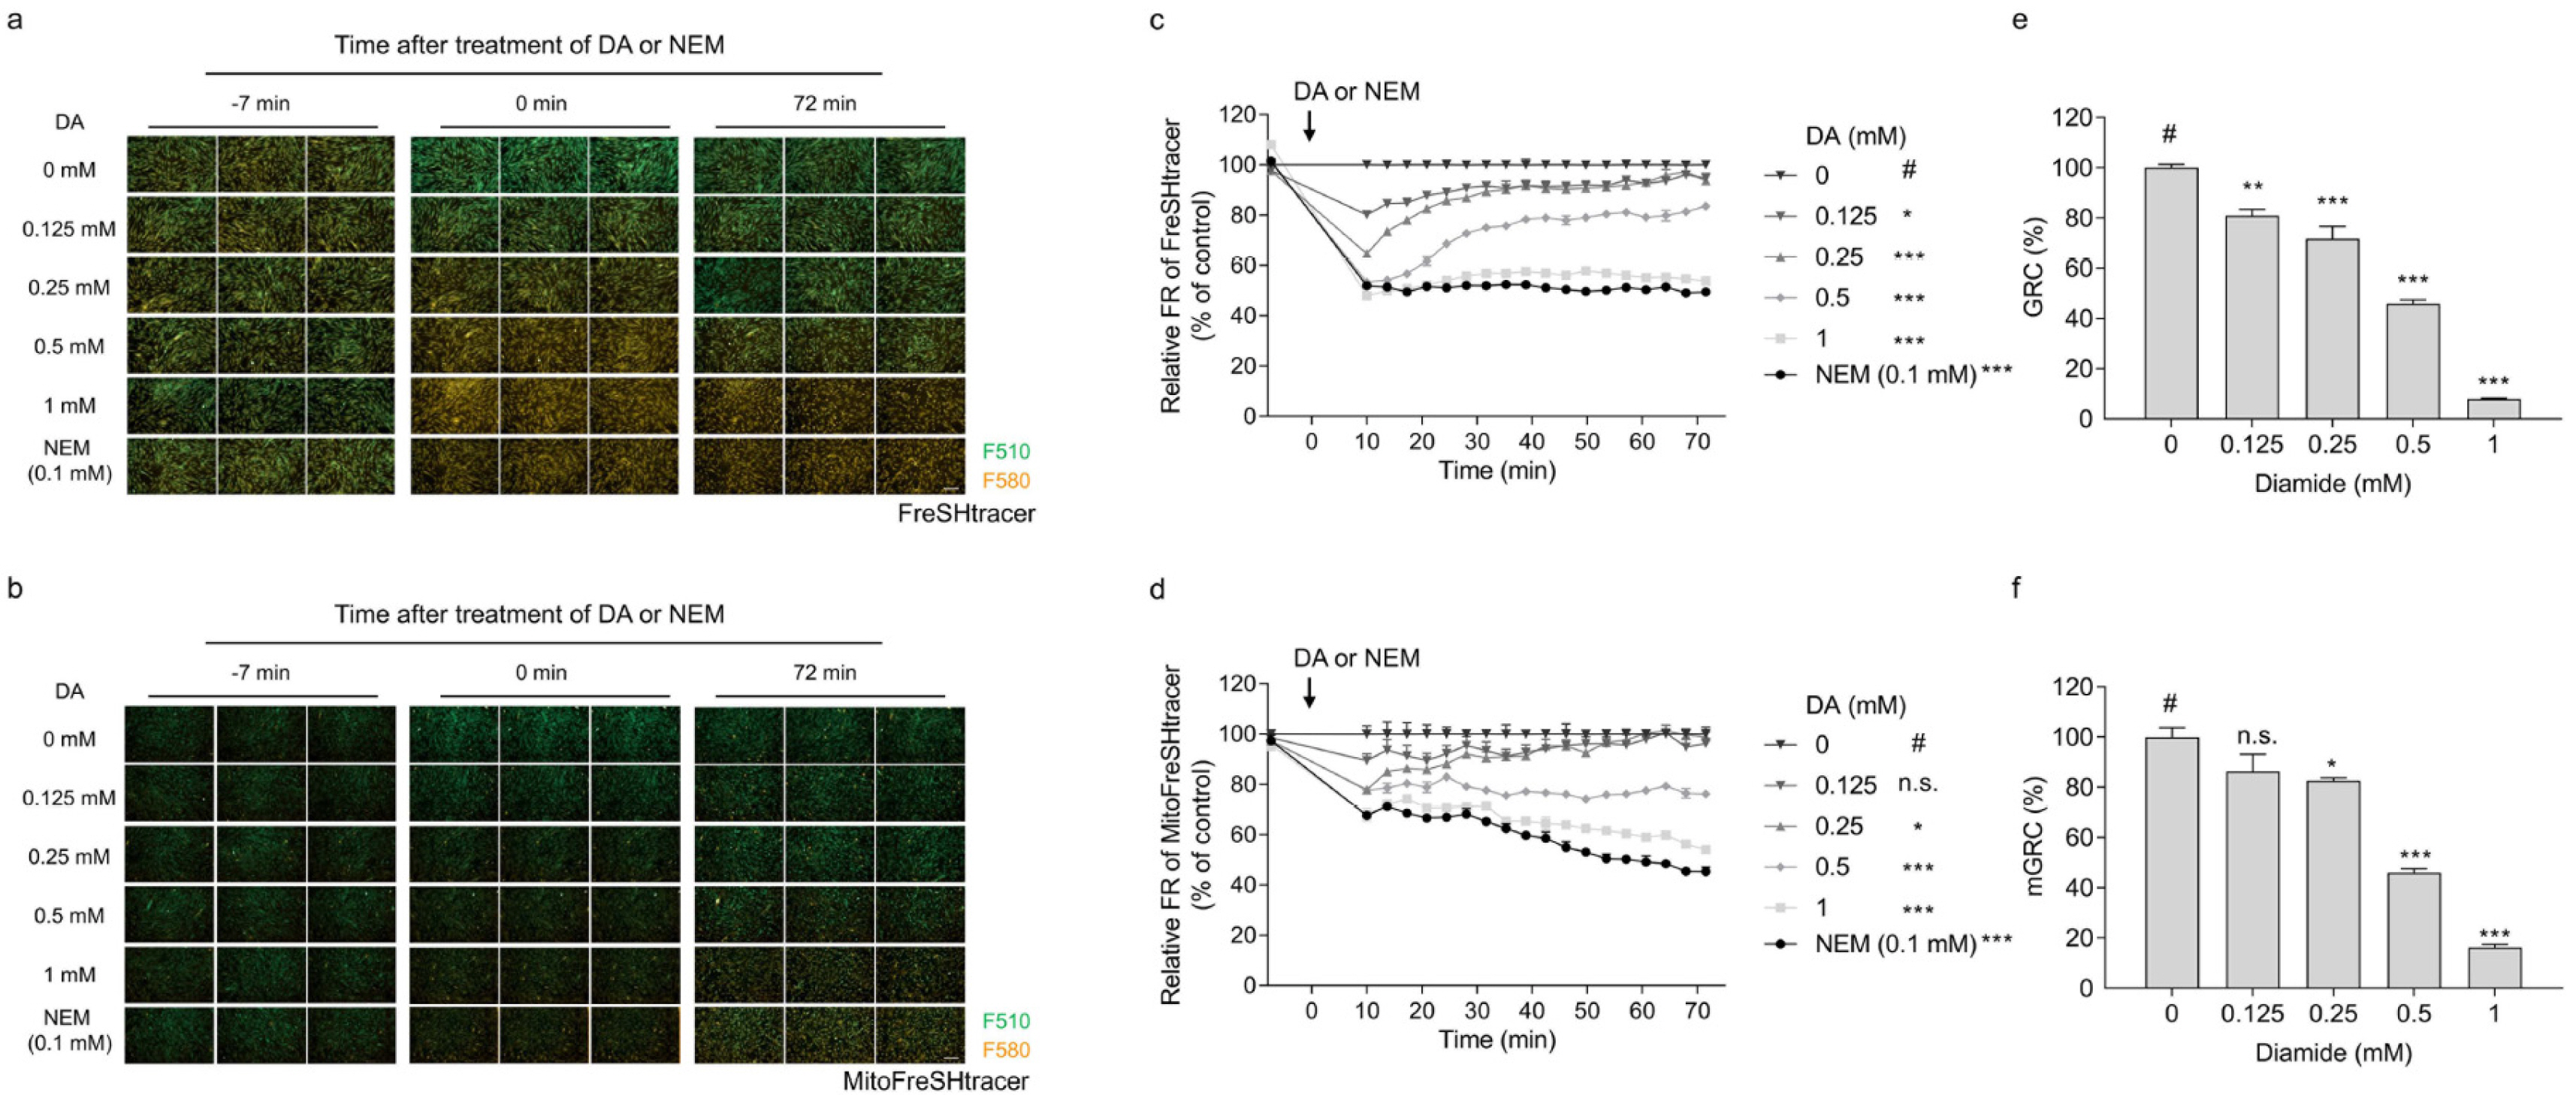
Fig. 2 GRC assay for hUC-MSC using FreSHtracer and MitoFreSHtracer. (a∼c) FreSHtracer- or (d∼f) MitoFreSHtracer-loaded hUC-MSCs were treated with 0, 0.125, 0.25, 0.5, and 1 mM of diamide (DA) or 0.1 mM N-ethylmaleimide (NEM), and analyzed using fluorescence confocal microscopy. (a, b) Representative images of confocal microscopy are shown with ×100 magnification. Scale bars=100 μm. (c, d) Kinetics of the FR levels (F510/F580 ratio) were plotted over time. (e, f) The GRC levels were calculated. Error bars represent means±SEM. n.s.: not significant, #: control group. *p<0.05, **p<0.01, ***p<0.001.

Fig. 3 Analysis of means and heterogeneity of GSH levels in the whole-cellular and mitochondria of hBM-MSCs. (a∼c) hBM-MSCs from different passages P4 and P9 were stained with FreSHtracer or MitoFreSHtracer and analyzed using flow cytometry. Flow cytometric analysis of the FR levels (F510/F580 ratio) from FreSHtracer (left) andMitoFreSHtracer (right) in P4 and P9 hBM-MSCs (a). The mean (b) and robust coefficient of variation (rCV, c) values plotted based on the FR levels. cCV is assumed as heterogeneity of the FR levels. Error bars represent means±SEM. *p<0.05, **p<0.01, ***p<0.001.
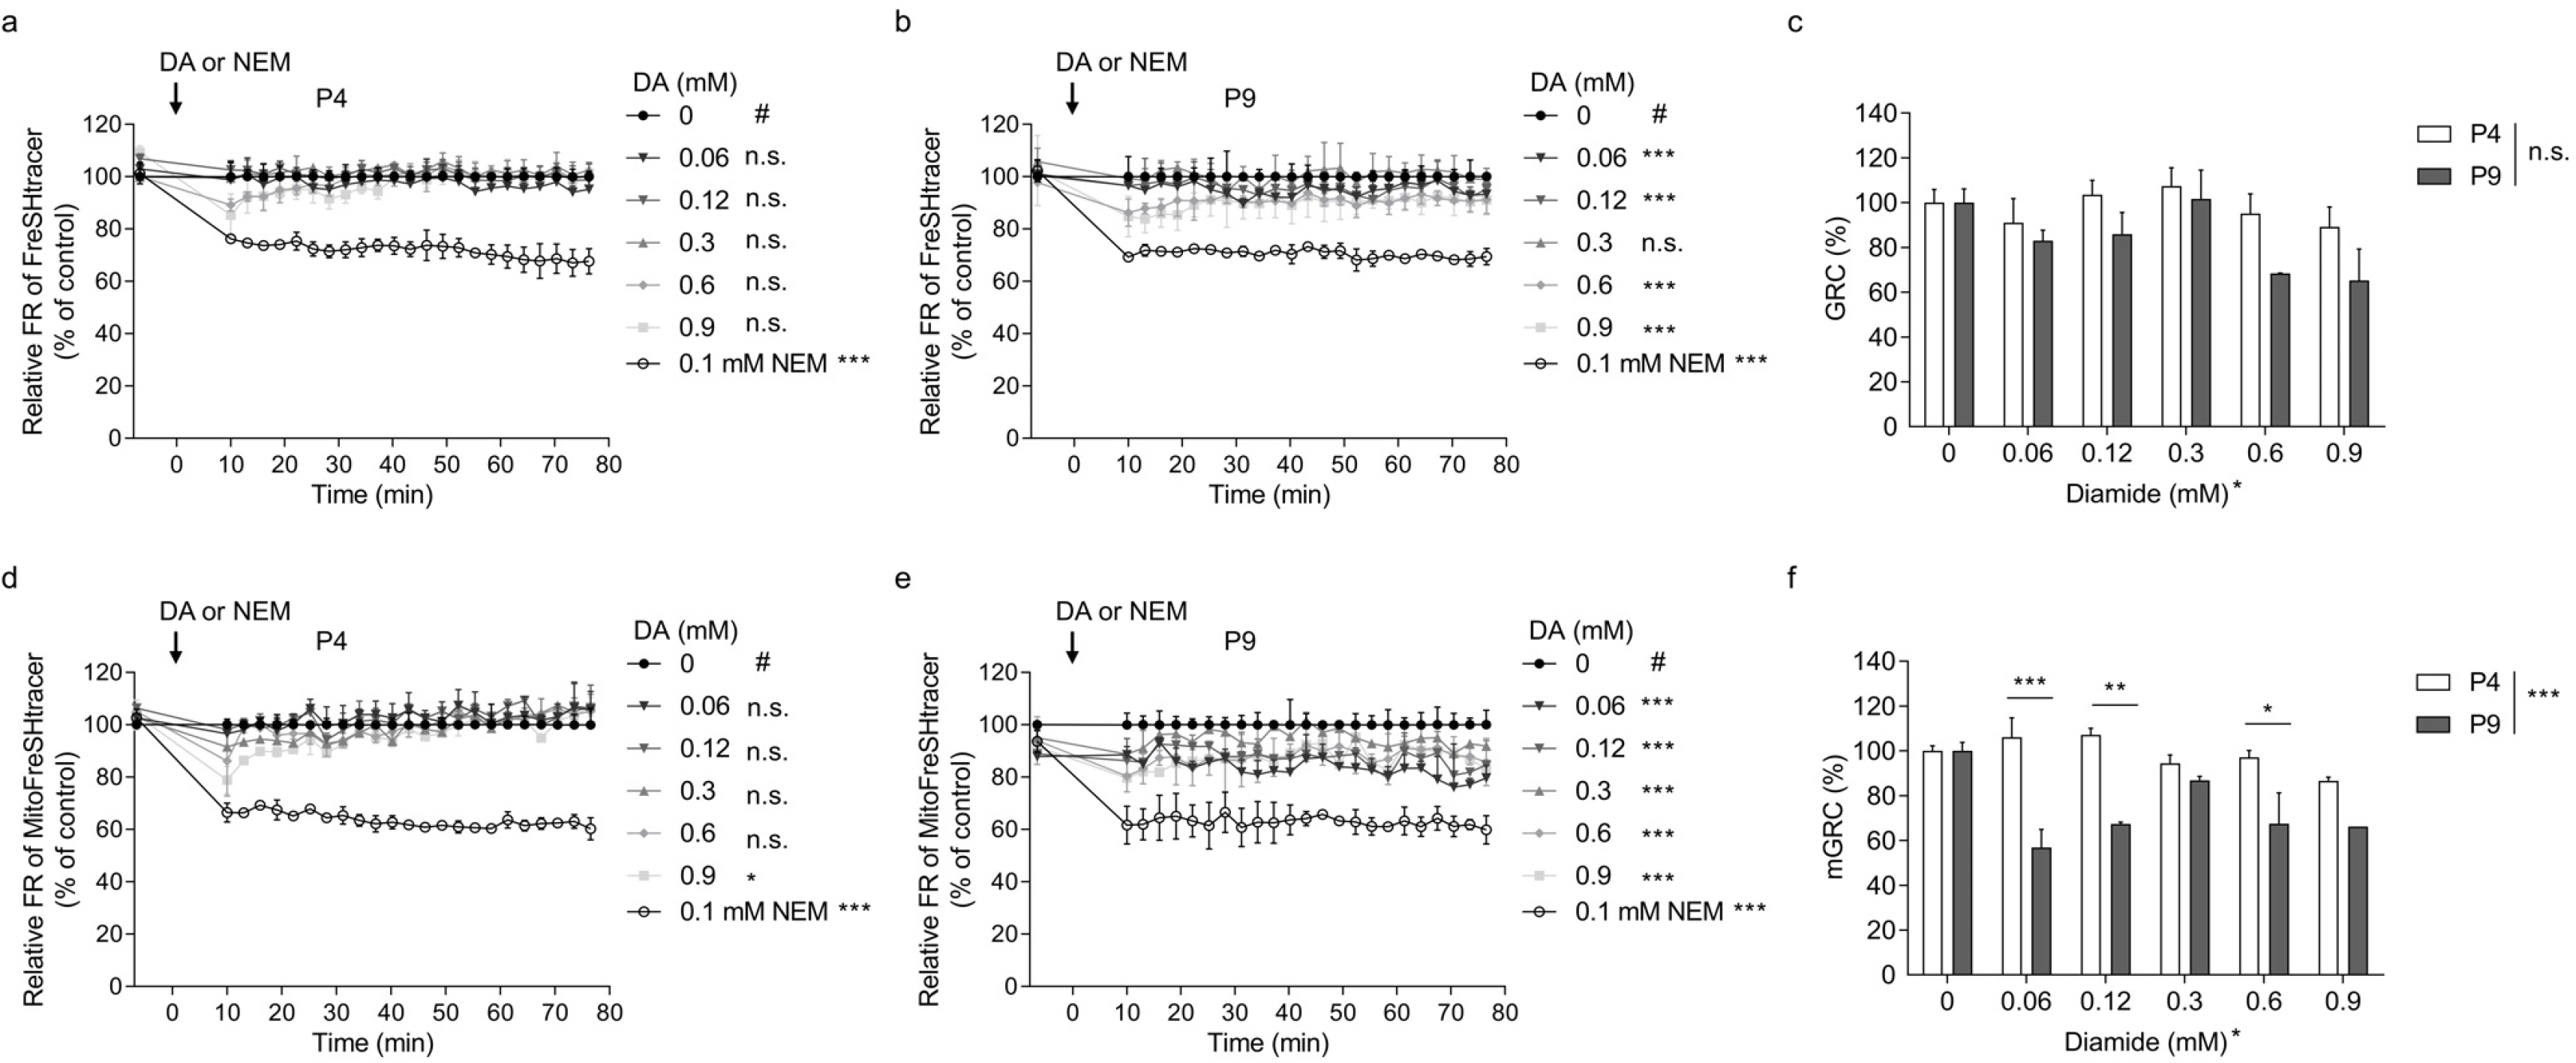
Fig. 4 Comparing the GRC data of hBM-MSCs with different passages. hBM-MSCs passaged to P4 and P9 were loaded with (a∼c) FreSHtracer or (d∼f) MitoFreSHtracer, treated with 0, 0.06, 0.12, 0.3, 0.6, and 0.9 mM of diamide (DA) or 0.1 mM N-ethylmaleimide (NEM), and were analyzed using fluorescence confocal microscopy. The FR (F510/F580 ratio) levels were plotted over time in (a, d) P4 and (d, e) P9 hBM-MSCs, respectively. The GRC and mGRC levels of both cells loaded (c) FreSHtracer and (f) MitoFreSHtracer, respectively were calculated based on the FR kinetics. Error bars represent means±SEM. #: control group. *p<0.05, **p<0.001, ***p<0.001.
Reference
-
References
1. Lu SC. 2013; Glutathione synthesis. Biochim Biophys Acta. 1830:3143–3153. DOI: 10.1016/j.bbagen.2012.09.008. PMID: 22995213. PMCID: PMC3549305.
Article2. Winterbourn CC, Hampton MB. 2008; Thiol chemistry and specificity in redox signaling. Free Radic Biol Med. 45:549–561. DOI: 10.1016/j.freeradbiomed.2008.05.004. PMID: 18544350.
Article3. Jeong EM, Yoon JH, Lim J, Shin JW, Cho AY, Heo J, Lee KB, Lee JH, Lee WJ, Kim HJ, Son YH, Lee SJ, Cho SY, Shin DM, Choi K, Kim IG. 2018; Real-time monitoring of glutathione in living cells reveals that high glutathione levels are required to maintain stem cell function. Stem Cell Reports. 10:600–614. DOI: 10.1016/j.stemcr.2017.12.007. PMID: 29307581. PMCID: PMC5830891.
Article4. Lim J, Heo J, Ju H, Shin JW, Kim Y, Lee S, Yu HY, Ryu CM, Yun H, Song S, Hong KS, Chung HM, Kim HR, Roe JS, Choi K, Kim IG, Jeong EM, Shin DM. 2020; Glutathione dynamics determine the therapeutic efficacy of mesenchymal stem cells for graft-versus-host disease via CREB1-NRF2 pathway. Sci Adv. 6:eaba1334. DOI: 10.1126/sciadv.aba1334. PMID: 32490200. PMCID: PMC7239701.
Article5. Lim J, Heo J, Yu HY, Yun H, Lee S, Ju H, Nam YJ, Jeong SM, Lee J, Cho YS, Choo MS, Jeong EM, Ryu CM, Shin DM. 2021; Small-sized mesenchymal stem cells with high glutathione dynamics show improved therapeutic potency in graft-versus-host disease. Clin Transl Med. 11:e476. DOI: 10.1002/ctm2.476.
Article6. Ribas V, García-Ruiz C, Fernández-Checa JC. 2014; Glutathione and mitochondria. Front Pharmacol. 5:151. DOI: 10.3389/fphar.2014.00151. PMID: 25024695. PMCID: PMC4079069.
Article7. Marí M, Morales A, Colell A, García-Ruiz C, Kaplowitz N, Fernández-Checa JC. 2013; Mitochondrial glutathione: features, regulation and role in disease. Biochim Biophys Acta. 1830:3317–3328. DOI: 10.1016/j.bbagen.2012.10.018. PMID: 23123815. PMCID: PMC3578987.
Article8. Cho AY, Choi K. 2012; A coumarin-based fluorescence sensor for the reversible detection of thiols. Chem Lett. 41:1611–1612. DOI: 10.1246/cl.2012.1611.
Article9. Jeong EM, Shin JW, Lim J, Kim JH, Kang H, Yin Y, Kim HM, Kim Y, Kim SG, Kang HS, Shin DM, Choi K, Kim IG. 2019; Monitoring glutathione dynamics and heterogeneity in living stem cells. Int J Stem Cells. 12:367–379. DOI: 10.15283/ijsc18151. PMID: 30836726. PMCID: PMC6657947.
Article10. Porcelli AM, Ghelli A, Zanna C, Pinton P, Rizzuto R, Rugolo M. 2005; pH difference across the outer mitochondrial membrane measured with a green fluorescent protein mutant. Biochem Biophys Res Commun. 326:799–804. DOI: 10.1016/j.bbrc.2004.11.105. PMID: 15607740.
Article
