Comprehensive Molecular Characterization of Soft Tissue Sarcoma for Prediction of Pazopanib-Based Treatment Response
- Affiliations
-
- 1Division of Hematology-Oncology, Department of Medicine, Samsung Medical Center, Sungkyunkwan University School of Medicine, Seoul, Korea
- 2Department of Biomedical Convergence Science and Technology, Kyungpook National University, Daegu, Korea
- 3Cell and Matrix Research Institute, Kyungpook National University, Daegu, Korea
- 4Division of Medical Oncology, Department of Internal Medicine, Yonsei University College of Medicine, Seoul, Korea
- 5Department of Radiology, Yonsei University College of Medicine, Seoul, Korea
- 6Department of Orthopedic Surgery, Yonsei University College of Medicine, Seoul, Korea
- 7Institute for Human Tissue Restoration, Department of Plastic & Reconstructive Surgery, Severance Hospital, Yonsei University College of Medicine, Seoul, Korea
- 8Department of Pathology, Yonsei University College of Medicine, Seoul, Korea
- 9Department of Pathology and Translational Genomics, Samsung Medical Center, Sungkyunkwan University School of Medicine, Seoul, Korea
- 10Department of Hematology-Oncology, Ajou University School of Medicine, Suwon, Korea
- KMID: 2541254
- DOI: http://doi.org/10.4143/crt.2022.251
Abstract
- Purpose
Even though pazopanib, a multitargeted tyrosine kinase inhibitor, has been approved for refractory soft tissue sarcoma (STS), little is known about the molecular determinants of the response to pazopanib. We performed integrative molecular characterization to identify potential predictors of pazopanib efficacy.
Materials and Methods
We obtained fresh pre-treatment tumor tissue from 35 patients with advanced STS receiving pazopanib-based treatment. Among those, 18 (51.4%) received pazopanib monotherapy, and the remaining 17 (48.6%) received pazopanib in combination with durvalumab, programmed death-ligand 1 blockade. Whole-exome and transcriptome sequencing were performed for each tumor and patient germline DNA.
Results
Of the 35 patients receiving pazopanib-based treatment, nine achieved a partial response (PR), resulting in an objective response rate (ORR) of 27.3%, and the median progression-free survival (PFS) was 6.0 months. Patients with CDK4 amplification (copy ratio tumor to normal > 2) exhibited shorter PFS (3.7 vs. 7.9 months, p=2.09×10⁻⁴) and a poorer response (ORR; 0% vs. 33.3%) compared to those without a gene amplification (copy ratio ≤ 2). Moreover, non-responders demonstrated transcriptional activation of CDK4 via DNA amplification, resulting in cell cycle activation. In the durvalumab combination cohort, seven of the 17 patients (41.2%) achieved a PR, and gene expression analysis revealed that durvalumab responders exhibited high immune/stromal cell infiltration, mainly comprising natural killer cells, compared to non-responders as well as increased expression of CD19, a B-cell marker.
Conclusion
Despite the limitation of heterogeneity in the study population and treatment, we identified possible molecular predictors of pazopanib efficacy that can be employed in future clinical trials aimed at evaluating therapeutic strategies.
Keyword
Figure
-
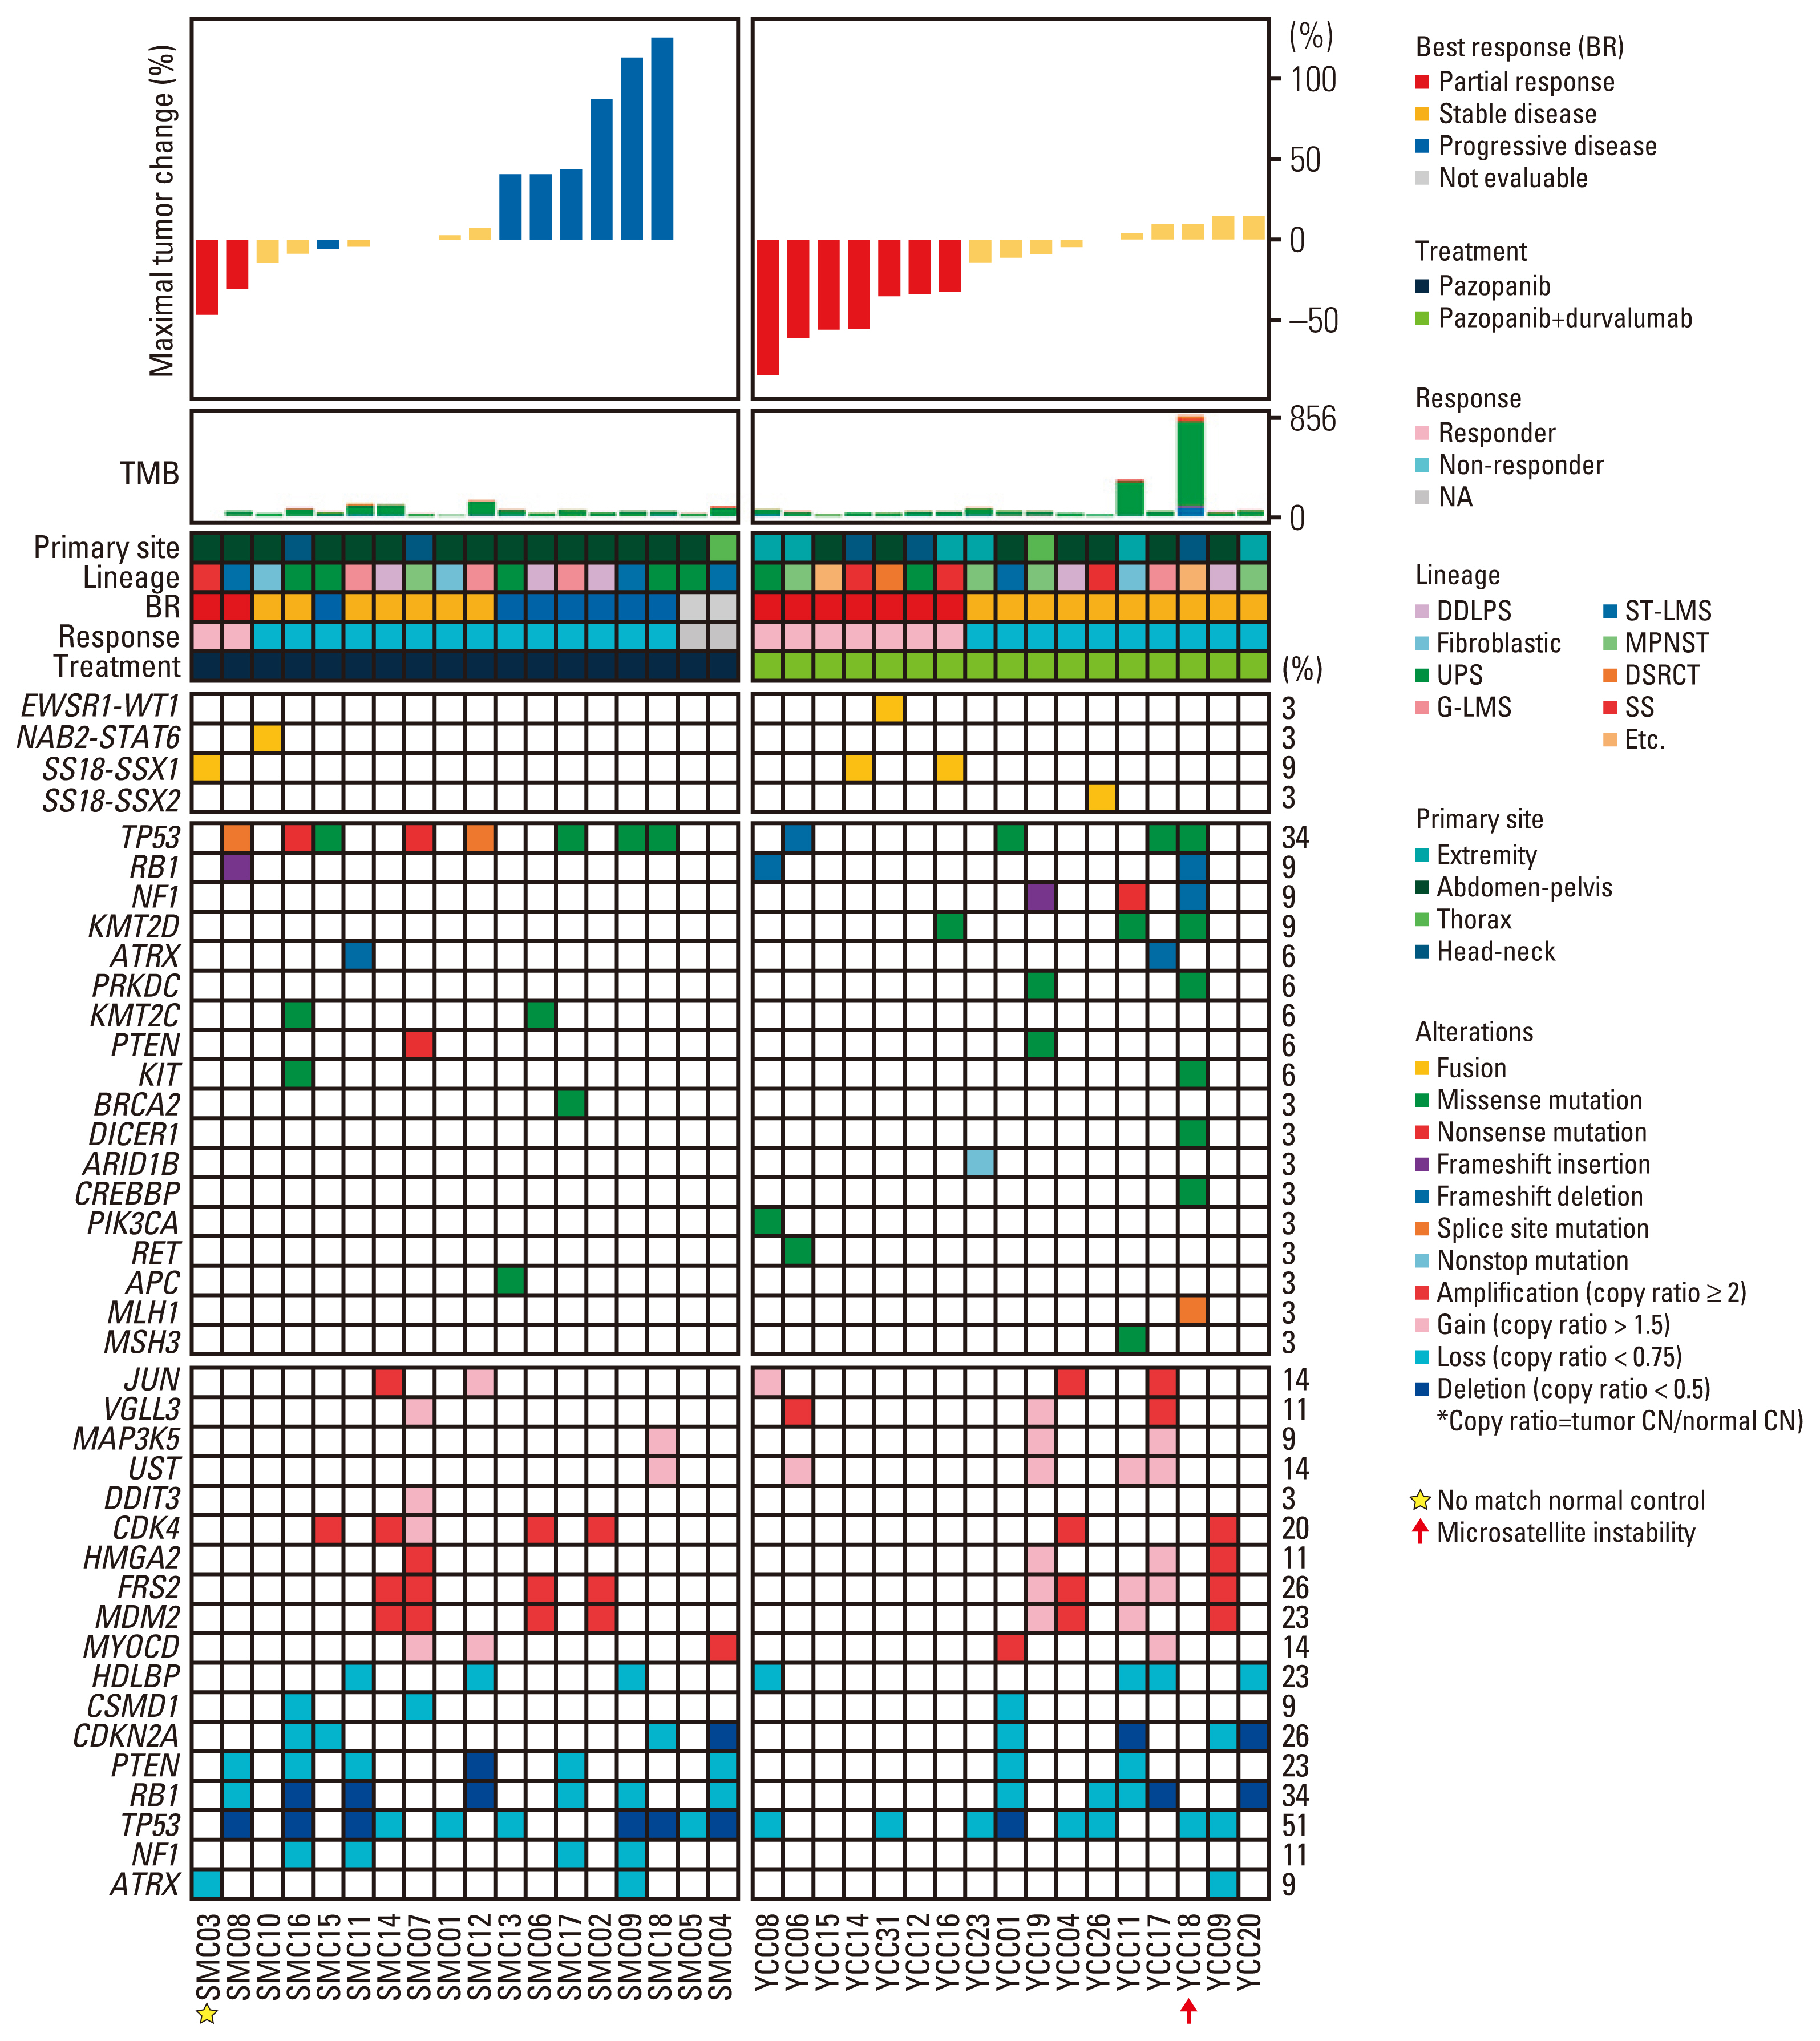
Fig. 1 Molecular landscape and response to pazopanib-based treatment. Integrated plot of clinical and molecular features. From top to bottom, panels indicate: Waterfall plot represents percentage of maximum tumor reduction as assessed according to Response Evaluation Criteria in Solid Tumor 1.1 criteria; the number of mutations; clinical characteristics including primary site, histological subtype, best response, treatment (pazopanib vs. pazopanib and durvalumab combination), and percentage of alterations (fusions, mutations, and somatic copy number alterations). Patient identity number is provided in S2 Table. CN, copy number; DDLPS, dedifferentiated liposarcoma; DSRCT, desmoplastic small round cell tumor; G-LMS, gynecological leiomyosarcomas; MPNST, malignant peripheral nerve sheath tumors; NA, not available; SS, synovial sarcoma; ST-LMS, soft tissue leiomyosarcomas; TMB, tumor mutation burden; UPS, undifferentiated pleomorphic sarcoma.
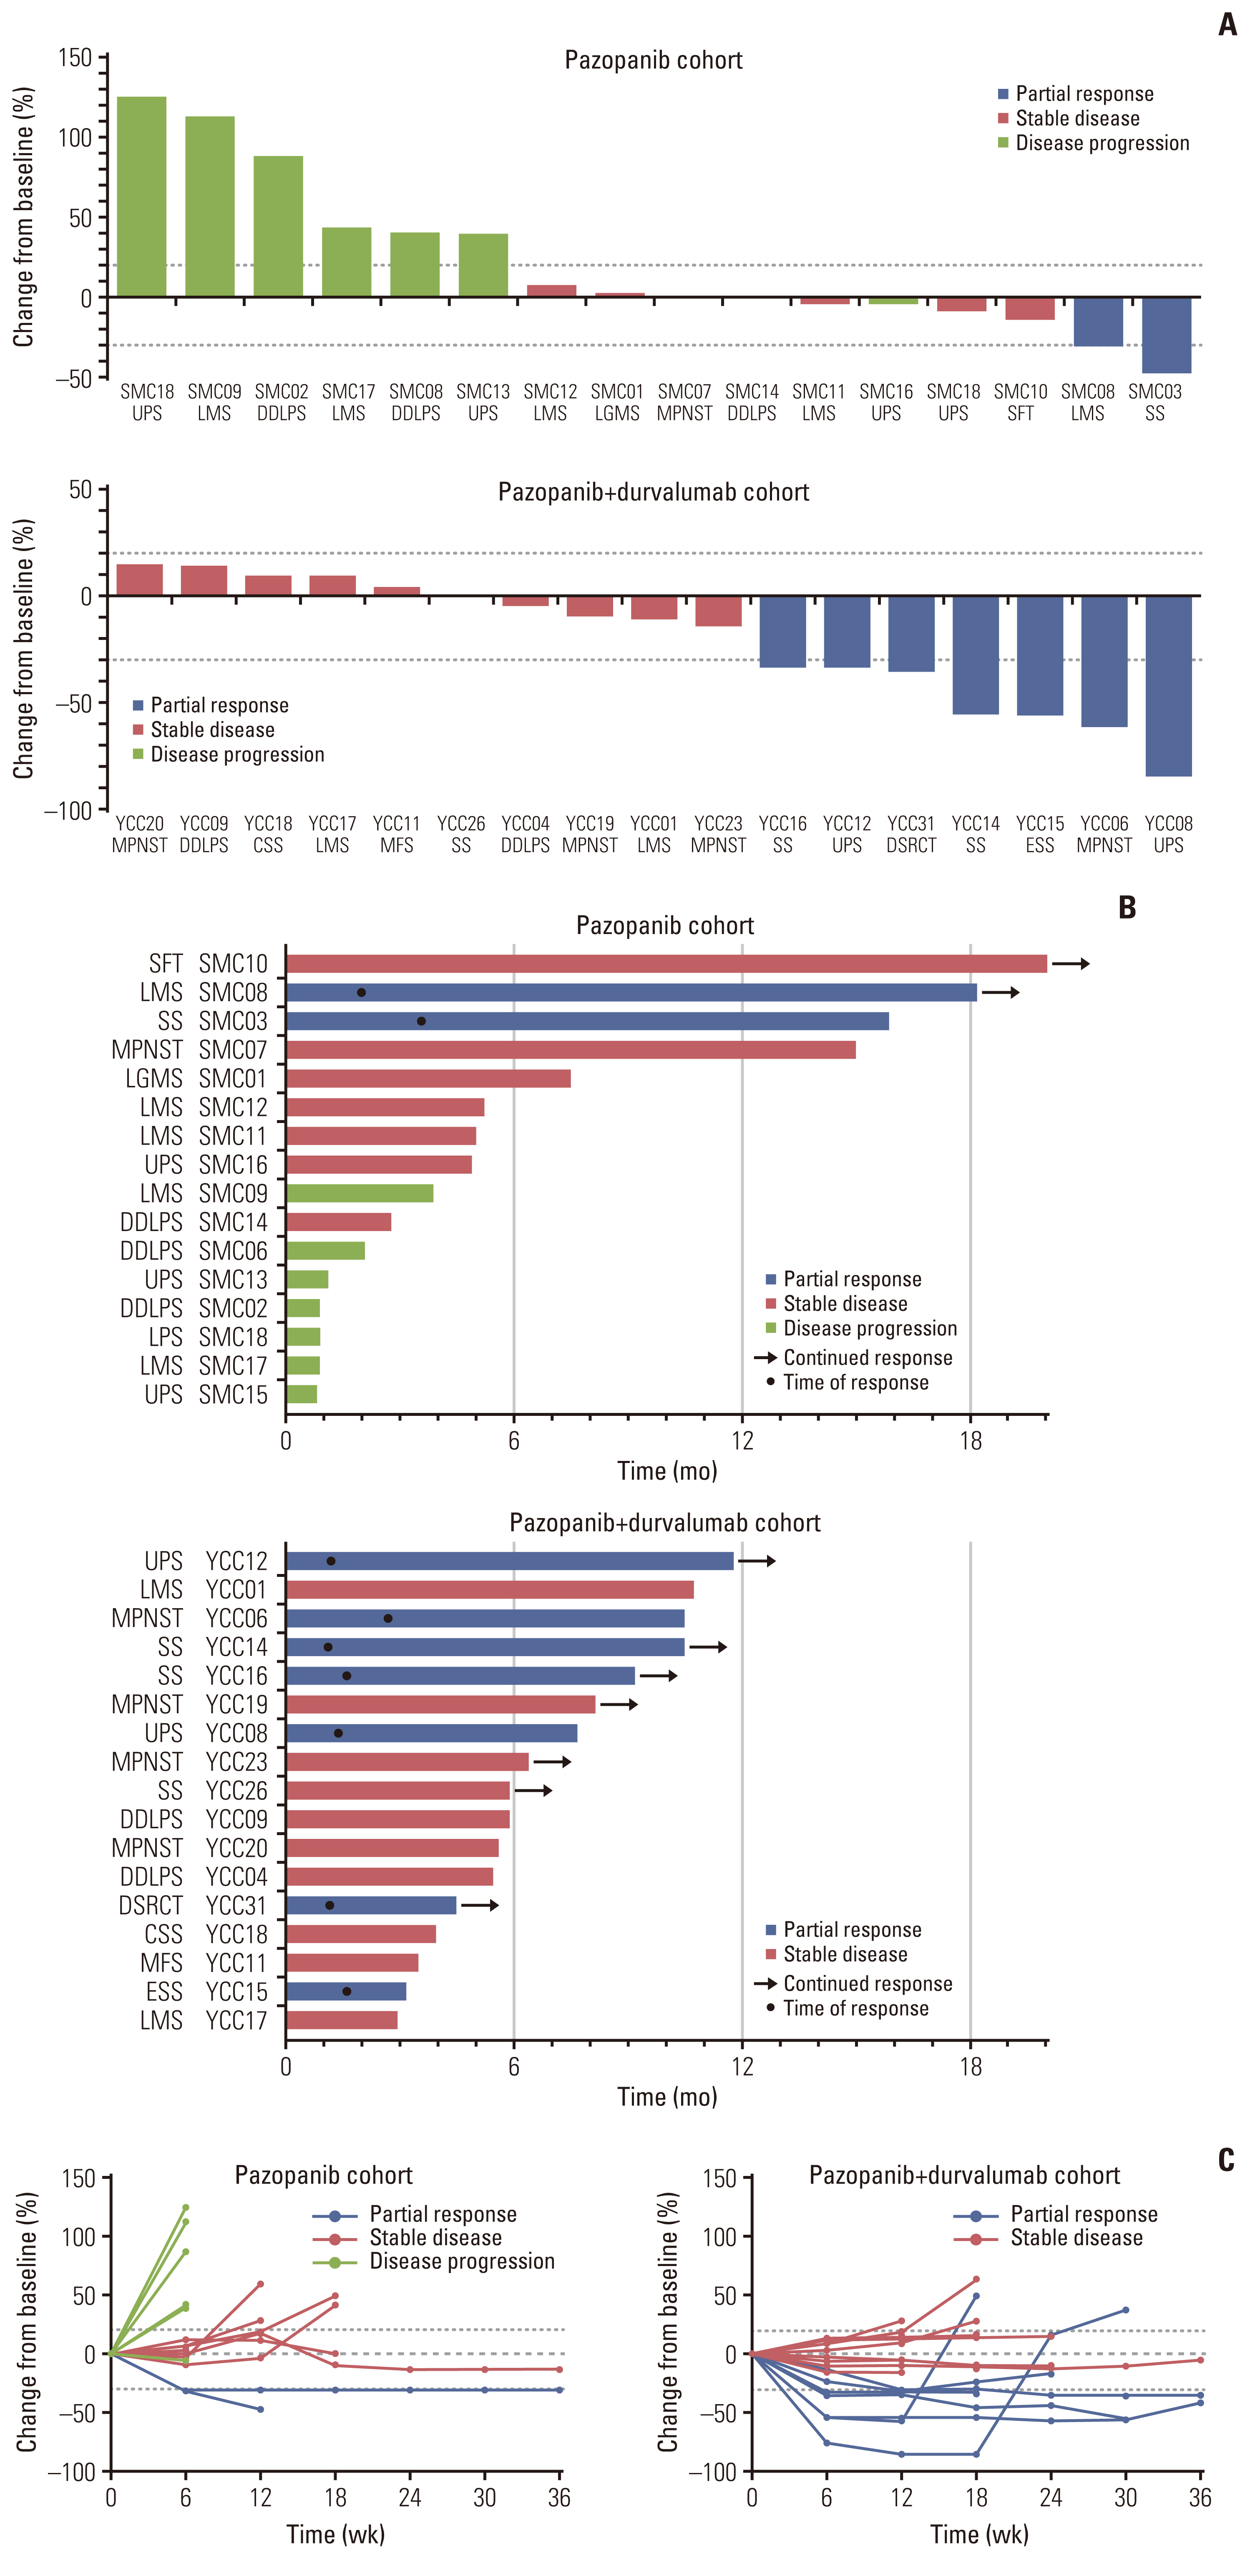
Fig. 2 Response to pazopanib or pazopanib and durvalumab combination. (A) Waterfall plot represents percentage of maximum tumor reduction after treatment, as assessed according to Response Evaluation Criteria in Solid Tumor 1.1 criteria. (B) Swimmer plot. Each lane represents a single patient’s data. X-axis represents the duration of treatment for each patient. (C) Spider plots of the percentage change in the sum of target lesions by subject. CSS, clear cell sarcoma; DDLPS, dedifferentiated liposarcoma; DSRCT, desmoplastic small round cell tumor; ESS, endometrial stromal cell sarcoma; LMS, leiomyosarcomas; MFS, myxofibrosarcoma; MPNST, malignant peripheral nerve sheath tumors; SFT, solitary fibrous tumor; SS, synovial sarcoma; UPS, undifferentiated pleomorphic sarcoma.
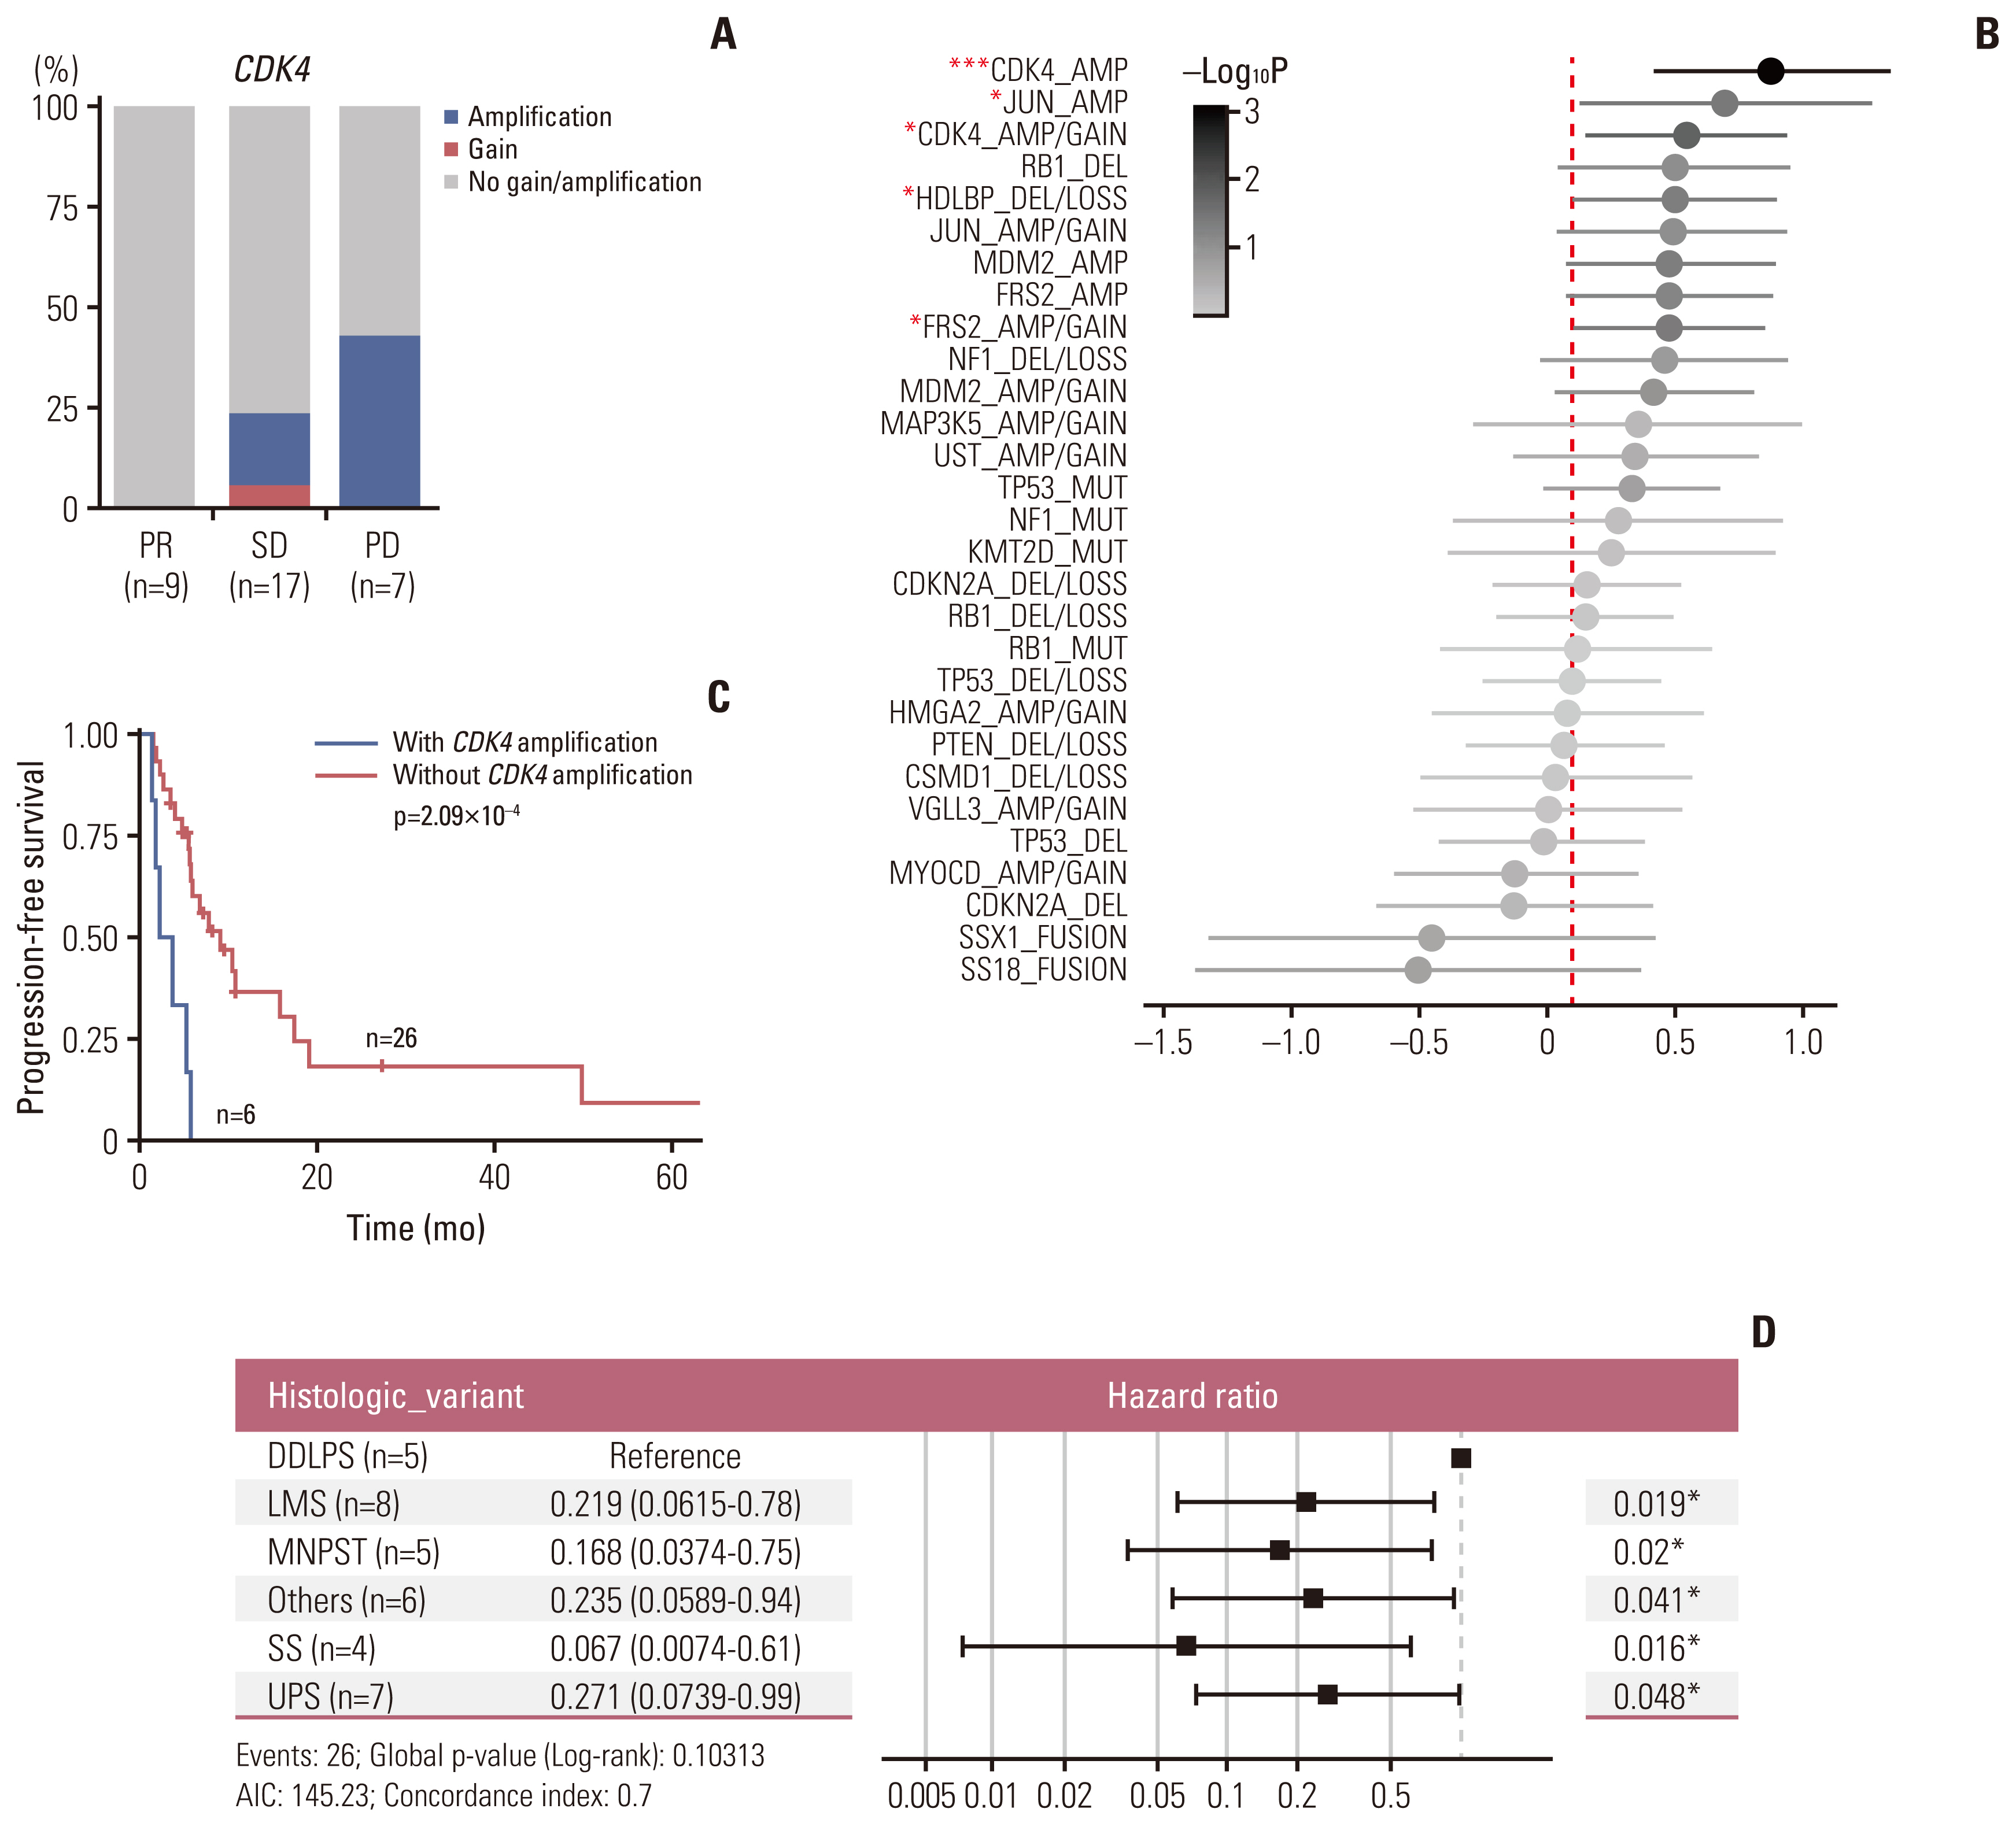
Fig. 3 CDK4, FRS2, and HDLBP copy number alterations are genomic determinants of pazopanib resistance. (A) Prevalence of tumors harboring CDK4 gains (red) and amplifications (bule) in responders and non-responders. PD, progressive disease; PR, partial response; SD, stable disease. (B) Univariate Cox regression analysis with genetic variables. Error bars represent the 95% confidence interval. X-axis indicates log10-transformed hazard ratio. AMP, amplification/gain; DEL, deletion/loss. *p < 0.05, ***p < 0.001. (C) Kaplan-Meier curve of progression-free survival (months) based on CDK4 amplification. (D) Univariate Cox regression analysis among histologic variants. Error bars represent the 95% confidence intervals. X-axis indicates hazard ratio (log10-scaled). AIC, Akaike information criterion; DDLPS, dedifferentiated liposarcoma; LMS, leiomyosarcomas; MPNST, malignant peripheral nerve sheath tumors; Others, other sarcoma subtypes; SS, synovial sarcoma; UPS, undifferentiated pleomorphic sarcoma. *p < 0.05.
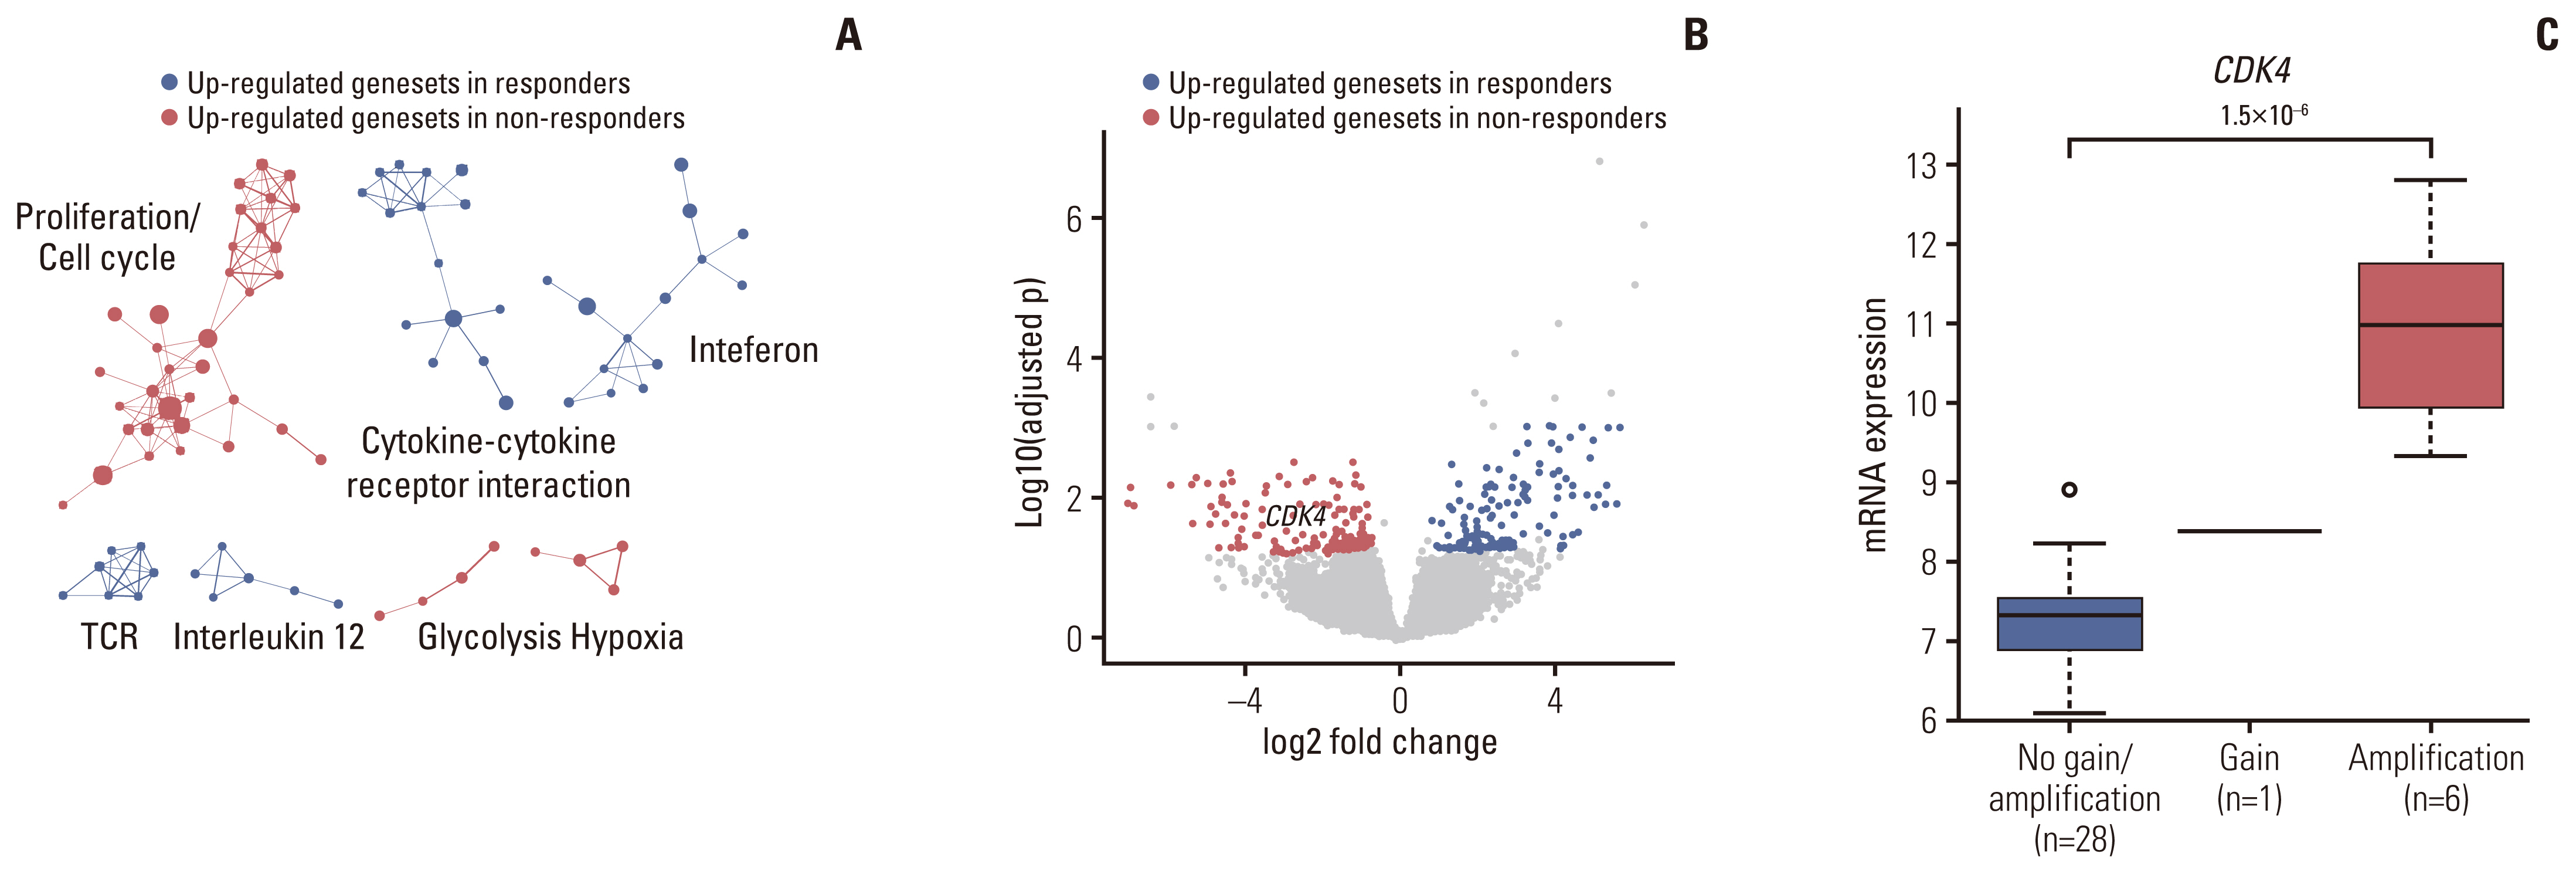
Fig. 4 Transcriptomic correlates of clinical response to pazopanib. (A) Gene Set Enrichment Analysis between pazopanib-sensitive and resistant patients. Significantly enriched gene sets (false discovery rate < 0.05) were clustered based on their similarity. (B) Volcano plot representation of genes differentially expressed between pazopanib-responders and non-responders. Genes with > 1 log2 fold change and an adjusted p < 0.05 are colored in red (responder DEGs), and those with < −1 log2 fold change and an adjusted p < 0.05 are colored in blue (non-responder DEGs). (C) The association between mRNA expression levels (log2(FPKM+1)) and copy number variations of CDK4. p-values were calculated using the two-sided Student t test. DEG, differentially expressed genes; FPKM, fragments per kilobase of transcripts per million mapped reads; TCR, T cell receptor.

Fig. 5 Transcriptomic correlates of clinical response to the pazopanib-durvalumab combination. (A) Heat map and unsupervised hierarchical clustering describing tumor microenvironment cell infiltration. Color scale indicates Z-normalized MCP scores of each type of microenvironment cell across samples. Color bar above the heatmap indicates responders (blue) and non-responders (red) to the pazopanib-durvalumab combination. (B) Immune cell fraction analysis of responding and non-responding patients receiving the pazopanib-durvalumab combination. Immune cell fractions were estimated using MCPcounter scores. *p < 0.05. p-value is from Student’s t test and not adjusted for multiple tests. (C) Gene Set Enrichment Analysis (GSEA) between sensitive and resistant patients to the pazopanib-durvalumab combination. Significantly enriched gene sets (FDR < 0.05) were clustered based on their similarity. (D, E) GSEA plot showing BIOCARTA natural killer (NK) cell pathway and Kyoto Encyclopedia of Genes and Genomes (KEGG) NK cell–mediated cytotoxicity pathway enrichment in the responder group. FDR, false discovery rate; NES, normalized enriched score. (F) Volcano plot representation of differentially expressed gene analysis between responders and non-responders to the pazopanib-durvalumab combination. Genes with > 1 log2 fold change and an adjusted p < 0.05 are colored in red, and those with < −1 log2 fold change and an adjusted p < 0.05 are colored in blue.
Reference
-
References
1. Hensley ML, Maki R, Venkatraman E, Geller G, Lovegren M, Aghajanian C, et al. Gemcitabine and docetaxel in patients with unresectable leiomyosarcoma: results of a phase II trial. J Clin Oncol. 2002; 20:2824–31.
Article2. Judson I, Verweij J, Gelderblom H, Hartmann JT, Schoffski P, Blay JY, et al. Doxorubicin alone versus intensified doxorubicin plus ifosfamide for first-line treatment of advanced or metastatic soft-tissue sarcoma: a randomised controlled phase 3 trial. Lancet Oncol. 2014; 15:415–23.
Article3. Italiano A, Mathoulin-Pelissier S, Cesne AL, Terrier P, Bonvalot S, Collin F, et al. Trends in survival for patients with metastatic soft-tissue sarcoma. Cancer. 2011; 117:1049–54.
Article4. Sleijfer S, Ray-Coquard I, Papai Z, Le Cesne A, Scurr M, Schoffski P, et al. Pazopanib, a multikinase angiogenesis inhibitor, in patients with relapsed or refractory advanced soft tissue sarcoma: a phase II study from the European organisation for research and treatment of cancer-soft tissue and bone sarcoma group (EORTC study 62043). J Clin Oncol. 2009; 27:3126–32.
Article5. van der Graaf WT, Blay JY, Chawla SP, Kim DW, Bui-Nguyen B, Casali PG, et al. Pazopanib for metastatic soft-tissue sarcoma (PALETTE): a randomised, double-blind, placebo-controlled phase 3 trial. Lancet. 2012; 379:1879–86.
Article6. Tawbi HA, Burgess M, Bolejack V, Van Tine BA, Schuetze SM, Hu J, et al. Pembrolizumab in advanced soft-tissue sarcoma and bone sarcoma (SARC028): a multicentre, two-cohort, single-arm, open-label, phase 2 trial. Lancet Oncol. 2017; 18:1493–501.
Article7. Feng X, Pleasance E, Zhao EY, Ng T, Grewal JK, Mohammad N, et al. Therapeutic implication of genomic landscape of adult metastatic sarcoma. JCO Precis Oncol. 2019; 3:1–25.
Article8. Baker SJ, Reddy EP. CDK4: a key player in the cell cycle, development, and cancer. Genes Cancer. 2012; 3:658–69.
Article9. Becht E, Giraldo NA, Lacroix L, Buttard B, Elarouci N, Petitprez F, et al. Estimating the population abundance of tissue-infiltrating immune and stromal cell populations using gene expression. Genome Biol. 2016; 17:218.10. Sleijfer S, Gorlia T, Lamers C, Burger H, Blay JY, Le Cesne A, et al. Cytokine and angiogenic factors associated with efficacy and toxicity of pazopanib in advanced soft-tissue sarcoma: an EORTC-STBSG study. Br J Cancer. 2012; 107:639–45.
Article11. Kobayashi H, Okuma T, Oka H, Hirai T, Ohki T, Ikegami M, et al. Neutrophil-to-lymphocyte ratio after pazopanib treatment predicts response in patients with advanced soft-tissue sarcoma. Int J Clin Oncol. 2018; 23:368–74.
Article12. Cancer Genome Atlas Research Network. Comprehensive and integrated genomic characterization of adult soft tissue sarcomas. Cell. 2017; 171:950–65.13. Barretina J, Taylor BS, Banerji S, Ramos AH, Lagos-Quintana M, Decarolis PL, et al. Subtype-specific genomic alterations define new targets for soft-tissue sarcoma therapy. Nat Genet. 2010; 42:715–21.
Article14. Nakamura T, Matsumine A, Kawai A, Araki N, Goto T, Yonemoto T, et al. The clinical outcome of pazopanib treatment in Japanese patients with relapsed soft tissue sarcoma: a Japanese Musculoskeletal Oncology Group (JMOG) study. Cancer. 2016; 122:1408–16.
Article15. Semenza GL. Defining the role of hypoxia-inducible factor 1 in cancer biology and therapeutics. Oncogene. 2010; 29:625–34.
Article16. Zelzer E, Levy Y, Kahana C, Shilo BZ, Rubinstein M, Cohen B. Insulin induces transcription of target genes through the hypoxia-inducible factor HIF-1alpha/ARNT. EMBO J. 1998; 17:5085–94.17. AACR Project GENIE Consortium. AACR Project GENIE: powering precision medicine through an international consortium. Cancer Discov. 2017; 7:818–31.18. Koehler K, Liebner D, Chen JL. TP53 mutational status is predictive of pazopanib response in advanced sarcomas. Ann Oncol. 2016; 27:539–43.
Article19. Wheler JJ, Janku F, Naing A, Li Y, Stephen B, Zinner R, et al. TP53 alterations correlate with response to VEGF/VEGFR inhibitors: implications for targeted therapeutics. Mol Cancer Ther. 2016; 15:2475–85.20. Petitprez F, de Reynies A, Keung EZ, Chen TW, Sun CM, Calderaro J, et al. B cells are associated with survival and immunotherapy response in sarcoma. Nature. 2020; 577:556–60.
Article21. Allen E, Jabouille A, Rivera LB, Lodewijckx I, Missiaen R, Steri V, et al. Combined antiangiogenic and anti-PD-L1 therapy stimulates tumor immunity through HEV formation. Sci Transl Med. 2017; 9:eaak9679.
Article22. Aggen DH, Drake CG, Rini BI. Targeting PD-1 or PD-L1 in metastatic kidney cancer: combination therapy in the first-line setting. Clin Cancer Res. 2020; 26:2087–95.
Article23. Wilky BA, Trucco MM, Subhawong TK, Florou V, Park W, Kwon D, et al. Axitinib plus pembrolizumab in patients with advanced sarcomas including alveolar soft-part sarcoma: a single-centre, single-arm, phase 2 trial. Lancet Oncol. 2019; 20:837–48.
Article
- Full Text Links
-
- Actions
-
Cited
- CITED
-
- Close
- Share
-
- Similar articles
-
- Durable Response to Pazopanib in a Patient with Metastatic Alveolar Soft Part Sarcoma
- Comparative Evaluation of Second-Line Chemotherapy Agents for Advanced Soft Tissue Sarcoma: Gemcitabine/Docetaxel, Pazopanib, and Alternatives
- Treatment of a Patient with Kaposi's Sarcoma Arising during Hemodialysis with the Multikinase Inhibitor Pazopanib
- Pazopanib monotherapy in the treatment of pretreated, metastatic uterine sarcoma: a single-center retrospective study
- Trial of Pazopanib in Proximal-type Epithelioid Sarcoma
