The Effects of Exercise and Restriction of Sugar-Sweetened Beverages on Muscle Function and Autophagy Regulation in High-Fat High-Sucrose-Fed Obesity Mice
- Affiliations
-
- 1Institute of Sports Science, Seoul National University, Seoul, Korea
- 2School of Physical Education, Xizang Minzu University, Xianyang, China
- 3Institute of Sports Biology, Shaanxi Normal University, Xi’an, China
- 4Institute on Aging, Seoul National University, Seoul, Korea
- KMID: 2520859
- DOI: http://doi.org/10.4093/dmj.2020.0157
Abstract
- Background
Autophagy maintains muscle mass and healthy skeletal muscles. Several recent studies have associated sugar-sweetened beverage (SSB) consumption with diseases. We investigated whether muscle dysfunction due to obesity could be restored by SSB restriction (SR) alone or in combination with exercise (EX) training.
Methods
Obese mice were subjected to SR combined with treadmill EX. Intraperitoneal glucose tolerance test, grip strength test, hanging time test, and body composition analysis were performed. Triglyceride (TG) and total cholesterol (TC) serum concentrations and TG concentrations in quadriceps muscles were analyzed. Western blot and reverse transcription-quantitative polymerase chain reaction helped analyze autophagy-related protein and mRNA expression, respectively.
Results
SR alone had no significant effect on fasting blood glucose levels, glucose tolerance, and muscle function. However, it had effect on serum TC, serum TG, and BCL2 interacting protein 3 expression. SR+EX improved glucose tolerance and muscle function and increased serum TC utilization than SR alone. SR+EX reduced P62 levels, increased glucose transporter type 4 and peroxisome proliferator-activated receptor γ coactivator-1α protein expression, and improved grip strength relative to the high-fat and high-sucrose liquid (HFHS) group, and this was not observed in the HFHS+EX group.
Conclusion
SR induced mitophagy-related protein expression in quadriceps, without affecting muscle function. And, the combination of SR and EX activated mitophagy-related proteins and improved muscle function.
Figure
-

Fig. 1. Schematic diagram of the experimental design. Male C57BL/6 mice, 4-week-old (n=61) were randomly assigned to six groups. Five mice from the high-fat and high-sucrose liquid (HFHS) group were subjected to glucose tolerance test and muscle performance test before re-grouping. After diet or exercise intervention, five mice from each of the eight groups were subjected to glucose tolerance test, muscle performance test, morphological observation, and tissue lipid quantification. Moreover, the other six mice from the groups as mentioned above were subjected to biological detection. Control (CON), normal diet+plain water; EX, exercise; SR, sugar-sweetened beverages (SSB) restriction, high-fat diet+plain water; TG, triglyceride; TC, total cholesterol; RT-PCR, reverse transcription-polymerase chain reaction.

Fig. 2. Effects of SR and exercise on body weight and food intake. (A) Images of mice. (B) Change in the body weight (n=5). (C) The area under the curve of energy intake (n=5). (D) Diet or liquid intake (n=5). (E) Wet weight of adipose tissues (n=6). (F) Normalized wet weight of adipose tissues (n=6). (G) Results of body composition analysis (n=5). All values are shown as the mean±standard deviation. HFHS, high-fat and high-sucrose liquid; EX, exercise; SR, sugar-sweetened beverages (SSB) restriction, high-fat diet+plain water; iWAT, inguinal white adipose tissue; eWAT, epididymal white adipose tissue; iBAT, interscapular brown adipose tissue. aP<0.05, bP<0.01 vs. the HFHS group and cP<0.05, dP<0.01 vs. the SR group.
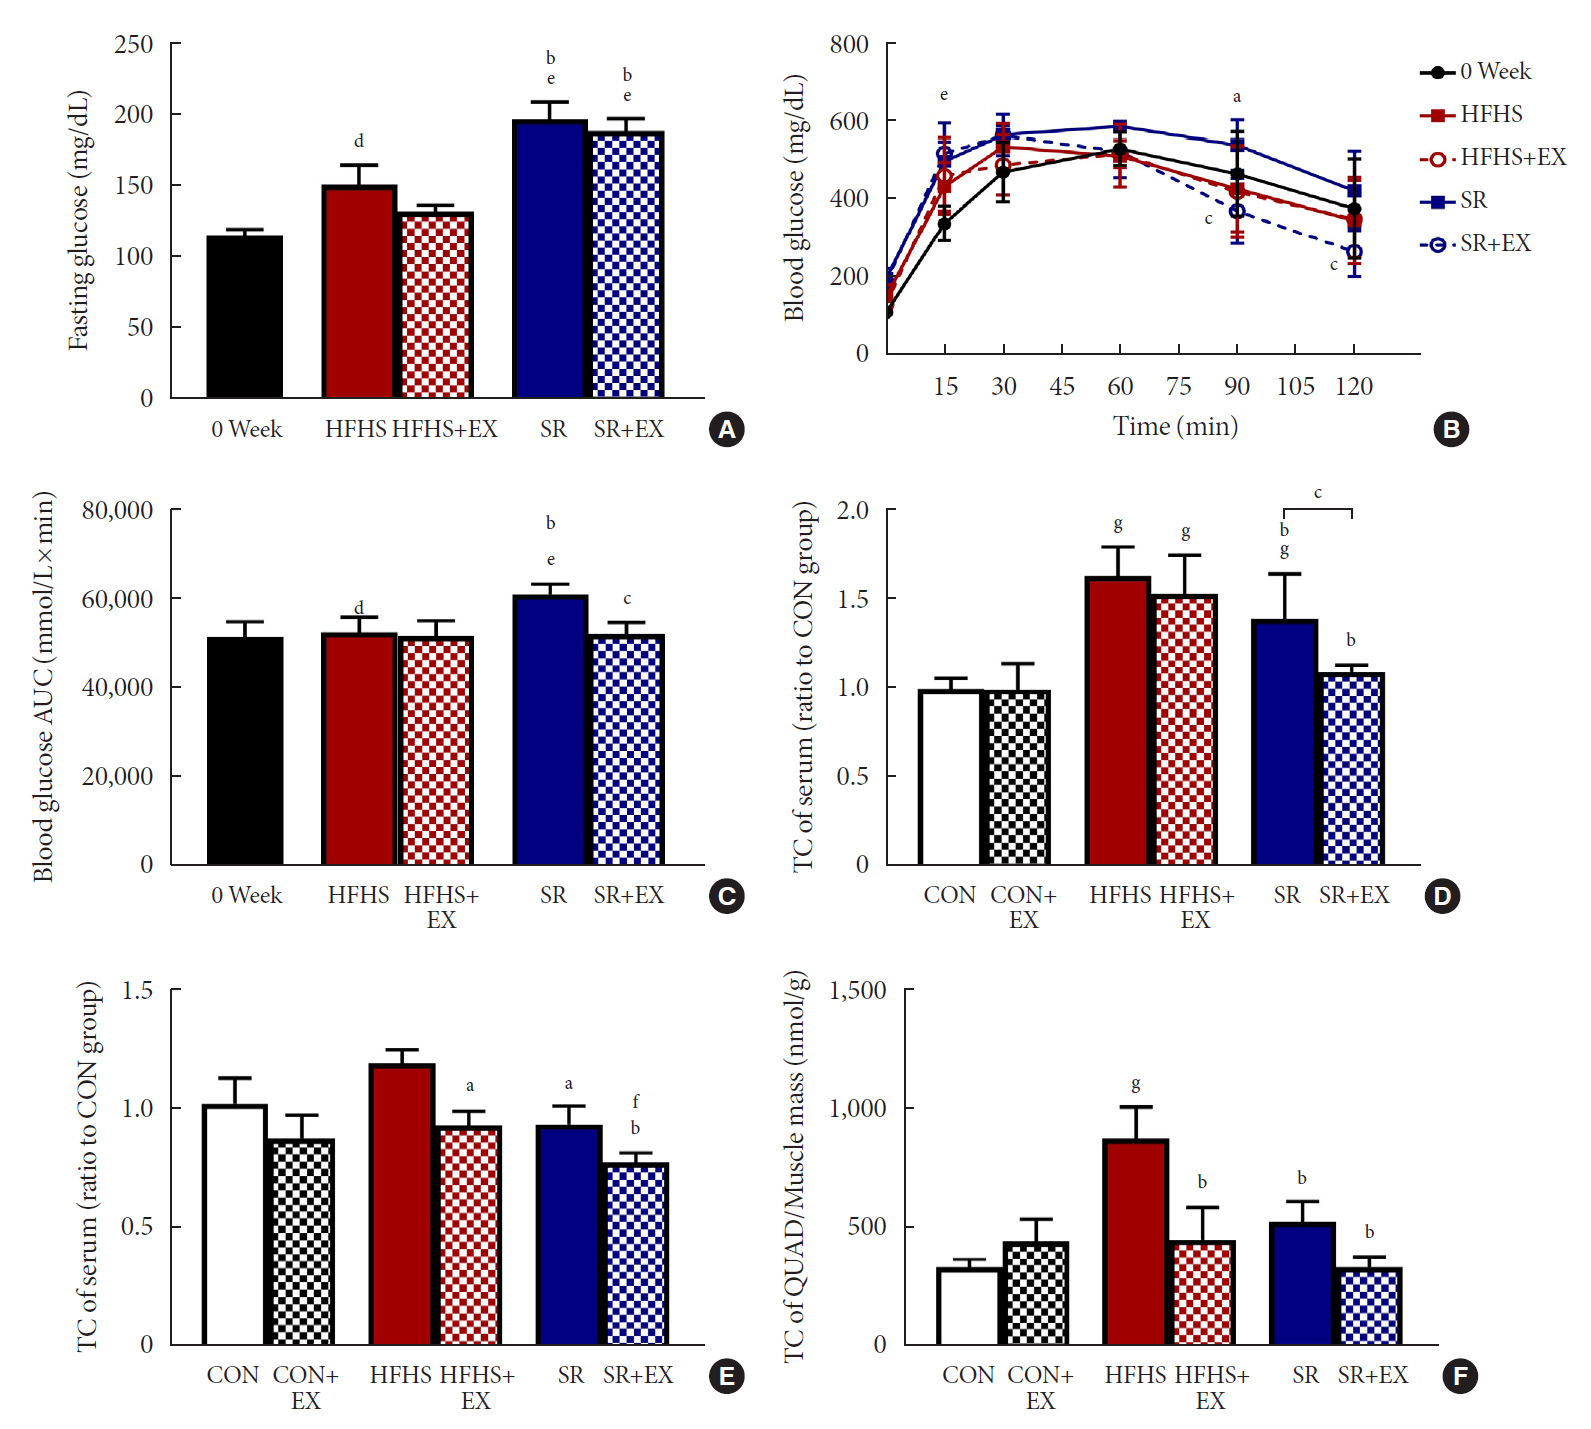
Fig. 3. Effects of SR and exercise on glucose and lipid metabolism. (A) Fasting glucose (n=5). (B) Intraperitoneal glucose tolerance test (ipGTT) curve (n=5). (C) The area under the curve (AUC) of ipGTT (n=5). (D) Total cholesterol (TC) (n=6). (E) Triglyceride (TG) concentration (n=6) of serum. (F) TG concentration (n=6) of quadriceps (QUAD). All values are shown as the mean±standard deviation. 0 week, point before intervention; HFHS, high-fat and high-sucrose liquid; EX, exercise; SR, sugar-sweetened beverages (SSB) restriction, high-fat+plain water. aP<0.05, bP<0.01 vs. the HFHS group, cP<0.01 vs. the SR group, dP<0.05, eP<0.01 vs. 0 week, fP<0.01, and gP<0.01 vs. the control (CON) group

Fig. 4. Effects of SR and exercise on skeletal muscle performance. (A) Normalized quadriceps mass (n=6). (B) Normalized gastrocnemius mass (n=6). (C) Normalized tibialis anterior mass (n=6). (D) Normalized soleus mass (n=6). (E) Normalized extensor digitorum longus mass (n=6). (F) Normalized hanging time (n=5). (G) Normalized grip strength (n=5). All values are shown as the mean±standard deviation. 0 week, point before intervention; control (CON), normal diet+plain water; EX, exercise; HFHS, high-fat and high-sucrose liquid; SR, sugar-sweetened beverages (SSB) restriction, high-fat+plain water diet. aP<0.05, bP<0.01 vs. the HFHS group, cP<0.05, dP<0.01 vs. the SR group, eP<0.01 vs. 0 week, and fP<0.05, gP<0.01 vs. the CON group.
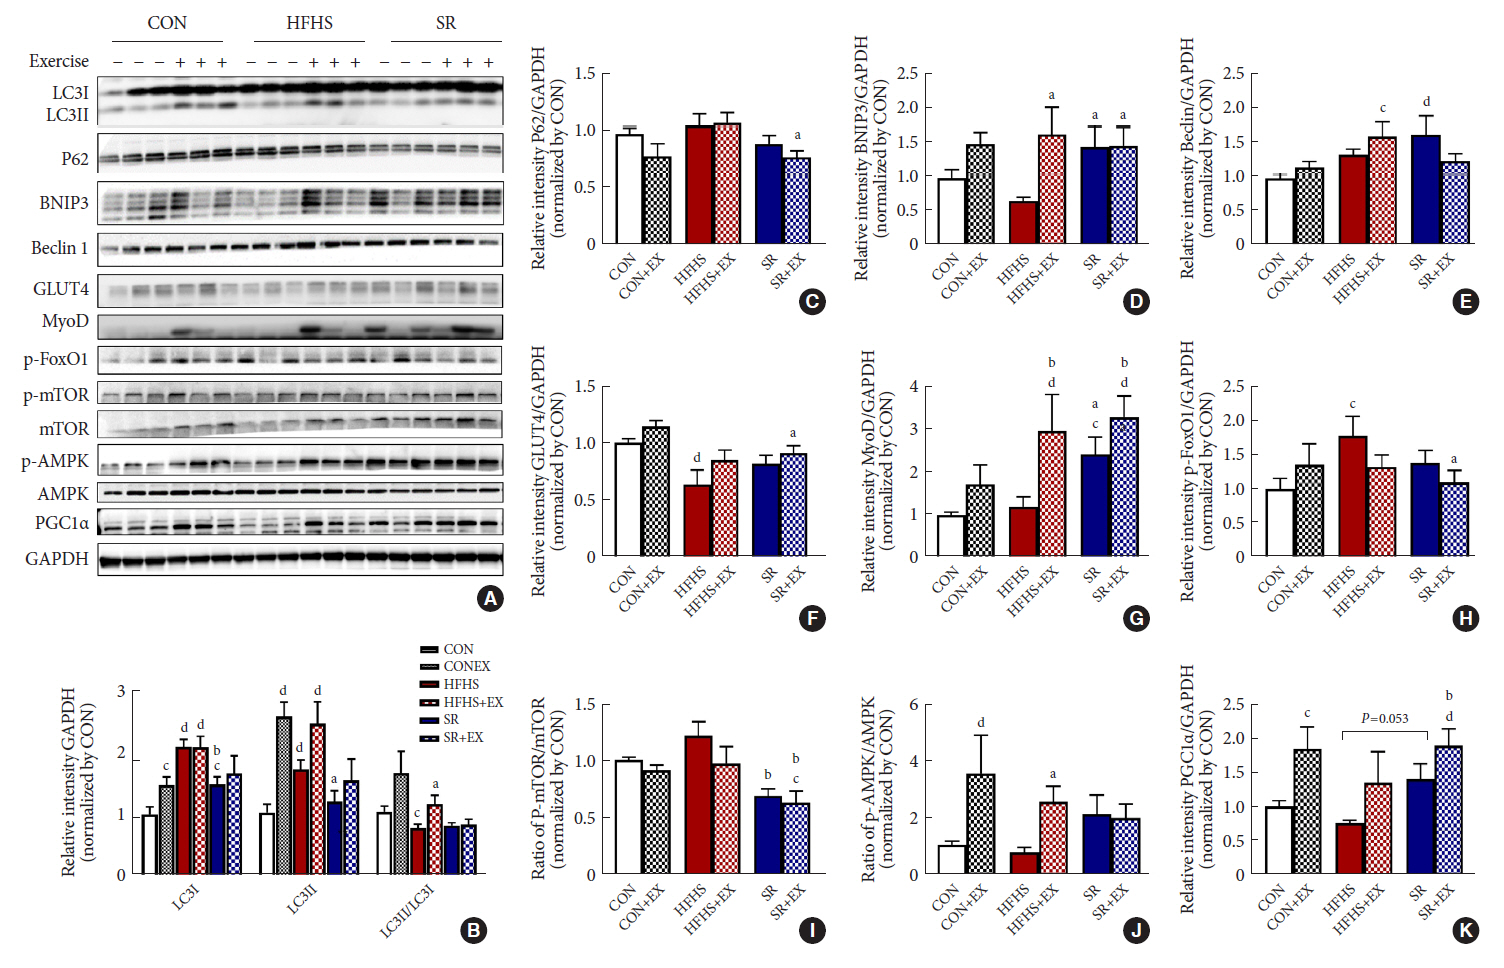
Fig. 5. Effects of SR and exercise on the expression of the autophagy pathway-related proteins. (A) Images of immunoblotting results. (B) The graph shows the expression of microtubule-associated proteins 1A/1B light chain 3 (LC3I), LC3II, and LC3II/LC3I ratio, (C) P62, (D) BCL2 interacting protein 3 (BNIP3), (E) beclin1, (F) glucose transporter type 4 (GLUT4), (G) myogenic differentiation (MyoD); (H) p-forkhead box O1 (FoxO1), (I) p-mechanistic target of rapamycin (mTOR)/mTOR ratio, (J) p-AMP-activated protein kinase (AMPK)/AMPK ratio, (K) peroxisome proliferator-activated receptor γ coactivator-1α (PGC1α), determined by densitometric quantification. All values are shown as the mean±standard error of the mean (n=6). GAPDH, glyceraldehyde-3-phosphate dehydrogenase; Control (CON), normal diet+plain water; EX, exercise; HFHS, high-fat and high-sucrose liquid; SR, sugar-sweetened beverages (SSB) restriction, high-fat+plain water diet. aP<0.05, bP<0.01 vs. the HFHS group, cP<0.05, and dP<0.01 vs. the CON group.

Reference
-
1. Hruby A, Hu FB. The epidemiology of obesity: a big picture. Pharmacoeconomics. 2015; 33:673–89.
Article2. De Pergola G, Silvestris F. Obesity as a major risk factor for cancer. J Obes. 2013; 2013:291546.
Article3. Wearing SC, Hennig EM, Byrne NM, Steele JR, Hills AP. Musculoskeletal disorders associated with obesity: a biomechanical perspective. Obes Rev. 2006; 7:239–50.
Article4. De Stefano F, Zambon S, Giacometti L, Sergi G, Corti MC, Manzato E, et al. Obesity, muscular strength, muscle composition and physical performance in an elderly population. J Nutr Health Aging. 2015; 19:785–91.
Article5. Collins KH, Herzog W, MacDonald GZ, Reimer RA, Rios JL, Smith IC, et al. Obesity, metabolic syndrome, and musculoskeletal disease: common inflammatory pathways suggest a central role for loss of muscle integrity. Front Physiol. 2018; 9:112.
Article6. Abramowitz MK, Hall CB, Amodu A, Sharma D, Androga L, Hawkins M. Muscle mass, BMI, and mortality among adults in the United States: a population-based cohort study. PLoS One. 2018; 13:e0194697.
Article7. Wang Y, Lee DC, Brellenthin AG, Sui X, Church TS, Lavie CJ, et al. Association of muscular strength and incidence of type 2 diabetes. Mayo Clin Proc. 2019; 94:643–51.
Article8. Lee SR, Khamoui AV, Jo E, Park BS, Zourdos MC, Panton LB, et al. Effects of chronic high-fat feeding on skeletal muscle mass and function in middle-aged mice. Aging Clin Exp Res. 2015; 27:403–11.
Article9. Bonnard C, Durand A, Peyrol S, Chanseaume E, Chauvin MA, Morio B, et al. Mitochondrial dysfunction results from oxidative stress in the skeletal muscle of diet-induced insulin-resistant mice. J Clin Invest. 2008; 118:789–800.
Article10. Suga T, Kinugawa S, Takada S, Kadoguchi T, Fukushima A, Homma T, et al. Combination of exercise training and diet restriction normalizes limited exercise capacity and impaired skeletal muscle function in diet-induced diabetic mice. Endocrinology. 2014; 155:68–80.
Article11. Mullee A, Romaguera D, Pearson-Stuttard J, Viallon V, Stepien M, Freisling H, et al. Association between soft drink consumption and mortality in 10 European countries. JAMA Intern Med. 2019; 179:1479–90.
Article12. Drouin-Chartier JP, Zheng Y, Li Y, Malik V, Pan A, Bhupathiraju SN, et al. Changes in consumption of sugary beverages and artificially sweetened beverages and subsequent risk of type 2 diabetes: results from three large prospective U.S. cohorts of women and men. Diabetes Care. 2019; 42:2181–9.
Article13. Ma J, Karlsen MC, Chung M, Jacques PF, Saltzman E, Smith CE, et al. Potential link between excess added sugar intake and ectopic fat: a systematic review of randomized controlled trials. Nutr Rev. 2016; 74:18–32.
Article14. Jia G, Sowers JR. Increased fibro-adipogenic progenitors and intramyocellular lipid accumulation in obesity-related skeletal muscle dysfunction. Diabetes. 2019; 68:18–20.
Article15. De Stefanis D, Mastrocola R, Nigro D, Costelli P, Aragno M. Effects of chronic sugar consumption on lipid accumulation and autophagy in the skeletal muscle. Eur J Nutr. 2017; 56:363–73.
Article16. Nguyen TB, Louie SM, Daniele JR, Tran Q, Dillin A, Zoncu R, et al. DGAT1-dependent lipid droplet biogenesis protects mitochondrial function during starvation-induced autophagy. Dev Cell. 2017; 42:9–21.
Article17. Neel BA, Lin Y, Pessin JE. Skeletal muscle autophagy: a new metabolic regulator. Trends Endocrinol Metab. 2013; 24:635–43.
Article18. Paolini A, Omairi S, Mitchell R, Vaughan D, Matsakas A, Vaiyapuri S, et al. Attenuation of autophagy impacts on muscle fibre development, starvation induced stress and fibre regeneration following acute injury. Sci Rep. 2018; 8:9062.
Article19. van Niekerk G, du Toit A, Loos B, Engelbrecht AM. Nutrient excess and autophagic deficiency: explaining metabolic diseases in obesity. Metabolism. 2018; 82:14–21.
Article20. Zhang D, Lee JH, Kwak SE, Shin HE, Zhang Y, Moon HY, et al. Effect of a single bout of exercise on autophagy regulation in skeletal muscle of high-fat high-sucrose diet-fed mice. J Obes Metab Syndr. 2019; 28:175–85.
Article21. Baynard T, Vieira-Potter VJ, Valentine RJ, Woods JA. Exercise training effects on inflammatory gene expression in white adipose tissue of young mice. Mediators Inflamm. 2012; 2012:767953.
Article22. He C, Bassik MC, Moresi V, Sun K, Wei Y, Zou Z, et al. Exercise-induced BCL2-regulated autophagy is required for muscle glucose homeostasis. Nature. 2012; 481:511–5.
Article23. Aartsma-Rus A, van Putten M. Assessing functional performance in the mdx mouse model. J Vis Exp. 2014; 51303.24. Benetti E, Mastrocola R, Rogazzo M, Chiazza F, Aragno M, Fantozzi R, et al. High sugar intake and development of skeletal muscle insulin resistance and inflammation in mice: a protective role for PPAR-δ agonism. Mediators Inflamm. 2013; 2013:509502.25. Micha R, Penalvo JL, Cudhea F, Imamura F, Rehm CD, Mozaffarian D. Association between dietary factors and mortality from heart disease, stroke, and type 2 diabetes in the United States. JAMA. 2017; 317:912–24.
Article26. Bergallo P, Castagnari V, Fernandez A, Mejia R. Regulatory initiatives to reduce sugar-sweetened beverages (SSBs) in Latin America. PLoS One. 2018; 13:e0205694.
Article27. Luger M, Lafontan M, Bes-Rastrollo M, Winzer E, Yumuk V, Farpour-Lambert N. Sugar-sweetened beverages and weight gain in children and adults: a systematic review from 2013 to 2015 and a comparison with previous studies. Obes Facts. 2017; 10:674–93.
Article28. Choi JY, Park MN, Kim CS, Lee YK, Choi EY, Chun WY, et al. Long-term consumption of sugar-sweetened beverage during the growth period promotes social aggression in adult mice with proinflammatory responses in the brain. Sci Rep. 2017; 7:45693.
Article29. Reason SL, Westman EC, Godfrey R, Maguire E. Can a lowcarbohydrate diet improve exercise tolerance in mcardle disease? J Rare Disord Diagn Ther. 2017; 3:1.
Article30. Warmington SA, Tolan R, McBennett S. Functional and histological characteristics of skeletal muscle and the effects of leptin in the genetically obese (ob/ob) mouse. Int J Obes Relat Metab Disord. 2000; 24:1040–50.
Article31. Kendig MD, Ekayanti W, Stewart H, Boakes RA, Rooney K. Metabolic effects of access to sucrose drink in female rats and transmission of some effects to their offspring. PLoS One. 2015; 10:e0131107.
Article32. Evans RA, Frese M, Romero J, Cunningham JH, Mills KE. Fructose replacement of glucose or sucrose in food or beverages lowers postprandial glucose and insulin without raising triglycerides: a systematic review and meta-analysis. Am J Clin Nutr. 2017; 106:506–18.
Article33. Togo J, Hu S, Li M, Niu C, Speakman JR. Impact of dietary sucrose on adiposity and glucose homeostasis in C57BL/6J mice depends on mode of ingestion: liquid or solid. Mol Metab. 2019; 27:22–32.
Article34. Cao D, Lu H, Lewis TL, Li L. Intake of sucrose-sweetened water induces insulin resistance and exacerbates memory deficits and amyloidosis in a transgenic mouse model of Alzheimer disease. J Biol Chem. 2007; 282:36275–82.
Article35. Yagi S, Kadota M, Aihara KI, Nishikawa K, Hara T, Ise T, et al. Association of lower limb muscle mass and energy expenditure with visceral fat mass in healthy men. Diabetol Metab Syndr. 2014; 6:27.
Article36. Lam T, Harmancey R, Vasquez H, Gilbert B, Patel N, Hariharan V, et al. Reversal of intramyocellular lipid accumulation by lipophagy and a p62-mediated pathway. Cell Death Discov. 2016; 2:16061.
Article37. Long M, Li X, Li L, Dodson M, Zhang DD, Zheng H. Multifunctional p62 effects underlie diverse metabolic diseases. Trends Endocrinol Metab. 2017; 28:818–30.
Article38. Carvalho C, Cardoso S, Correia SC, Santos RX, Santos MS, Baldeiras I, et al. Metabolic alterations induced by sucrose intake and Alzheimer’s disease promote similar brain mitochondrial abnormalities. Diabetes. 2012; 61:1234–42.
Article39. Jorgensen W, Rud KA, Mortensen OH, Frandsen L, Grunnet N, Quistorff B. Your mitochondria are what you eat: a high-fat or a high-sucrose diet eliminates metabolic flexibility in isolated mitochondria from rat skeletal muscle. Physiol Rep. 2017; 5:e13207.
Article40. Khan NM, Ansari MY, Haqqi TM. Sucrose, but not glucose, blocks IL1-β-induced inflammatory response in human chondrocytes by inducing autophagy via AKT/mTOR pathway. J Cell Biochem. 2017; 118:629–39.
Article41. Lira VA, Okutsu M, Zhang M, Greene NP, Laker RC, Breen DS, et al. Autophagy is required for exercise training-induced skeletal muscle adaptation and improvement of physical performance. FASEB J. 2013; 27:4184–93.
Article
- Full Text Links
-
- Actions
-
Cited
- CITED
-
- Close
- Share
-
- Similar articles
-
- Effects of Exercise and a High-Fat, High-Sucrose Restriction Diet on Metabolic Indicators, Nr4a3, and Mitochondria-Associated Protein Expression in the Gastrocnemius Muscles of Mice with Diet-Induced Obesity
- Effect of a Single Bout of Exercise on Autophagy Regulation in Skeletal Muscle of High-Fat High-Sucrose Diet-Fed Mice
- Consumption of Sugar-Sweetened Beverages and Blood Pressure in the United States: The National Health and Nutrition Examination Survey 2003-2006
- Beverage Consumption of Patients with Diabetes
- Effects of caloric restriction on the expression of lipocalin-2 and its receptor in the brown adipose tissue of high-fat diet-fed mice
