Relationship between Abnormal Hyperintensity on T2-Weighted Images Around Developmental Venous Anomalies and Magnetic Susceptibility of Their Collecting Veins: In-Vivo Quantitative Susceptibility Mapping Study
- Affiliations
-
- 1Department of Radiology, Seoul St. Mary's Hospital, College of Medicine, The Catholic University of Korea, Seoul, Korea. znee@catholic.ac.kr
- KMID: 2440489
- DOI: http://doi.org/10.3348/kjr.2018.0685
Abstract
OBJECTIVE
A developmental venous anomaly (DVA) is a vascular malformation of ambiguous clinical significance. We aimed to quantify the susceptibility of draining veins (χvein) in DVA and determine its significance with respect to oxygen metabolism using quantitative susceptibility mapping (QSM).
MATERIALS AND METHODS
Brain magnetic resonance imaging of 27 consecutive patients with incidentally detected DVAs were retrospectively reviewed. Based on the presence of abnormal hyperintensity on T2-weighted images (T2WI) in the brain parenchyma adjacent to DVA, the patients were grouped into edema (E+, n = 9) and non-edema (E−, n = 18) groups. A 3T MR scanner was used to obtain fully flow-compensated gradient echo images for susceptibility-weighted imaging with source images used for QSM processing. The χvein was measured semi-automatically using QSM. The normalized χvein was also estimated. Clinical and MR measurements were compared between the E+ and E− groups using Student's t-test or Mann-Whitney U test. Correlations between the χvein and area of hyperintensity on T2WI and between χvein and diameter of the collecting veins were assessed. The correlation coefficient was also calculated using normalized veins.
RESULTS
The DVAs of the E+ group had significantly higher χvein (196.5 ± 27.9 vs. 167.7 ± 33.6, p = 0.036) and larger diameter of the draining veins (p = 0.006), and patients were older (p = 0.006) than those in the E− group. The χvein was also linearly correlated with the hyperintense area on T2WI (r = 0.633, 95% confidence interval 0.333-0.817, p < 0.001).
CONCLUSION
DVAs with abnormal hyperintensity on T2WI have higher susceptibility values for draining veins, indicating an increased oxygen extraction fraction that might be associated with venous congestion.
Keyword
MeSH Terms
Figure
-
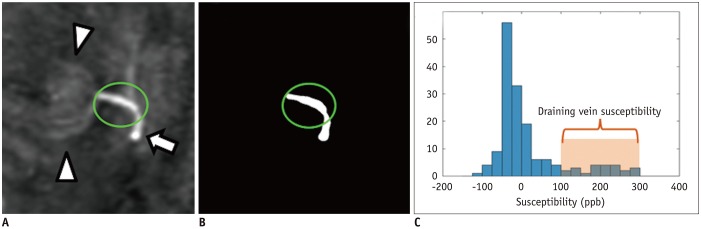
Fig. 1 Susceptibility measurement of collecting vein of DVA.A. ROI was drawn on QSM image for collecting vein (arrow), but not on DVA itself (arrowheads). B. Note clear demarcation of draining vein at threshold of 100 ppb. C. On histogram of ROI-voxel susceptibility values, mean susceptibility of voxels over threshold (100 ppb) was used to estimate susceptibility of draining vein. Mean value of remaining voxels was used to measure susceptibility of adjacent brain tissue. DVA = developmental venous anomaly, QSM = quantitative susceptibility mapping, ROI = region of interest
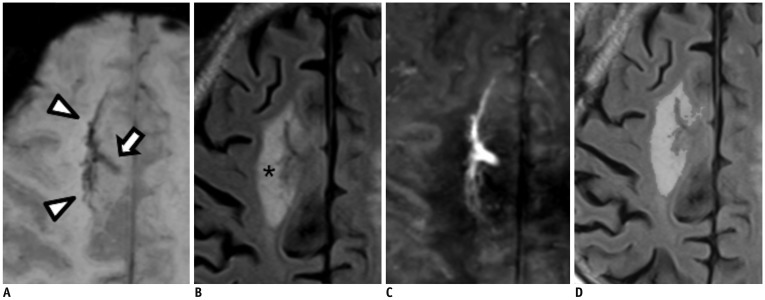
Fig. 2 86-year-old female with DVA in right frontal lobe.SWI (A) shows DVA itself (arrowheads) and collecting vein (arrow). T2-weighted fluid-attenuated inversion recovery image (B) shows large area of T2 hyperintensity (asterisk). On QSM image (C), paramagnetic venous structure of DVA is well demonstrated. χvein is 233 ppb and normalized χvein is 238 ppb. Diameter of collecting vein is 2.7 mm and T2 hyperintensity area is 9.63 mm2 (D). SWI = susceptibility weighted images, χvein = susceptibility of draining veins
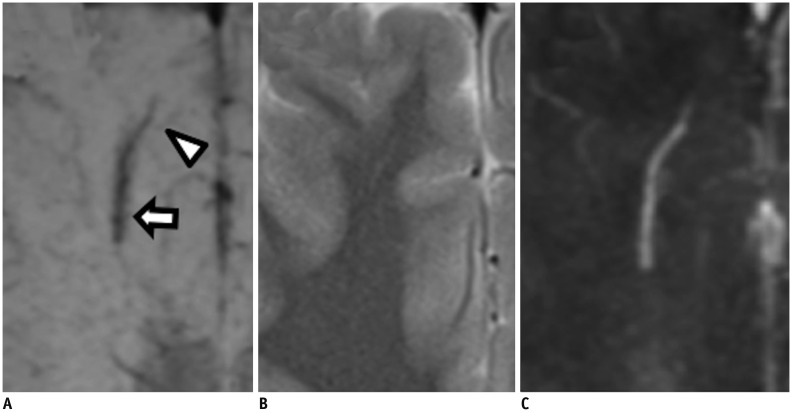
Fig. 3 36-year-old male with DVA in his right frontal lobe.SWI (A) shows DVA itself (arrowhead) and collecting vein (arrow). On T2-weighted image (B), no hyperintensity is observed. On QSM image (C), χvein is 142 ppb and normalized χvein is 145 ppb with diameter of 1.04 mm.
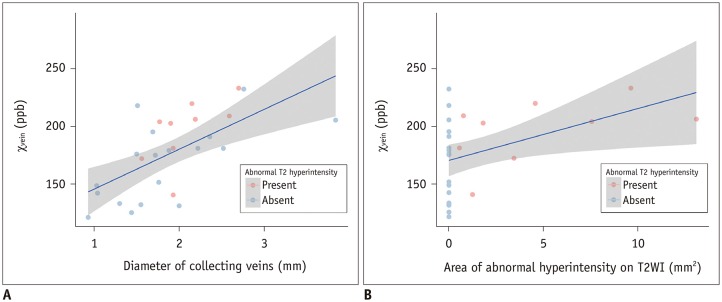
Fig. 4 Scatter plots demonstrating relationship between χvein with respect to (A) diameter of collecting veins and (B) area of abnormal hyperintensity on T2-weighted image with moderate positive correlations (A: r = 0.633, p < 0.001, B: r = 0.444, p = 0.020).Regression lines are drawn in blue and their 95% confidence intervals are shown as grey areas. T2WI = T2-weighted images
Reference
-
1. Amemiya S, Aoki S, Takao H. Venous congestion associated with developmental venous anomaly: findings on susceptibility weighted imaging. J Magn Reson Imaging. 2008; 28:1506–1509. PMID: 19025939.
Article3. Rammos SK, Maina R, Lanzino G. Developmental venous anomalies: current concepts and implications for management. Neurosurgery. 2009; 65:20–29. discussion 29-30. PMID: 19574822.4. San Millan Ruiz D, Delavelle J, Yilmaz H, Gailloud P, Piovan E, Bertramello A, et al. Parenchymal abnormalities associated with developmental venous anomalies. Neuroradiology. 2007; 49:987–995. PMID: 17703296.
Article5. Takasugi M, Fujii S, Shinohara Y, Kaminou T, Watanabe T, Ogawa T. Parenchymal hypointense foci associated with developmental venous anomalies: evaluation by phase-sensitive MR imaging at 3T. AJNR Am J Neuroradiol. 2013; 34:1940–1944. PMID: 23598832.
Article6. Jung HN, Kim ST, Cha J, Kim HJ, Byun HS, Jeon P, et al. Diffusion and perfusion MRI findings of the signal-intensity abnormalities of brain associated with developmental venous anomaly. AJNR Am J Neuroradiol. 2014; 35:1539–1542. PMID: 24651815.
Article7. Signorelli F, Gory B, Maduri R, Guyotat J, Pelissou-Guyotat I, Chirchiglia D, et al. Intracranial dural arteriovenous fistulas: a review of their current management based on emerging knowledge. J Neurosurg Sci. 2017; 61:193–206. PMID: 25677401.
Article8. Iwama T, Hashimoto N, Takagi Y, Tanaka M, Yamamoto S, Nishi S, et al. Hemodynamic and metabolic disturbances in patients with intracranial dural arteriovenous fistulas: positron emission tomography evaluation before and after treatment. J Neurosurg. 1997; 86:806–811. PMID: 9126896.
Article9. Roh JE, Cha SH, Lee SY, Jeon MH, Cho BS, Kang MH, et al. Atypical developmental venous anomaly associated with single arteriovenous fistula and intracerebral hemorrhage: a case demonstrated by superselective angiography. Korean J Radiol. 2012; 13:107–110. PMID: 22247645.
Article10. Wehrli FW, Rodgers ZB, Jain V, Langham MC, Li C, Licht DJ, et al. Time-resolved MRI oximetry for quantifying CMRO(2) and vascular reactivity. Acad Radiol. 2014; 21:207–214. PMID: 24439334.
Article11. Yamauchi H, Fukuyama H, Nagahama Y, Nabatame H, Ueno M, Nishizawa S, et al. Significance of increased oxygen extraction fraction in five-year prognosis of major cerebral arterial occlusive diseases. J Nucl Med. 1999; 40:1992–1998. PMID: 10616876.12. Grubb RL Jr, Derdeyn CP, Fritsch SM, Carpenter DA, Yundt KD, Videen TO, et al. Importance of hemodynamic factors in the prognosis of symptomatic carotid occlusion. JAMA. 1998; 280:1055–1060. PMID: 9757852.
Article13. Liu C, Li W, Tong KA, Yeom KW, Kuzminski S. Susceptibility-weighted imaging and quantitative susceptibility mapping in the brain. J Magn Reson Imaging. 2015; 42:23–41. PMID: 25270052.
Article14. Fushimi Y, Miki Y, Togashi K, Kikuta K, Hashimoto N, Fukuyama H. A developmental venous anomaly presenting atypical findings on susceptibility-weighted imaging. AJNR Am J Neuroradiol. 2008; 29:E56. PMID: 18372413.15. Wehrli FW, Fan AP, Rodgers ZB, Englund EK, Langham MC. Susceptibility-based time-resolved whole-organ and regional tissue oximetry. NMR Biomed. 2017; 30:DOI: 10.1002/nbm.3495. Epub 2016 Feb 26.
Article16. Zhang J, Liu T, Gupta A, Spincemaille P, Nguyen TD, Wang Y. Quantitative mapping of cerebral metabolic rate of oxygen (CMRO2) using quantitative susceptibility mapping (QSM). Magn Reson Med. 2015; 74:945–952. PMID: 25263499.17. Schofield MA, Zhu Y. Fast phase unwrapping algorithm for interferometric applications. Opt Lett. 2003; 28:1194–1196. PMID: 12885018.
Article18. Smith SM. Fast robust automated brain extraction. Hum Brain Mapp. 2002; 17:143–155. PMID: 12391568.
Article19. Joshi NV, Vesey AT, Williams MC, Shah AS, Calvert PA, Craighead FH, et al. 18F-fluoride positron emission tomography for identification of ruptured and high-risk coronary atherosclerotic plaques: a prospective clinical trial. Lancet. 2014; 383:705–713. PMID: 24224999.20. Li W, Wang N, Yu F, Han H, Cao W, Romero R, et al. A method for estimating and removing streaking artifacts in quantitative susceptibility mapping. Neuroimage. 2015; 108:111–122. PMID: 25536496.
Article21. Haacke EM, Liu S, Buch S, Zheng W, Wu D, Ye Y. Quantitative susceptibility mapping: current status and future directions. Magn Reson Imaging. 2015; 33:1–25. PMID: 25267705.
Article22. Yoo TS, Ackerman MJ, Lorensen WE, Schroeder W, Chalana V, Aylward S, et al. Engineering and algorithm design for an image processing Api: a technical report on ITK--the insight toolkit. Stud Health Technol Inform. 2002; 85:586–592. PMID: 15458157.23. Bilgic B, Pfefferbaum A, Rohlfing T, Sullivan EV, Adalsteinsson E. MRI estimates of brain iron concentration in normal aging using quantitative susceptibility mapping. Neuroimage. 2012; 59:2625–2635. PMID: 21925274.
Article24. Langkammer C, Schweser F, Krebs N, Deistung A, Goessler W, Scheurer E, et al. Quantitative susceptibility mapping (QSM) as a means to measure brain iron? A post mortem validation study. Neuroimage. 2012; 62:1593–1599. PMID: 22634862.
Article25. Deistung A, Schafer A, Schweser F, Biedermann U, Turner R, Reichenbach JR. Toward in vivo histology: a comparison of quantitative susceptibility mapping (QSM) with magnitude-, phase-, and R2*-imaging at ultra-high magnetic field strength. Neuroimage. 2013; 65:299–314. PMID: 23036448.
Article26. Chai C, Guo R, Zuo C, Fan L, Liu S, Qian T, et al. Decreased susceptibility of major veins in mild traumatic brain injury is correlated with post-concussive symptoms: a quantitative susceptibility mapping study. Neuroimage Clin. 2017; 15:625–632. PMID: 28664033.
Article27. Liu J, Xia S, Hanks R, Wiseman N, Peng C, Zhou S, et al. Susceptibility weighted imaging and mapping of micro-hemorrhages and major deep veins after traumatic brain injury. J Neurotrauma. 2016; 33:10–21. PMID: 25789581.
Article28. Taoka T, Fukusumi A, Miyasaka T, Kawai H, Nakane T, Kichikawa K, et al. Structure of the medullary veins of the cerebral hemisphere and related disorders. Radiographics. 2017; 37:281–297. PMID: 28076020.
Article29. Truwit CL. Venous angioma of the brain: history, significance, and imaging findings. AJR Am J Roentgenol. 1992; 159:1299–1307. PMID: 1442406.
Article30. Xia S, Utriainen D, Tang J, Kou Z, Zheng G, Wang X, et al. Decreased oxygen saturation in asymmetrically prominent cortical veins in patients with cerebral ischemic stroke. Magn Reson Imaging. 2014; 32:1272–1276. PMID: 25131626.
Article31. Letourneau-Guillon L, Krings T. Simultaneous arteriovenous shunting and venous congestion identification in dural arteriovenous fistulas using susceptibility-weighted imaging: initial experience. AJNR Am J Neuroradiol. 2012; 33:301–307. PMID: 22051813.
Article32. Nakagawa I, Taoka T, Wada T, Nakagawa H, Sakamoto M, Kichikawa K, et al. The use of susceptibility-weighted imaging as an indicator of retrograde leptomeningeal venous drainage and venous congestion with dural arteriovenous fistula: diagnosis and follow-up after treatment. Neurosurgery. 2013; 72:47–54. discussion 55.
- Full Text Links
-
- Actions
-
Cited
- CITED
-
- Close
- Share
-
- Similar articles
-
- Quantitative Susceptibility Mapping of Oxygen Metabolism: A Feasibility Study Utilizing a Large-Scale Clinical Dataset
- Associated Brain Parenchymal Abnormalities in Developmental Venous Anomalies: Evaluation with Susceptibility-weighted MR Imaging
- Susceptibility-Weighted MR Imaging for the Detection of Developmental Venous Anomaly: Comparison with T2 and FLAIR Imaging
- Susceptibility-Weighted MR Imaging for the Detection of Isolated Cortical Vein Thrombosis in a Patient with Spontaneous Intracranial Hypotension
- A newly Developed Hyperintensity Within a Posterior Cerebral Artery Susceptibility Vessel Sign in T2*-Weighted Gradient-Echo Imaging: a Case Report and Correlation with Magnetic Resonance Angiography and Black-Blood Imaging
