Tâ‚‚* Mapping from Multi-Echo Dixon Sequence on Gadoxetic Acid-Enhanced Magnetic Resonance Imaging for the Hepatic Fat Quantification: Can It Be Used for Hepatic Function Assessment?
- Affiliations
-
- 1Department of Radiology, Seoul National University Hospital, Seoul 03080, Korea. jmsh@snu.ac.kr
- 2Institute of Radiation Medicine, Seoul National University Hospital, Seoul 03080, Korea.
- 3Department of Radiology, Hallym University Sacred Heart Hospital, Anyang 14068, Korea.
- KMID: 2427237
- DOI: http://doi.org/10.3348/kjr.2017.18.4.682
Abstract
OBJECTIVE
To evaluate the diagnostic value of Tâ‚‚* mapping using 3D multi-echo Dixon gradient echo acquisition on gadoxetic acid-enhanced liver magnetic resonance imaging (MRI) as a tool to evaluate hepatic function.
MATERIALS AND METHODS
This retrospective study was approved by the IRB and the requirement of informed consent was waived. 242 patients who underwent liver MRIs, including 3D multi-echo Dixon fast gradient-recalled echo (GRE) sequence at 3T, before and after administration of gadoxetic acid, were included. Based on clinico-laboratory manifestation, the patients were classified as having normal liver function (NLF, n = 50), mild liver damage (MLD, n = 143), or severe liver damage (SLD, n = 30). The 3D multi-echo Dixon GRE sequence was obtained before, and 10 minutes after, gadoxetic acid administration. Pre- and post-contrast Tâ‚‚* values, as well as Tâ‚‚* reduction rates, were measured from Tâ‚‚* maps, and compared among the three groups.
RESULTS
There was a significant difference in Tâ‚‚* reduction rates between the NLF and SLD groups (−0.2 ± 4.9% vs. 5.0 ± 6.9%, p = 0.002), and between the MLD and SLD groups (3.2 ± 6.0% vs. 5.0 ± 6.9%, p = 0.003). However, there was no significant difference in both the pre- and post-contrast Tâ‚‚* values among different liver function groups (p = 0.735 and 0.131, respectively). A receiver operating characteristic (ROC) curve analysis showed that the area under the ROC curve for using Tâ‚‚* reduction rates to differentiate the SLD group from the NLF group was 0.74 (95% confidence interval: 0.63-0.83).
CONCLUSION
Incorporation of Tâ‚‚* mapping using 3D multi-echo Dixon GRE sequence in gadoxetic acid-enhanced liver MRI protocol may provide supplemental information for liver function deterioration in patients with SLD.
Keyword
MeSH Terms
-
Adult
Aged
Aged, 80 and over
Area Under Curve
Contrast Media/*chemistry
Female
Gadolinium DTPA/*chemistry
Humans
Liver Cirrhosis/diagnostic imaging
Liver Diseases/*diagnostic imaging
Liver Function Tests
*Magnetic Resonance Imaging
Male
Middle Aged
ROC Curve
Retrospective Studies
Young Adult
Contrast Media
Gadolinium DTPA
Figure
-
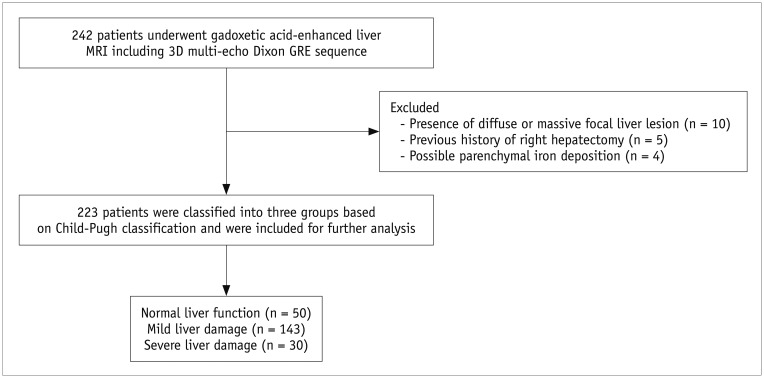
Fig. 1 Flow diagram of study population.GRE = gradient-recalled echo
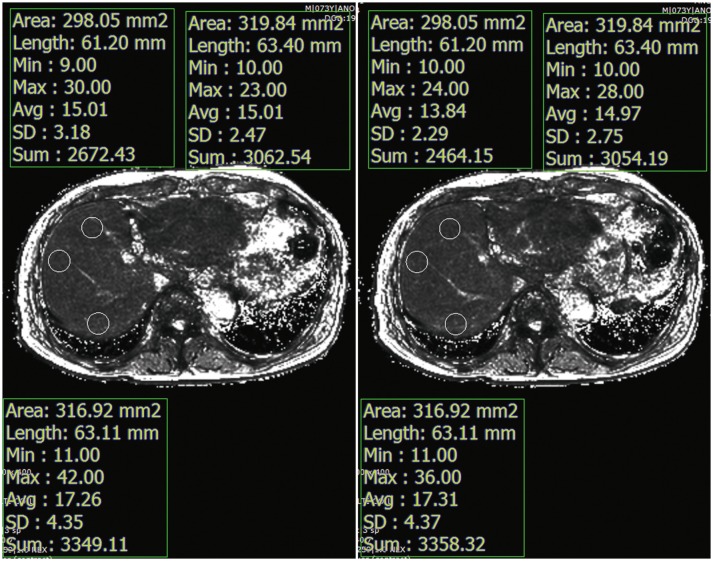
Fig. 2 T2* values were calculated in pre- and post-contrast T2* maps by drawing three circular ROIs in liver parenchyma while avoiding focal hepatic lesions, major branches of portal or hepatic veins, or imaging artifacts.ROIs were placed in same position in liver for both pre- and post-contrast T2* maps. ROIs = regions of interest
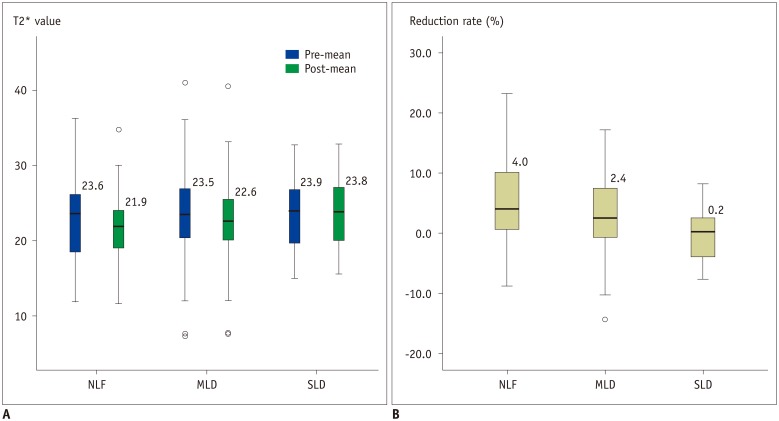
Fig. 3 Pre- and post-contrast T2* values (A) and reduction rates (B) in each group were visualized through box-plot.Dark line in middle of boxes denotes median T2* value, bottom of box indicates 25th percentile, and top of box indicates 75th percentile. Circle denotes outliers that are farther than 1.5 interquartile ranges, yet closer than 3 interquartile ranges, while star denotes extreme outliers that are greater than 3 interquartile ranges. MLD = mild liver disease, NLF = normal liver function, SLD = severe liver disease
Cited by 3 articles
-
Age of Data in Contemporary Research Articles Published in Representative General Radiology Journals
Ji Hun Kang, Dong Hwan Kim, Seong Ho Park, Jung Hwan Baek
Korean J Radiol. 2018;19(6):1172-1178. doi: 10.3348/kjr.2018.19.6.1172.The Diagnostic Performance of Liver MRI without Intravenous Contrast for Detecting Hepatocellular Carcinoma: A Case-Controlled Feasibility Study
Seunghee Han, Joon-Il Choi, Michael Yong Park, Moon Hyung Choi, Sung Eun Rha, Young Joon Lee
Korean J Radiol. 2018;19(4):568-577. doi: 10.3348/kjr.2018.19.4.568.Correlation between Non-Alcoholic Fatty Liver Disease and Visceral Adipose Tissue in Non-Obese Chinese Adults: A CT Evaluation
Ai-Hong Yu, Yang-Yang Duan-Mu, Yong Zhang, Ling Wang, Zhe Guo, Yong-Qiang Yu, Yu-Sheng Wang, Xiao-Guang Cheng
Korean J Radiol. 2018;19(5):923-929. doi: 10.3348/kjr.2018.19.5.923.
Reference
-
1. Chang ML. Metabolic alterations and hepatitis C: from bench to bedside. World J Gastroenterol. 2016; 22:1461–1476. PMID: 26819514.
Article2. Heidelbaugh JJ, Bruderly M. Cirrhosis and chronic liver failure: part I. Diagnosis and evaluation. Am Fam Physician. 2006; 74:756–762. PMID: 16970019.3. Park BJ, Lee YJ, Lee HR. Chronic liver inflammation: clinical implications beyond alcoholic liver disease. World J Gastroenterol. 2014; 20:2168–2175. PMID: 24605015.
Article4. Friedman SL. Liver fibrosis--from bench to bedside. J Hepatol. 2003; 38(Suppl 1):S38–S53. PMID: 12591185.5. Dietrich CG, Götze O, Geier A. Molecular changes in hepatic metabolism and transport in cirrhosis and their functional importance. World J Gastroenterol. 2016; 22:72–88. PMID: 26755861.
Article6. Starr SP, Raines D. Cirrhosis: diagnosis, management, and prevention. Am Fam Physician. 2011; 84:1353–1359. PMID: 22230269.7. Bruix J, Sherman M. American Association for the Study of Liver Diseases. Management of hepatocellular carcinoma: an update. Hepatology. 2011; 53:1020–1022. PMID: 21374666.
Article8. Korean Liver Cancer Study Group (KLCSG). National Cancer Center, Korea (NCC). 2014 Korean Liver Cancer Study Group-National Cancer Center Korea practice guideline for the management of hepatocellular carcinoma. Korean J Radiol. 2015; 16:465–522. PMID: 25995680.9. Yoon JH, Park JW, Lee JM. Noninvasive diagnosis of hepatocellular carcinoma: elaboration on Korean Liver Cancer Study Group-National Cancer Center Korea Practice guidelines compared with other guidelines and remaining issues. Korean J Radiol. 2016; 17:7–24. PMID: 26798212.
Article10. Matteoni CA, Younossi ZM, Gramlich T, Boparai N, Liu YC, McCullough AJ. Nonalcoholic fatty liver disease: a spectrum of clinical and pathological severity. Gastroenterology. 1999; 116:1413–1419. PMID: 10348825.11. Kwon AH, Ha-Kawa SK, Uetsuji S, Inoue T, Matsui Y, Kamiyama Y. Preoperative determination of the surgical procedure for hepatectomy using technetium-99m-galactosyl human serum albumin (99mTc-GSA) liver scintigraphy. Hepatology. 1997; 25:426–429. PMID: 9021958.
Article12. Dinant S, de Graaf W, Verwer BJ, Bennink RJ, van Lienden KP, Gouma DJ, et al. Risk assessment of posthepatectomy liver failure using hepatobiliary scintigraphy and CT volumetry. J Nucl Med. 2007; 48:685–692. PMID: 17475954.
Article13. de Graaf W, van Lienden KP, van Gulik TM, Bennink RJ. (99m) Tc-mebrofenin hepatobiliary scintigraphy with SPECT for the assessment of hepatic function and liver functional volume before partial hepatectomy. J Nucl Med. 2010; 51:229–236. PMID: 20080899.14. Ge PL, Du SD, Mao YL. Advances in preoperative assessment of liver function. Hepatobiliary Pancreat Dis Int. 2014; 13:361–370. PMID: 25100120.
Article15. Haimerl M, Verloh N, Fellner C, Zeman F, Teufel A, Fichtner-Feigl S, et al. MRI-based estimation of liver function: Gd-EOB-DTPA-enhanced T1 relaxometry of 3T vs. the MELD score. Sci Rep. 2014; 4:5621. PMID: 25001391.
Article16. Kudo M. Will Gd-EOB-MRI change the diagnostic algorithm in hepatocellular carcinoma? Oncology. 2010; 78(Suppl 1):87–93.
Article17. Inoue T, Kudo M, Komuta M, Hayaishi S, Ueda T, Takita M, et al. Assessment of Gd-EOB-DTPA-enhanced MRI for HCC and dysplastic nodules and comparison of detection sensitivity versus MDCT. J Gastroenterol. 2012; 47:1036–1047. PMID: 22526270.
Article18. Ahn SS, Kim MJ, Lim JS, Hong HS, Chung YE, Choi JY. Added value of gadoxetic acid-enhanced hepatobiliary phase MR imaging in the diagnosis of hepatocellular carcinoma. Radiology. 2010; 255:459–466. PMID: 20413759.
Article19. Frydrychowicz A, Lubner MG, Brown JJ, Merkle EM, Nagle SK, Rofsky NM, et al. Hepatobiliary MR imaging with gadolinium-based contrast agents. J Magn Reson Imaging. 2012; 35:492–511. PMID: 22334493.
Article20. Lee YJ, Lee JM, Lee JS, Lee HY, Park BH, Kim YH, et al. Hepatocellular carcinoma: diagnostic performance of multidetector CT and MR imaging-a systematic review and meta-analysis. Radiology. 2015; 275:97–109. PMID: 25559230.
Article21. Tsuda N, Okada M, Murakami T. Potential of gadolinium-ethoxybenzyl-diethylenetriamine pentaacetic acid (Gd-EOB-DTPA) for differential diagnosis of nonalcoholic steatohepatitis and fatty liver in rats using magnetic resonance imaging. Invest Radiol. 2007; 42:242–247. PMID: 17351431.
Article22. Shimizu J, Dono K, Gotoh M, Hasuike Y, Kim T, Murakami T, et al. Evaluation of regional liver function by gadolinium-EOB-DTPA-enhanced MR imaging. Dig Dis Sci. 1999; 44:1330–1337. PMID: 10489914.23. Schmitz SA, Mühler A, Wagner S, Wolf KJ. Functional hepatobiliary imaging with gadolinium-EOB-DTPA. A comparison of magnetic resonance imaging and 153gadolinium-EOB-DTPA scintigraphy in rats. Invest Radiol. 1996; 31:154–160. PMID: 8675423.24. Yoon JH, Lee JM, Paek M, Han JK, Choi BI. Quantitative assessment of hepatic function: modified look-locker inversion recovery (MOLLI) sequence for T1 mapping on Gd-EOB-DTPA-enhanced liver MR imaging. Eur Radiol. 2016; 26:1775–1782. PMID: 26373756.
Article25. Kim JY, Lee SS, Byun JH, Kim SY, Park SH, Shin YM, et al. Biologic factors affecting HCC conspicuity in hepatobiliary phase imaging with liver-specific contrast agents. AJR Am J Roentgenol. 2013; 201:322–331. PMID: 23883212.
Article26. Bae KE, Kim SY, Lee SS, Kim KW, Won HJ, Shin YM, et al. Assessment of hepatic function with Gd-EOB-DTPA-enhanced hepatic MRI. Dig Dis. 2012; 30:617–622. PMID: 23258104.
Article27. Storey P, Thompson AA, Carqueville CL, Wood JC, de Freitas RA, Rigsby CK. R2* imaging of transfusional iron burden at 3T and comparison with 1.5T. J Magn Reson Imaging. 2007; 25:540–547. PMID: 17326089.28. Tang A, Tan J, Sun M, Hamilton G, Bydder M, Wolfson T, et al. Nonalcoholic fatty liver disease: MR imaging of liver proton density fat fraction to assess hepatic steatosis. Radiology. 2013; 267:422–431. PMID: 23382291.
Article29. Bannas P, Kramer H, Hernando D, Agni R, Cunningham AM, Mandal R, et al. Quantitative magnetic resonance imaging of hepatic steatosis: validation in ex vivo human livers. Hepatology. 2015; 62:1444–1455. PMID: 26224591.30. Hernando D, Wells SA, Vigen KK, Reeder SB. Effect of hepatocyte-specific gadolinium-based contrast agents on hepatic fat-fraction and R2(*). Magn Reson Imaging. 2015; 33:43–50. PMID: 25305414.31. Meisamy S, Hines CD, Hamilton G, Sirlin CB, McKenzie CA, Yu H, et al. Quantification of hepatic steatosis with T1-independent, T2-corrected MR imaging with spectral modeling of fat: blinded comparison with MR spectroscopy. Radiology. 2011; 258:767–775. PMID: 21248233.
Article32. Hines CD, Frydrychowicz A, Hamilton G, Tudorascu DL, Vigen KK, Yu H, et al. T(1) independent, T(2) (*) corrected chemical shift based fat-water separation with multi-peak fat spectral modeling is an accurate and precise measure of hepatic steatosis. J Magn Reson Imaging. 2011; 33:873–881. PMID: 21448952.33. Yu H, McKenzie CA, Shimakawa A, Vu AT, Brau AC, Beatty PJ, et al. Multiecho reconstruction for simultaneous water-fat decomposition and T2* estimation. J Magn Reson Imaging. 2007; 26:1153–1161. PMID: 17896369.34. Alústiza Echeverría JM, Castiella A, Emparanza JI. Quantification of iron concentration in the liver by MRI. Insights Imaging. 2012; 3:173–180. PMID: 22696043.
Article35. Garcia-Tsao G, Lim JK. Members of Veterans Affairs Hepatitis C Resource Center Program. Management and treatment of patients with cirrhosis and portal hypertension: recommendations from the Department of Veterans Affairs Hepatitis C Resource Center Program and the National Hepatitis C Program. Am J Gastroenterol. 2009; 104:1802–1829. PMID: 19455106.
Article36. Eggers H, Brendel B, Duijndam A, Herigault G. Dual-echo Dixon imaging with flexible choice of echo times. Magn Reson Med. 2011; 65:96–107. PMID: 20860006.
Article37. Kukuk GM, Hittatiya K, Sprinkart AM, Eggers H, Gieseke J, Block W, et al. Comparison between modified Dixon MRI techniques, MR spectroscopic relaxometry, and different histologic quantification methods in the assessment of hepatic steatosis. Eur Radiol. 2015; 25:2869–2879. PMID: 25903702.
Article38. Katsube T, Okada M, Kumano S, Imaoka I, Kagawa Y, Hori M, et al. Estimation of liver function using T2* mapping on gadolinium ethoxybenzyl diethylenetriamine pentaacetic acid enhanced magnetic resonance imaging. Eur J Radiol. 2012; 81:1460–1464. PMID: 21514080.39. Motosugi U, Ichikawa T, Sou H, Sano K, Tominaga L, Kitamura T, et al. Liver parenchymal enhancement of hepatocyte-phase images in Gd-EOB-DTPA-enhanced MR imaging: which biological markers of the liver function affect the enhancement? J Magn Reson Imaging. 2009; 30:1042–1046. PMID: 19856436.
Article40. Besa C, Bane O, Jajamovich G, Marchione J, Taouli B. 3D T1 relaxometry pre and post gadoxetic acid injection for the assessment of liver cirrhosis and liver function. Magn Reson Imaging. 2015; 33:1075–1082. PMID: 26119422.
Article41. Nilsson H, Blomqvist L, Douglas L, Nordell A, Janczewska I, Näslund E, et al. Gd-EOB-DTPA-enhanced MRI for the assessment of liver function and volume in liver cirrhosis. Br J Radiol. 2013; 86:20120653. PMID: 23403453.
Article42. Ding Y, Rao SX, Meng T, Chen C, Li R, Zeng MS. Usefulness of T1 mapping on Gd-EOB-DTPA-enhanced MR imaging in assessment of non-alcoholic fatty liver disease. Eur Radiol. 2014; 24:959–966. PMID: 24463697.
Article43. Haimerl M, Schlabeck M, Verloh N, Zeman F, Fellner C, Nickel D, et al. Volume-assisted estimation of liver function based on Gd-EOB-DTPA-enhanced MR relaxometry. Eur Radiol. 2016; 26:1125–1133. PMID: 26186960.
Article44. Kamimura K, Fukukura Y, Yoneyama T, Takumi K, Tateyama A, Umanodan A, et al. Quantitative evaluation of liver function with T1 relaxation time index on Gd-EOB-DTPA-enhanced MRI: comparison with signal intensity-based indices. J Magn Reson Imaging. 2014; 40:884–889. PMID: 24677659.
Article45. Stikov N, Boudreau M, Levesque IR, Tardif CL, Barral JK, Pike GB. On the accuracy of T1 mapping: searching for common ground. Magn Reson Med. 2015; 73:514–522. PMID: 24578189.
- Full Text Links
-
- Actions
-
Cited
- CITED
-
- Close
- Share
-
- Similar articles
-
- Hepatic Angiomyolipoma Presenting as a Hyperintense Lesion During the Hepatobiliary Phase of Gadoxetic Acid Enhanced-MRI: a Case Report
- Effect of Gadoxetic Acid on Quantification of Hepatic Steatosis Using Magnetic Resonance Spectroscopy: A Prospective Study
- Non-invasive quantification of hepatic fat content in healthy dogs by using proton magnetic resonance spectroscopy and dual gradient echo magnetic resonance imaging
- Comparison of Multi-Echo Dixon Methods with Volume Interpolated Breath-Hold Gradient Echo Magnetic Resonance Imaging in Fat-Signal Fraction Quantification of Paravertebral Muscle
- Focal Liver Lesion Detection in Gadoxetic Acid-enhanced Liver MRI: Effects of Scan Delay, Hepatic Function, and Magnetic Field Strength
