Prog Med Phys.
2017 Sep;28(3):77-82. 10.14316/pmp.2017.28.3.77.
SPECT Image Analysis Using Computational ROC Curve Based on Threshold Setup
- Affiliations
-
- 1Department of Biomedical Engineering and Research Institute of Biomedical Engineering, College of Medicine, The Catholic University of Korea, Seoul, Korea. suhsanta@catholic.ac.kr, dbsehrns@naver.com
- 2Department of Radiologic Technology Daegu Health College, Daegu, Korea.
- KMID: 2393367
- DOI: http://doi.org/10.14316/pmp.2017.28.3.77
Abstract
- We proposed the objective ROC analysis method based on the setting of threshold value for evaluation of single photon emission computed tomography (SPECT) image. This proposed ROC analysis method uses the quantification computational threshold value to each signal on the SPECT image. The SPECT images for this study were acquired by using Monte Carlo n-particle extended simulation code (MCNPX, Ver. 2.6.0, Los Alamos National Laboratory, USA). The basic SPECT detectors and specific water phantom were realized in the simulation, and we could get the simulation results by the simulation operation. We tried to analyze the reconstructed images using threshold value application based objective ROC method. We can get the accuracy information of reconstructed region in the image. This proposed ROC technique can be helpful when we have to evaluate the weak signal for the NM image. In this study, the proposed threshold value based computational ROC analysis method can provide better objectivity than the conventional ROC analysis method.
Keyword
Figure
-
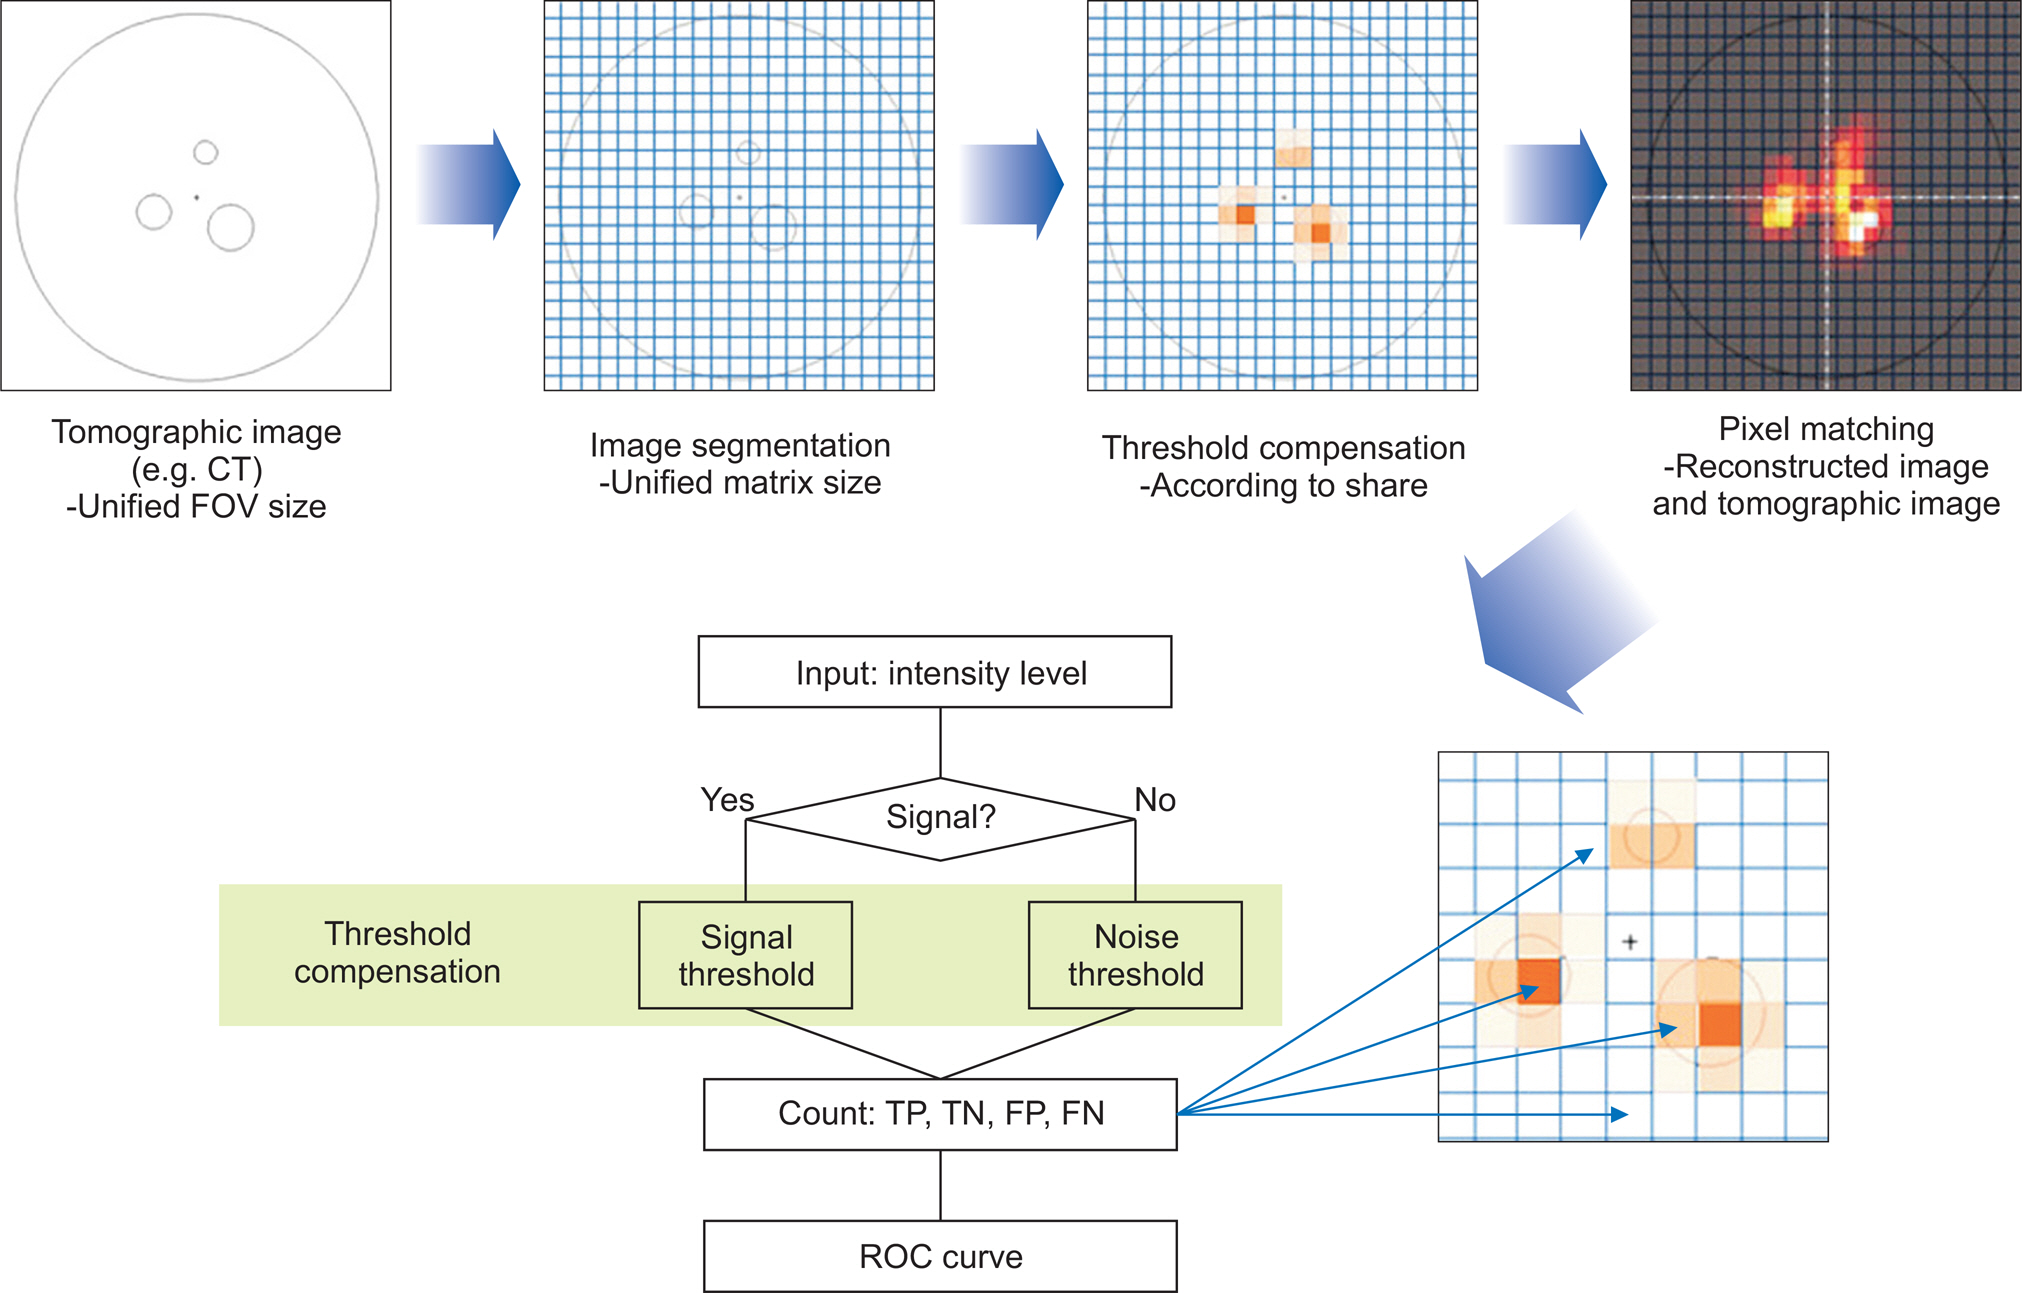
Fig. 1. Diagram of the threshold value based receiver operation characteristic (ROC) analysis method.
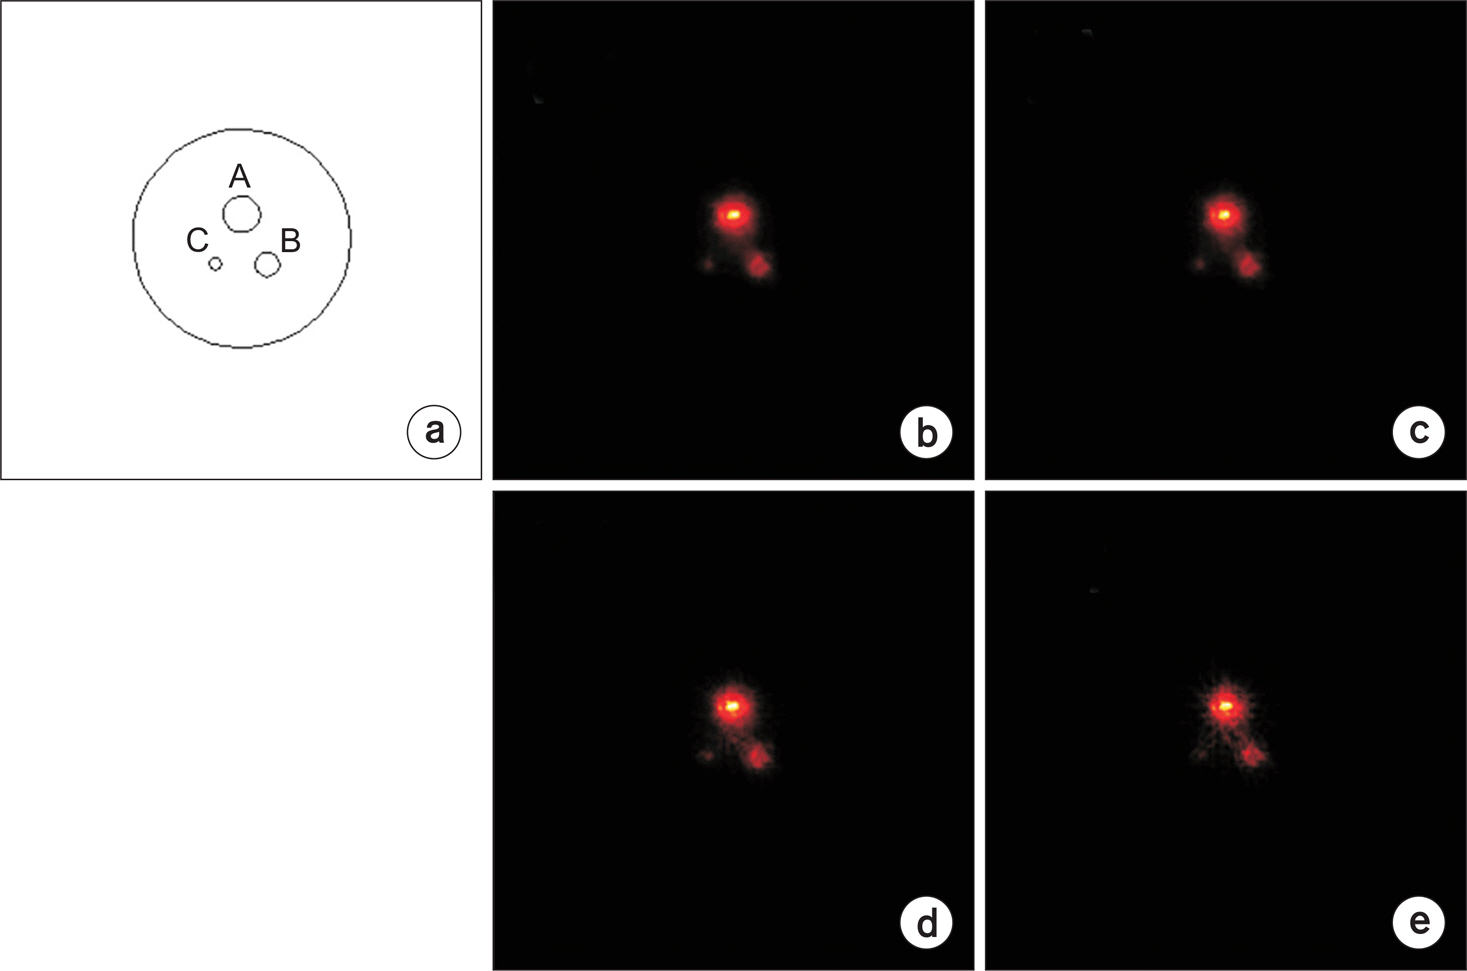
Fig. 2. Original water pattern of the single photon emission computed tomography (SPECT) phantom with three radioisotope uptake regions (RURs) (a). Reconstructed tomographic image using the graphic processing unit (GPU) based fast iterative reconstruction algorithm with (b) 128, (c) 64, (d) 32, and (e) 16 projections.
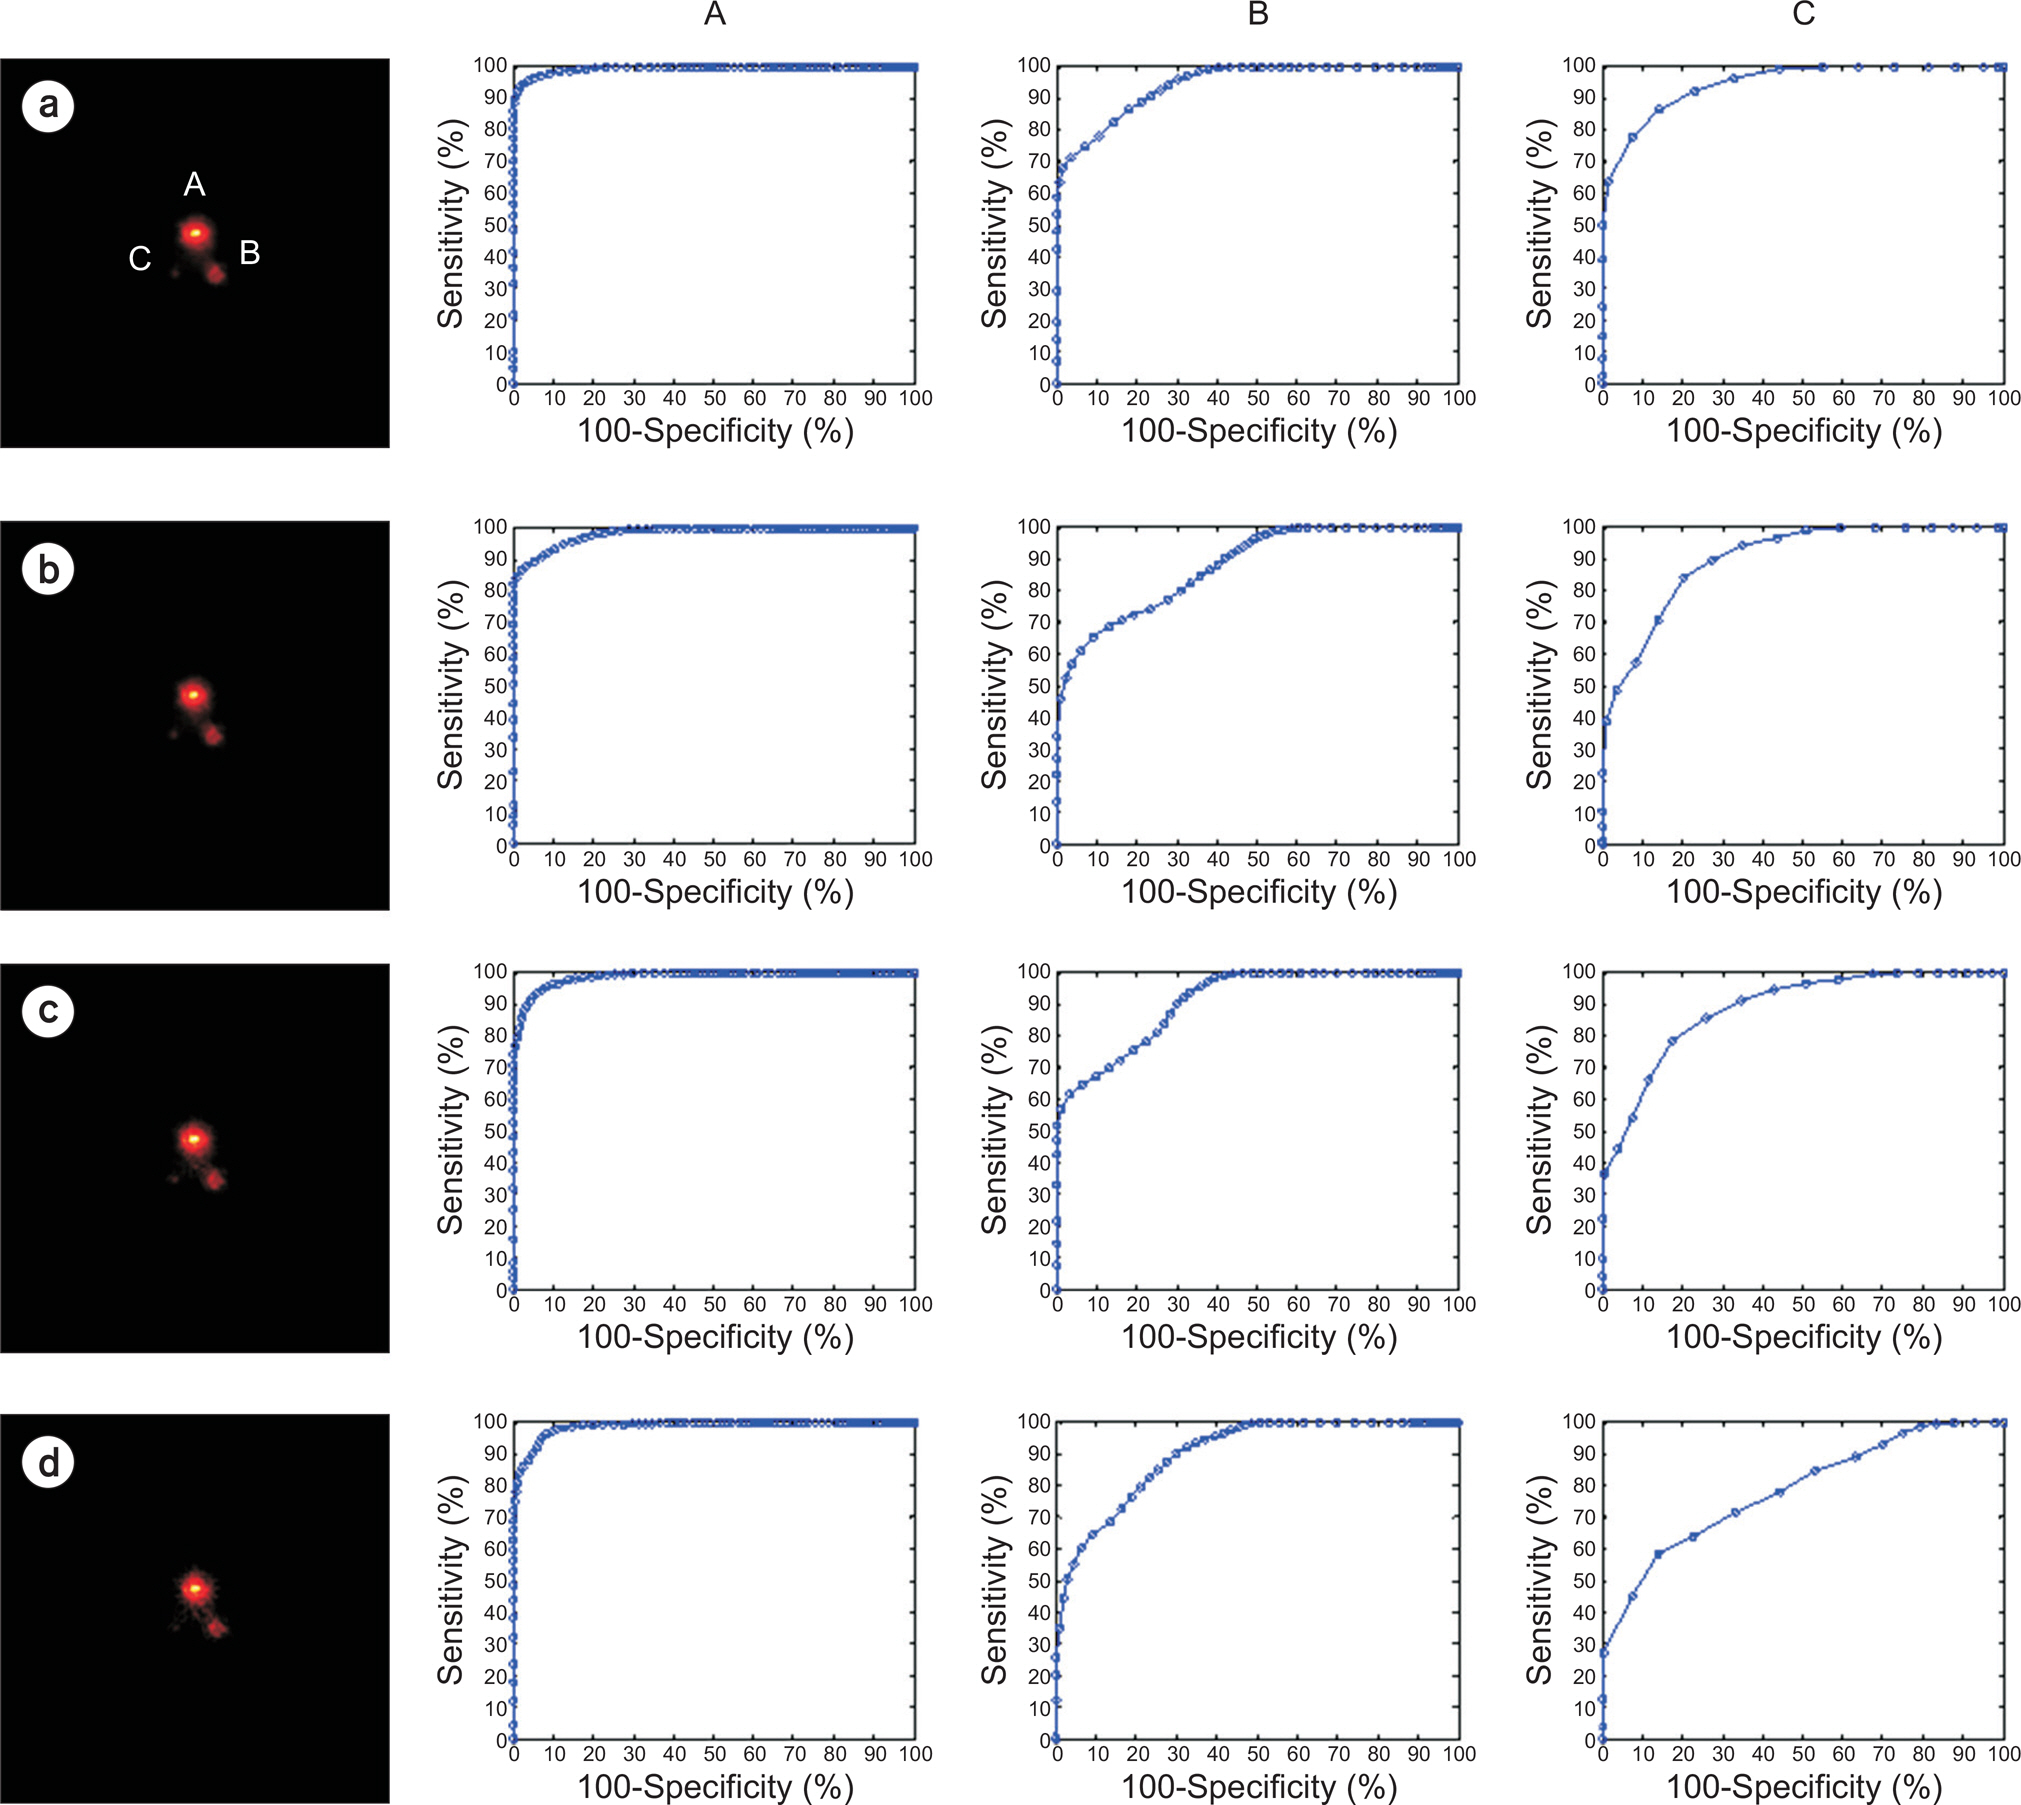
Fig. 3. Results of threshold value based receiver operation characteristic (ROC) analysis method for the reconstructed images. (a), (b), (c), and (d) is the reconstructed images using 128, 64, 32, and 16 projection data, respectively. A, B and C is the results the threshold value based ROC analysis method.
Reference
-
1. Mazess R. B., Wahner H. M.Nuclear medicine and densitometry. Osteoporosis. 1988.2. Conway J. J., Maizels M.The"well tempered" diuretic renogram: a standard method to examine the asymptomatic neonate with hydronephrosis or hydroureteronephrosis. A report from combined meetings of The Society for Fetal Urology and members of The Pediatric Nuclear Medicine Council–The Society of Nuclear Medicine. Journal of nuclear medicine: official publication, Society of Nuclear Medicine. 1992; 33:2047–2051.3. Gabriela C., Chianelli M., Signore A.Nuclear medicine imaging of diabetic foot infection: results of metaanalysis. Nuclear medicine communications. 2006; 27:757–764.4. Kitagawa H., Farman A. G., Wakoh M., et al. Objective and subjective assessments of Kodak Ektaspeed plus new dental X-ray film: a comparison with other conventional X-ray films. The Bulletin of Tokyo Dental College. 1955; 36:61–67.5. Ojima Y., Tsujikawa A., Hangai M., et al. Retinal sensitivity measured with the micro perimeter 1 after resolution of central serous chorioretinopathy. American journal of ophthalmology. 2008; 146:77–84.6. Eng J.Receiver operating characteristic analysis. Academic radiology. 2005; 12:909–916.
Article7. Greiner M., Dirk P., Smith R. D.Principles and practical application of the receiver-operating characteristic analysis for diagnostic tests. Preventive veterinary medicine. 2000; 45:23–41.
Article8. Zou K. H., O'Malley A. J., Mauri L.Receiver-operating characteristic analysis for evaluating diagnostic tests and predictive models. Circulation. 2007; 115:654–657.
Article9. Peterson A. T., Papeş M., Soberón J.Rethinking receiver operating characteristic analysis applications in ecological niche modeling. Ecological modelling. 2008; 213:63–72.
Article10. Yoon DK, Jung JY, Jo Hong K, et al. GPU‐based prompt gamma ray imaging from boron neutron capture therapy. Medical physics. 2015; 42:165–169.
Article11. Yoon D-K, Jung J-Y, Jo Hong K, et al. Tomographic image of prompt gamma ray from boron neutron capture therapy: A Monte Carlo simulation study. Applied Physics Letters. 2014; 104:083521.
Article12. Shin HB, Yoon DK, Jung JY, et al. Prompt gamma ray imaging for verification of proton boron fusion therapy: A Monte Carlo study. Physica medica. 2016; 32:1271–1275.
Article
- Full Text Links
-
- Actions
-
Cited
- CITED
-
- Close
- Share
-
- Similar articles
-
- Threshold for Positivity and Optimal Dipyrone Concentration in Flow Cytometry-Assisted Basophil Activation Test
- A Study on the Diagnostic Detection Ability of the Artificial Proximal Caries by Digora(R)
- Drawing Guidelines for Receiver Operating Characteristic Curve in Preparation of Manuscripts
- Diagnostic Accuracy of Quantitative Scintimammography Using Tc-99m MIBI According to ROC Curve Analysis for Breast Cancer
- Receiver Operating Characteristic (ROC) Curve: Practical Review for Radiologists
