Development of a Novel Quality Improvement Indicator Based on the Hemolysis Index
- Affiliations
-
- 1Department of Laboratory Medicine, Hallym University College of Medicine, Anyang, Korea. kangheejung@hallym.ac.kr
- KMID: 2373600
- DOI: http://doi.org/10.3343/alm.2016.36.6.599
Abstract
- Hemolysis frequently causes preanalytical errors in laboratory measurements. We aimed to develop a quality improvement indicator for evaluating the extent of inappropriate procedures causing hemolysis in clinical samples collected in medical care units. We defined the threshold value of the hemolysis index (H index) causing significant interference with analyte measurement and analyzed the H index values of clinical samples in relation to the threshold. The H index threshold value causing a 10% bias in the measurement of lactate dehydrogenase was found to be 25. The monthly mean H index and monthly frequency of samples with an H index >25 were significantly different among the types of ward (P=0.001, respectively), and significantly decreased after replacement of a laboratory centrifuge lacking temperature control (20.6±0.58 vs 23.30±1.08, P=0.01; 23.4±1.69% vs 32.6±1.78%, P=0.01). The monthly mean H index and the monthly frequency of samples with an H index above a threshold value may be useful quality improvement indicators for detection of inappropriate procedures in the acquisition and handling of blood samples in medical care units.
MeSH Terms
Figure
-
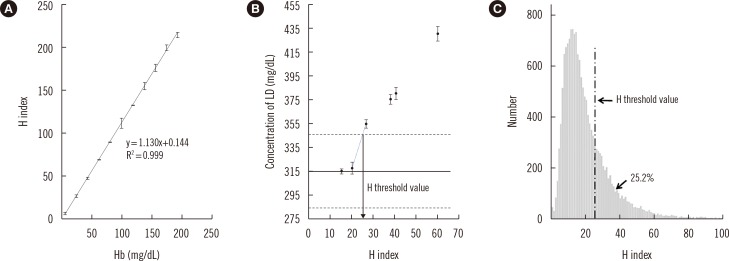
Fig. 1 Correlation between the H index and Hb concentration (A). Interference with the measurement of LD caused by increased hemolysis in a sample (B). The solid line represents the original concentration of LD, and the dotted lines denote a 10% difference from the original level. The H index value of 25 was expected to cause a 10% bias in the measurement. The distribution of H index values among all the requested routine chemistry samples in a given month (C). The proportion of samples with an H index >25 was 25.2%.Abbreviations: H index, hemolysis index; LD, lactate dehydrogenase.
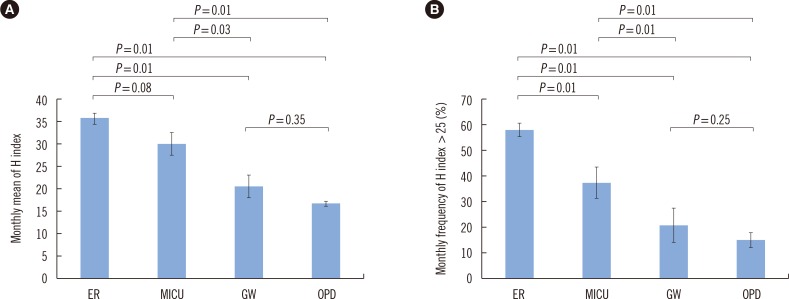
Fig. 2 The monthly mean H index (A) and the monthly frequency of samples with an H index over 25 (B) by the type of ward. The data are presented as the mean±SD of monthly values during six months (from January to June 2015). The differences within each pair of groups were analyzed by the Mann-Whitney U test.Abbreviations: H index, hemolysis index; ER, emergency room; MICU, medical intensive care unit; GW, general ward; OPD, outpatient department.
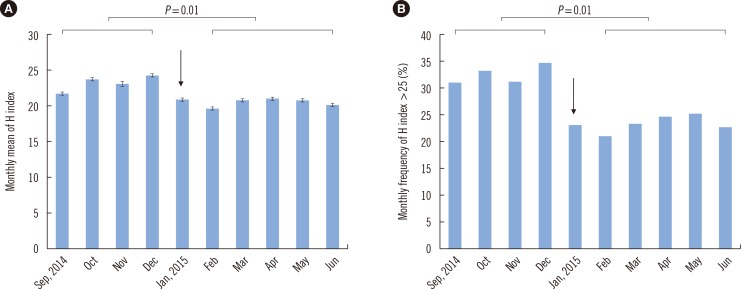
Fig. 3 The monthly mean H index (A) and the monthly frequency of samples with an H index over 25 (B) before and after replacement of a centrifuge lacking temperature control in a clinical laboratory (January 9, 2015, indicated with an arrow). Differences in the monthly mean H index or monthly frequency of samples with an H index over 25 before (from September to December 2014) and after centrifuge replacement (from February to June 2015) were analyzed by the Mann-Whitney U test.Abbreviation: H index, hemolysis index.
Reference
-
1. Blank DW, Kroll MH, Ruddel ME, Elin RJ. Hemoglobin interference from in vivo hemolysis. Clin Chem. 1985; 31:1566–1569. PMID: 4028407.2. Van Lente F, Marchand A, Galen RS. Evaluation of a nephelometric assay for haptoglobin and its clinical usefulness. Clin Chem. 1979; 25:2007–2010. PMID: 116779.3. Witte DL, Brown LF, Feld RD. Effects of bilirubin on detection of hydrogen peroxide by use of peroxidase. Clin Chem. 1978; 24:1778–1782. PMID: 699289.4. Spain MA, Wu AH. Bilirubin interference with determination of uric acid, cholesterol, and triglycerides in commercial peroxidase-coupled assays, and the effect of ferrocyanide. Clin Chem. 1986; 32:518–521. PMID: 3948397.5. Kroll MH. Evaluating interference caused by lipemia. Clin Chem. 2004; 50:1968–1969. PMID: 15502078.6. Bornhorst JA, Roberts RF, Roberts WL. Assay-specific differences in lipemic interference in native and intralipid-supplemented samples. Clin Chem. 2004; 50:2197–2201. PMID: 15375017.7. Aw TC. Pseudohyponatremia. Am J Emerg Med. 1985; 3:236–239. PMID: 3994801.8. Lippi G, Blanckaert N, Bonini P, Green S, Kitchen S, Palicka V, et al. Haemolysis: an overview of the leading cause of unsuitable specimens in clinical laboratories. Clin Chem Lab Med. 2008; 46:764–772. PMID: 18601596.9. Shin DH, Kim J, Uh Y, Lee SI, Seo DM, Kim KS, et al. Development of an integrated reporting system for verifying hemolysis, icterus, and lipemia in clinical chemistry results. Ann Lab Med. 2014; 34:307–312. PMID: 24982836.10. Clinical Laboratory and Standards Institute. Hemolysis, icterus, and lipemia/turbidity indices as indicators of interference in clinical laboratory analysis; approved guideline, C56-A. Wayne, PA: Clinical Laboratory and Standards Institute;2012.11. Roche Diagnostics. Serum indices: Reduction of clinical errors in laboratory medicine. Updated on July 2012. http://www.rochediagnostics.cz/download/program/Serum%20Indices_maly.pdf.12. Shahangian S, Snyder SR. Laboratory medicine quality indicators: a review of the literature. Am J Clin Pathol. 2009; 131:418–431. PMID: 19228647.
- Full Text Links
-
- Actions
-
Cited
- CITED
-
- Close
- Share
-
- Similar articles
-
- Mathematical Correction of Hemolysis Interference with Hemolysis Index
- Quality of Care in Inflammatory Bowel Disease
- Hemolytic Interference on Blood Gas Analysis
- PARK Index and S-score Can Be Good Quality Indicators for the Preventable Mortality in a Single Trauma Center
- Problems and Policy Recommendation for Clinical Indicator Evaluation
