Development and Validation of Web-Based Nomograms to Predict Postoperative Invasive Component in Ductal Carcinoma in Situ at Needle Breast Biopsy
- Affiliations
-
- 1Department of Surgery, Dankook University College of Medicine, Cheonan, Korea. changmc@dankook.ac.kr
- KMID: 2284575
- DOI: http://doi.org/10.4258/hir.2014.20.2.152
Abstract
OBJECTIVES
Although sonography-guided core needle biopsy is a highly targeted method, there is a possibility of an invasive component after surgical excision of ductal carcinoma in situ (DCIS) of the breast. This study was performed to develop and validate nomograms to predict the postoperative invasive component in DCIS at core needle biopsy.
METHODS
Two nomograms were developed using the data of previous meta-analysis and multivariate analysis. Nomograms were validated externally using the data of the authors' affiliation. The accuracy was validated by the expected-to-observed ratio and the Hosmer-Lemeshow goodness-of-fit test. Discrimination was validated by the area under the curve (AUC) of receiver operating characteristic (ROC) curve analysis.
RESULTS
The nomogram using the meta-analysis study data was developed at http://dcis-m.surgery.kr.pe/, and the nomogram using the multivariate analysis study data was developed at http://dcis-k.surgery.kr.pe/. The Hosmer-Lemeshow goodness-of-fit test showed that the nomogram using multivariate analysis data (p = 0.131) was better calibrated than that using meta-analysis data (p < 0.001). ROC curve analysis showed statistically significant power of discrimination in both nomograms (AUC = 0.776, 0.751).
CONCLUSIONS
Both nomograms showed statistically significant discriminatory power, but the nomogram using the data of multivariate analysis was simpler and more reliable. These would be useful for the prediction of invasive cancer and the need for sentinel node biopsy in DCIS at core needle biopsy.
MeSH Terms
Figure
-

Figure 1 Hosmer-Lemeshow goodness-of-fit test of nomogram from the meta-analysis data (p < 0.001). Expected number of invasive cancer patients, observed number of invasive cancer patients, and the corresponding number of total patients per decile are shown.
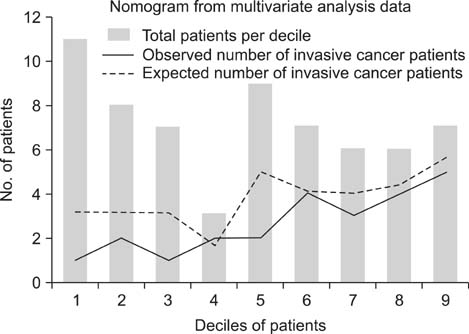
Figure 2 Hosmer-Lemeshow goodness-of-fit test of nomogram from the multivariate analysis data (p = 0.131). Expected number of invasive cancer patients, observed number of invasive cancer patients and the corresponding number of total patients per decile are shown.
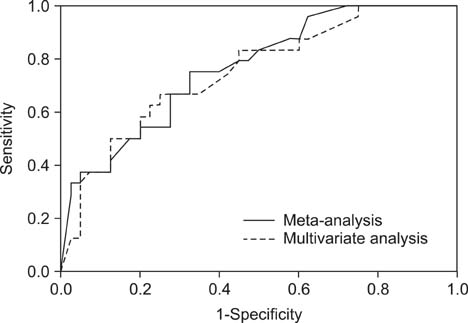
Figure 3 Receiver operating characteristic curves of nomograms from the meta-analysis data and multivariate analysis data. The area under curve is 0.766 (p < 0.001) for the meta-analysis data and 0.751 (p = 0.001) for the multivariate analysis data. The curves show no differences (p = 0.614).
Reference
-
1. Brennan ME, Turner RM, Ciatto S, Marinovich ML, French JR, Macaskill P, et al. Ductal carcinoma in situ at core-needle biopsy: meta-analysis of underestimation and predictors of invasive breast cancer. Radiology. 2011; 260(1):119–128.
Article2. Kim J, Han W, Lee JW, You JM, Shin HC, Ahn SK, et al. Factors associated with upstaging from ductal carcinoma in situ following core needle biopsy to invasive cancer in subsequent surgical excision. Breast. 2012; 21(5):641–645.
Article3. Iasonos A, Schrag D, Raj GV, Panageas KS. How to build and interpret a nomogram for cancer prognosis. J Clin Oncol. 2008; 26(8):1364–1370.
Article4. Kim SH, Chae YS, Son WJ, Shin DJ, Kim YM, Chang MC. Estimation of individualized probabilities of developing breast cancer for Korean women. J Korean Surg Soc. 2008; 74(6):405–411.
- Full Text Links
-
- Actions
-
Cited
- CITED
-
- Close
- Share
-
- Similar articles
-
- Predictive Factors of Residual Invasive Breast Cancer after Core Biopsy for Ductal Carcinoma in Situ
- Risk Factor of Invasive Breast Cancer in Patients with Preoperative Diagnosis of Ductal Carcinoma in Situ
- Invasive Lobular Carcinoma of the Breast Associated with Mixed Lobular and Ductal Carcinoma In Situ: A Case Report
- Invasive Ductal Carcinoma Within a Borderline Phyllodes Tumor Associated With Extensive Ductal Carcinoma In Situ: A Case Report
- An Unusual Presentation of Extensive Ductal Carcinoma in Situ Accompanying Invasive Ductal Carcinoma on MRI: A Case Report
