J Korean Ophthalmol Soc.
2013 Nov;54(11):1748-1756. 10.3341/jkos.2013.54.11.1748.
Analysis of Peripapillary Atrophy According to the Optic Disc Shape Using Spectral Domain OCT
- Affiliations
-
- 1Department of Ophthalmology and Visual Science, Yeouido St. Mary's Hospital, The Catholic University of Korea College of Medicine, Seoul, Korea. marypark@catholic.ac.kr
- KMID: 2217923
- DOI: http://doi.org/10.3341/jkos.2013.54.11.1748
Abstract
- PURPOSE
To analyze the structural changes in the beta-zone of peripapillary atrophy (PPA-beta) using cross-sectional image of the optic disc head from spectral-domain optical coherence tomography (SD-OCT) according to the optic disc shape.
METHODS
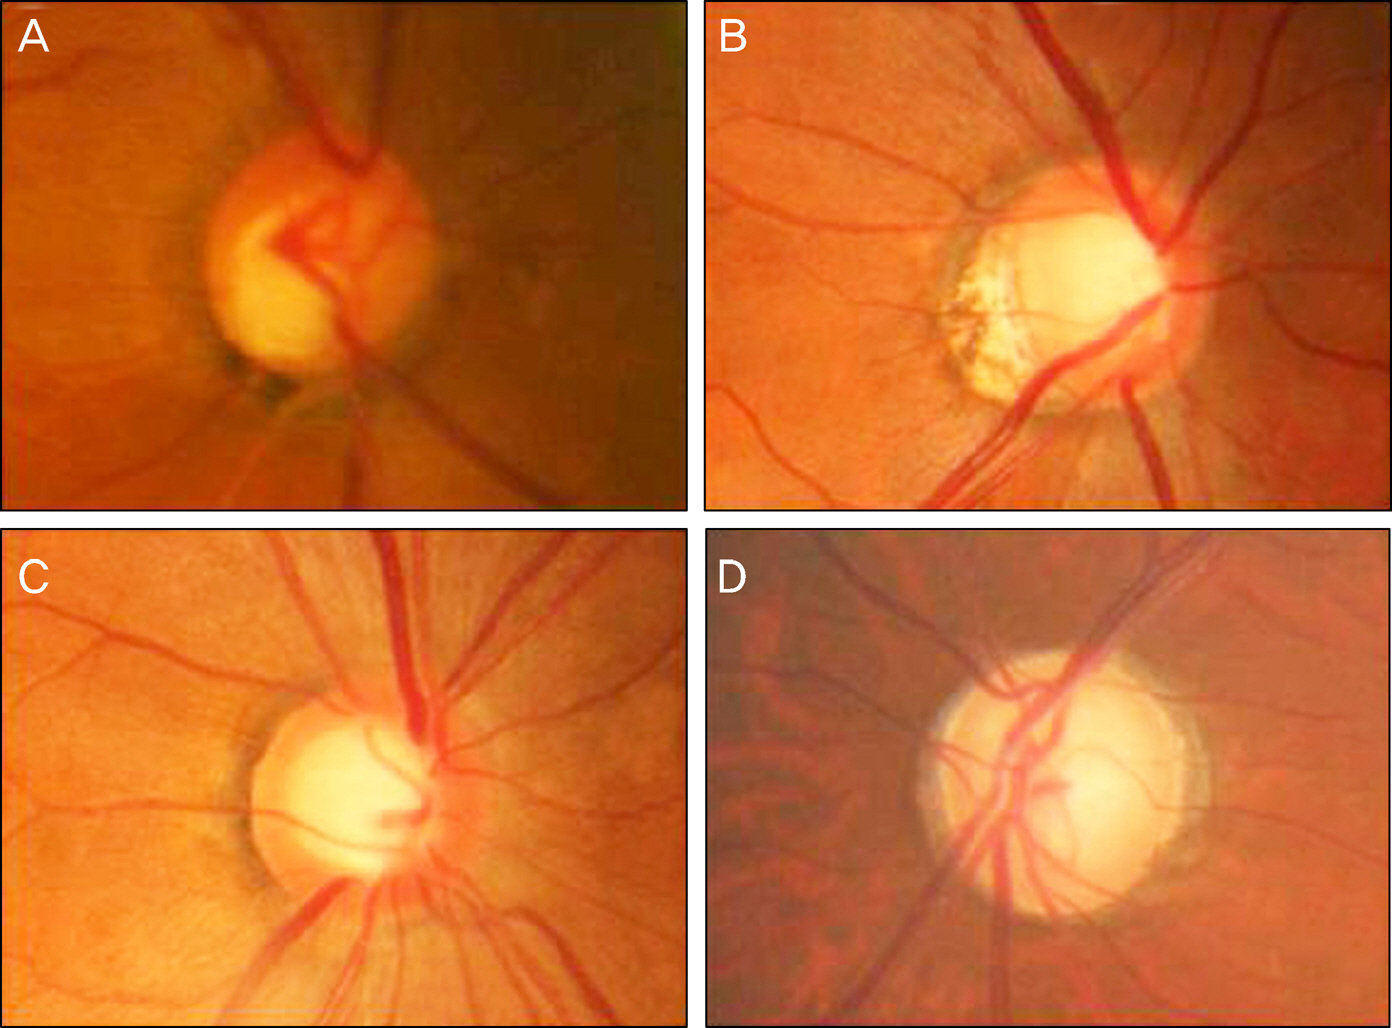
One hundred thirty-seven eyes in 137 patients with glaucoma having PPA-beta and 31 normal eyes (control group) were evaluated retrospectively. Cross-sectional images of the optic disc were taken using the Cirrus HD-OCT. We classified optic disc patterns into normal, focal, myopic, generalized enlargement and senile sclerotic appearance types and analyzed the shape of Bruch's membrane (BM), composition of retinal layer and retinal slope according to the optic disc shape.
RESULTS
Among the 137 eyes with glaucoma, 54 eyes were focal disc type, 34 eyes were myopic disc type, 28 eyes were generalized enlargement disc type and 21 eyes were senile sclerotic disc type. The myopic disc group showed a noticeable difference compared to the other groups in terms of a higher percentage of BM defect type, the lowest retinal slope (70.6 +/- 12.0degrees) and the earlier termination of retinal layers. The generalized enlargement disc group showed the highest percentage of curved BM type. Retinal slope angle increased with age and decreased with axial length.
CONCLUSIONS
In the beta-zone of peripapillary atrophy, there were several differences in the shape of Bruch's membrane, composition of retinal layers and the retinal slope according to the optic disc shape.
Keyword
MeSH Terms
Figure
Reference
-
References
1. Sommer A, Katz J, Quigley HA, et al. Clinically detectable nerve fiber atrophy precedes the onset of glaucomatous field loss. Arch Ophthalmol. 1991; 109:77–83.
Article2. Park KH, Tomita G, Liou SY, Kitazawa Y. Correlation between peripapillary atrophy and optic nerve damage in normal-tension glaucoma. Ophthalmology. 1996; 103:1899–906.
Article3. Jonas JB, Naumann GO. Parapapillary chorioretinal atrophy in normal and glaucoma eyes. II. Correlations. Invest Ophthalmol Vis Sci. 1989; 30:919–26.4. Uchida H, Yamamoto T, Tomita G, Kitazawa Y. Peripapillary atro- phy in primary angle-closure glaucoma: a comparative study with primary open-angle glaucoma. Am J Ophthalmol. 1999; 127:121–8.5. Tezel G, Kass MA, Kolker AE, Wax MB. Comparative optic disc analysis in normal pressure glaucoma, primary open-angle glauco- ma, and ocular hypertension. Ophthalmology. 1996; 103:2105–13.6. Kono Y, Zangwill L, Sample PA, et al. Relationship between parapapillary atrophy and visual field abnormality in primary open-angle glaucoma. Am J Ophthalmol. 1999; 127:674–80.
Article7. Lee KY, Tomidokoro A, Sakata R, et al. Cross-sectional anatomic configurations of peripapillary atrophy evaluated with spectral do- main-optical coherence tomography. Invest Ophthalmol Vis Sci. 2010; 51:666–71.8. Nassif N, Cense B, Park B, et al. In vivo high-resolution video-rate spectral-domain optical coherence tomography of the human retina and optic nerve. Opt Express. 2004; 12:367–76.
Article9. Manjunath V, Shah H, Fujimoto JG, Duker JS. Analysis of peri- papillary atrophy using spectral domain optical coherence tomography. Ophthalmology. 2011; 118:531–6.10. Na JH, Moon BG, Sung KR, et al. Characterization of peripapillary atrophy using spectral domain optical coherence tomography. Korean J Ophthalmol. 2010; 24:353–9.
Article11. Geijssen HC, Greve EL. The spectrum of primary open angle glaucoma. I: Senile sclerotic glaucoma versus high tension glaucoma. Ophthalmic Surg. 1987; 18:207–13.
Article12. Geijssen HC, Greve EL. Focal ischaemic normal pressure glauco- ma versus high pressure glaucoma. Doc Ophthalmol. 1990; 75:291–301.13. Drance SM, et al. What can we learn from the disc appearance about the risk factors in glaucoma? Can J Ophthalmol. 2008; 43:322–7.
Article14. Broadway DC, Nicolela MT, Drance SM. Optic disk appearances in primary open-angle glaucoma. Surv Ophthalmol. 1999; 43(Suppl 1):S223–43.
Article15. Nicolela MT, Drance SM. Various glaucomatous optic nerve ap- pearances: clinical correlations. Ophthalmology. 1996; 103:640–9.16. Hayashi K, Tomidokoro A, Lee KY, et al. Spectral-domain optical coherence tomography of beta-zone peripapillary atrophy: influ- ence of myopia and glaucoma. Invest Ophthalmol Vis Sci. 2012; 53:1499–505.17. Curcio CA, Saunders PL, Younger PW, Malek G. Peripapillary chorioretinal atrophy: Bruch's membrane changes and photo- receptor loss. Ophthalmology. 2000; 107:334–43.18. Jonas JB, Nguyen XN, Gusek GC, Naumann GO. Parapapillary chorioretinal atrophy in normal and glaucoma eyes. I. Morphometric data. Invest Ophthalmol Vis Sci. 1989; 30:908–18.19. Jonas JB, Fernández MC, Naumann GO. Glaucomatous para- papillary atrophy. Occurrence and correlations. Arch Ophthalmol. 1992; 110:214–22.20. Jonas JB, Gründler AE. Correlation between mean visual field loss and morphometric optic disk variables in the open-angle glaucomas. Am J Ophthalmol. 1997; 124:488–97.
Article21. Park SC, De Moraes CG, Tello C, et al. In-vivo microstructural anatomy of beta-zone parapapillary atrophy in glaucoma. Invest Ophthalmol Vis Sci. 2010; 51:6408–13.
- Full Text Links
- Actions
-
Cited
- CITED
-
- Close
- Share
- Similar articles
-
- Measurement of Deep Optic Nerve Complex Structures with Two Spectral Domain Optical Coherence Tomography Instruments
- Changes in Optic Nerve Parameter Measurements on Spectral-Domain Optical Coherence Tomography, after Cataract Surgery
- The Comparison of Optic Disc Analysis between Heidelberg Retina Tomopgraph and Optical Coherence Tomography
- Characterization of Peripapillary Atrophy Using Spectral Domain Optical Coherence Tomography
- Correlation of Peripapillary Atrophy with Optic Disc Cupping and Disc Hemorrhage in Primary Open Angle Glaucoma


