Dynamic Contrast-Enhanced CT in Advanced Lung Cancer after Chemotherapy with/without Radiation Therapy: Can It Predict Treatment Responsiveness of the Tumor?
- Affiliations
-
- 1Department of Radiology and Research Institute of Radiological Science, Yonsei University Health System, Seoul, Korea. thkim1@yuhs.ac
- KMID: 2208816
- DOI: http://doi.org/10.3348/jksr.2013.69.2.131
Abstract
- PURPOSE
To evaluate the contrast enhancement patterns of lung cancer after chemotherapy using a dynamic contrast-enhanced (DCE) CT and to determine whether the enhancement patterns of tumors at early stages of treatment can predict treatment responses.
MATERIALS AND METHODS
Forty-two patients with advanced lung cancers underwent DCE-CT and follow-up CT after chemotherapy. We evaluated peak and net enhancement (PE and NE, respectively) and time-density curves (TDCs) (type A, B, C, and D) on DCE-CT images. Treatment responses were evaluated using revised Response Evaluation Criteria in Solid Tumor criteria.
RESULTS
NE and PE values were significantly higher in the progressive disease (PD) groups than in the stable disease (SD) or partial response (PR) groups (p < 0.05). Types B, C, and D on TDCs were observed mostly in the PR and SD groups (96.0%), whereas type A was most frequent in the SD and PD groups (97.2%), which were significantly different in terms of PE and NE.
CONCLUSION
Contrast enhancement pattern regarding the response of treatment on DCE-CT images could be helpful in predicting treatment response of advanced lung cancer after treatment.
MeSH Terms
Figure
-
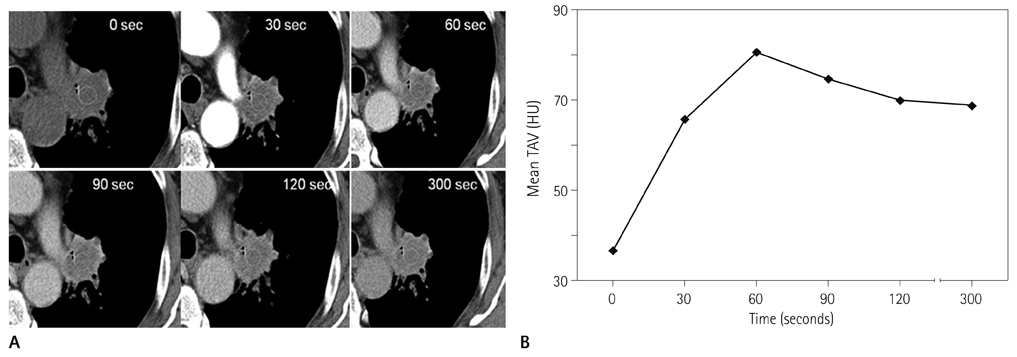
Fig. 1 A 69-year-old men with stage IV non-small cell carcinoma in the left upper lobe with lung to lung metastasis. A. Dynamic contrast-enhanced CT images at pre-contrast, 30, 60, 90, 120 sec, and 5 minutes over the lesion after chemotherapy with a cisplatin regimen. B. The time-density curve shows early wash-in and wash-out pattern consistent with type A. Net enhancement and peak enhancement values were 44 HU and 81 HU, respectively. The lesion was categorized as progressive disease according to the Response Evaluation Criteria in Solid Tumor criteria. Note.-HU = Hounsfield unit, TAV = tumor attenuation value
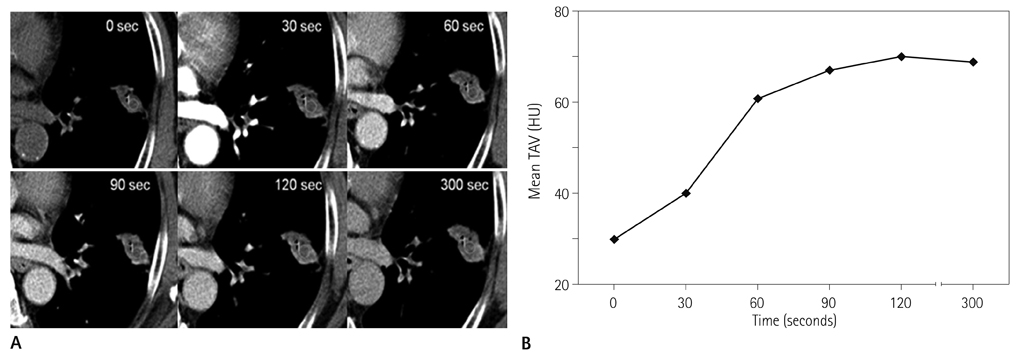
Fig. 2 An 83-year-old woman with stage IV adenocarcinoma in the left upper lobe. A. Dynamic contrast-enhanced CT images at pre-contrast, 30, 60, 90, 120 sec, and 5 minutes over the lesion after chemotherapy with agefinitib regimen. B. The time-density curve shows early wash-in and continuous acceleration pattern consistent with type C. Net enhancement and peak enhancement values were 40 HU and 70 HU, respectively. The lesion was categorized as stable disease according to the Response Evaluation Criteria in Solid Tumor criteria. Note.-HU = Hounsfield unit, TAV = tumor attenuation value
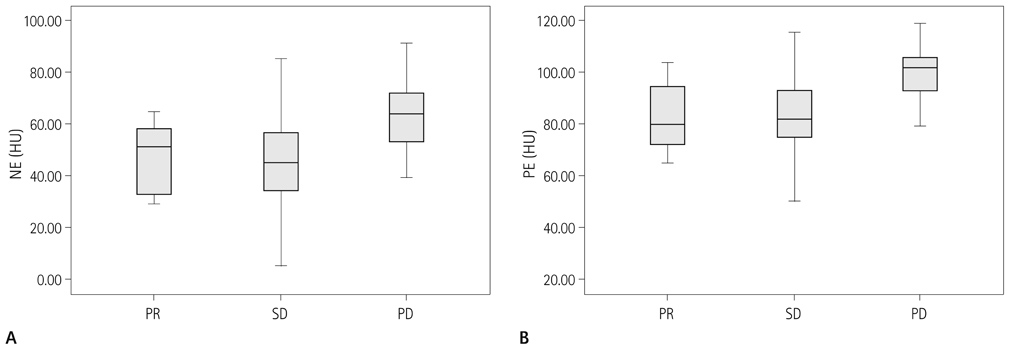
Fig. 3 Mean values of net and peak enhancement in 61 lesions among three groups according to the Response Evaluation Criteria in Solid Tumor criteria on the dynamic contrast-enhanced CT images in 41 patients with advanced lung cancer. A. Net enhancement (NE) differed significantly between the PD group and the PR or SD groups (p < 0.05). B. Peak enhancement (PE) differed significantly between the PD group and the PR or SD groups (p < 0.05). Note.-HU = Hounsfield unit, PD = progressive disease, PR = partial response, SD = stable disease
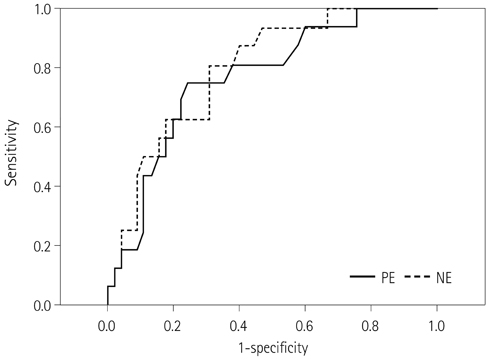
Fig. 4 Receiver operating characteristic curves of peak enhancement (PE) and net enhancement (NE) values. Sensitivity and specificity for differentiating between the PD group and the PR or SD groups were 62.5% and 82.2%, respectively, at a cutoff NE value of 60.3 HU, and 75.0% and 75.6%, respectively, at a cutoff PE value of 94.5 HU. Note.-HU = Hounsfield unit, PD = progressive disease, PR = partial response, SD = stable disease
Reference
-
1. Jemal A, Siegel R, Ward E, Murray T, Xu J, Thun MJ. Cancer statistics, 2007. CA Cancer J Clin. 2007; 57:43–66.2. Schiller JH, Harrington D, Belani CP, Langer C, Sandler A, Krook J, et al. Comparison of four chemotherapy regimens for advanced non-small-cell lung cancer. N Engl J Med. 2002; 346:92–98.3. Pfister DG, Johnson DH, Azzoli CG, Sause W, Smith TJ, Baker S Jr, et al. American Society of Clinical Oncology treatment of unresectable non-small-cell lung cancer guideline: update 2003. J Clin Oncol. 2004; 22:330–353.4. Eisenhauer EA, Therasse P, Bogaerts J, Schwartz LH, Sargent D, Ford R, et al. New response evaluation criteria in solid tumours: revised RECIST guideline (version 1.1). Eur J Cancer. 2009; 45:228–247.5. Lara PN Jr, Redman MW, Kelly K, Edelman MJ, Williamson SK, Crowley JJ, et al. Disease control rate at 8 weeks predicts clinical benefit in advanced non-small-cell lung cancer: results from Southwest Oncology Group randomized trials. J Clin Oncol. 2008; 26:463–467.6. Suzuki C, Jacobsson H, Hatschek T, Torkzad MR, Bodén K, Eriksson-Alm Y, et al. Radiologic measurements of tumor response to treatment: practical approaches and limitations. Radiographics. 2008; 28:329–344.7. Mazumdar M, Smith A, Schwartz LH. A statistical simulation study finds discordance between WHO criteria and RECIST guideline. J Clin Epidemiol. 2004; 57:358–365.8. Dorow DS, Cullinane C, Conus N, Roselt P, Binns D, McCarthy TJ, et al. Multi-tracer small animal PET imaging of the tumour response to the novel pan-Erb-B inhibitor CI-1033. Eur J Nucl Med Mol Imaging. 2006; 33:441–452.9. Su H, Bodenstein C, Dumont RA, Seimbille Y, Dubinett S, Phelps ME, et al. Monitoring tumor glucose utilization by positron emission tomography for the prediction of treatment response to epidermal growth factor receptor kinase inhibitors. Clin Cancer Res. 2006; 12:5659–5667.10. Schaefer JF, Vollmar J, Schick F, Vonthein R, Seemann MD, Aebert H, et al. Solitary pulmonary nodules: dynamic contrast-enhanced MR imaging--perfusion differences in malignant and benign lesions. Radiology. 2004; 232:544–553.11. Zou Y, Zhang M, Wang Q, Shang D, Wang L, Yu G. Quantitative investigation of solitary pulmonary nodules: dynamic contrast-enhanced MRI and histopathologic analysis. AJR Am J Roentgenol. 2008; 191:252–259.12. de Langen AJ, van den Boogaart V, Lubberink M, Backes WH, Marcus JT, van Tinteren H, et al. Monitoring response to antiangiogenic therapy in non-small cell lung cancer using imaging markers derived from PET and dynamic contrast-enhanced MRI. J Nucl Med. 2011; 52:48–55.13. Lind JS, Meijerink MR, Dingemans AM, van Kuijk C, Ollers MC, de Ruysscher D, et al. Dynamic contrast-enhanced CT in patients treated with sorafenib and erlotinib for non-small cell lung cancer: a new method of monitoring treatment? Eur Radiol. 2010; 20:2890–2898.14. Kiessling F, Boese J, Corvinus C, Ederle JR, Zuna I, Schoenberg SO, et al. Perfusion CT in patients with advanced bronchial carcinomas: a novel chance for characterization and treatment monitoring? Eur Radiol. 2004; 14:1226–1233.15. Valentin J. Avoidance of radiation injuries from medical interventional procedures. Ann ICRP. 2000; 30:7–67.16. Jeong YJ, Lee KS, Jeong SY, Chung MJ, Shim SS, Kim H, et al. Solitary pulmonary nodule: characterization with combined wash-in and washout features at dynamic multi-detector row CT. Radiology. 2005; 237:675–683.17. Lazanyi KS, Abramyuk A, Wolf G, Tokalov S, Zöphel K, Appold S, et al. Usefulness of dynamic contrast enhanced computed tomography in patients with non-small-cell lung cancer scheduled for radiation therapy. Lung Cancer. 2010; 70:280–285.18. Donmez FY, Yekeler E, Saeidi V, Tunaci A, Tunaci M, Acunas G. Dynamic contrast enhancement patterns of solitary pulmonary nodules on 3D gradient-recalled echo MRI. AJR Am J Roentgenol. 2007; 189:1380–1386.19. Azzoli CG, Baker S Jr, Temin S, Pao W, Aliff T, Brahmer J, et al. American Society of Clinical Oncology Clinical Practice Guideline update on chemotherapy for stage IV non-small-cell lung cancer. J Clin Oncol. 2009; 27:6251–6266.20. Jiang NC, Han P, Zhou CK, Zheng JL, Shi HS, Xiao J. Dynamic enhancement patterns of solitary pulmonary nodules at multi-detector row CT and correlation with vascular endothelial growth factor and microvessel density. Ai Zheng. 2009; 28:164–169.21. Woodford C, Yartsev S, Dar AR, Bauman G, Van Dyk J. Adaptive radiotherapy planning on decreasing gross tumor volumes as seen on megavoltage computed tomography images. Int J Radiat Oncol Biol Phys. 2007; 69:1316–1322.22. Werner-Wasik M, Xiao Y, Pequignot E, Curran WJ, Hauck W. Assessment of lung cancer response after nonoperative therapy: tumor diameter, bidimensional product, and volume. A serial CT scan-based study. Int J Radiat Oncol Biol Phys. 2001; 51:56–61.
- Full Text Links
-
- Actions
-
Cited
- CITED
-
- Close
- Share
-
- Similar articles
-
- Management of Locally Advanced Non-small Cell Lung Cancer
- Primary Lung Cancer: Utility of Contrast-enhanced Dynamic CT in Diagnosis with Histopathologic Correlation
- Chemo-radiation Therapy for Locally Advanced Non-Small Cell Lung Cancer
- Clear Cell "Sugar" Tumor of the Lung: A Well-Enhanced Mass with an Early Washout Pattern on Dynamic Contrast-Enhanced Computed Tomography
- Immunotherapy for Non-Small Cell Lung Cancer
