Does the ADC Map have Additional Clinical Significance Compared to the DWI in the Brain Infarction?
- Affiliations
-
- 1Department of Radiology, College of Medicine, Dong-A University, Busan, Korea. sschoi317@yahoo.co.kr
- KMID: 2144328
- DOI: http://doi.org/10.13104/jksmrm.2013.17.4.267
Abstract
- PURPOSE
To re-evaluate additional clinical significance of the apparent diffusion coefficient (ADC) map in the inference of infarction stage, authors studied the evolution patterns of the DWI and the ADC map of the brain infarction.
MATERIALS AND METHODS
In 127 patients with cerebral infarctions, including follow-up checks, 199 studies were performed. They were classified as hourly (117 studies)-, daily (108 studies)-, weekly (62 studies)-based groups. The signal intensity (SI) was measured at the core of the infarction and contralateral area with ROI of 0.3 cm2 or more on the images of the DWI and the ADC map, and calculated the ratios of SI and ADC value of the infarction area / contralateral normal area, and compared the patterns of the change according to the evolution.
RESULTS
Infarction was detected as early as 1 hour after the attack, and the ratio of SI in the DWI became over than 2 after 12 hours, which showed a plateau until the 6th day. Thereafter, it decreased slowly to 1 on the 30th day, and changed to lower SI than the surrounding brain. The ratio in the ADC map became 0.46 in 24 hours after the attack, and increased slowly to 1 in the 15th day. Thereafter, it became a higher value than the surrounding brain. Overall, the ratio in the ADC map changed earlier than in the DWI, and the ratio curves showed inverse pattern each other according to the evolution of the infarction.
CONCLUSION
The evolution patterns of infarction on the ADC map showed an inverse curve of DWI curve, which means that the ADC value is accurately predictable from DWI, and the ADC map joined with the DWI seems helpful in the determination of subacute infarction between 15 to 30 days.
Figure
-

Fig. 1 Example of ROI measurement; DWI (left) and ADC map (right) in a 68-year-old woman examined 46 hours after stroke onset. Note the ROIs placed on the lesion and contralateral normal-appearing hemisphere.
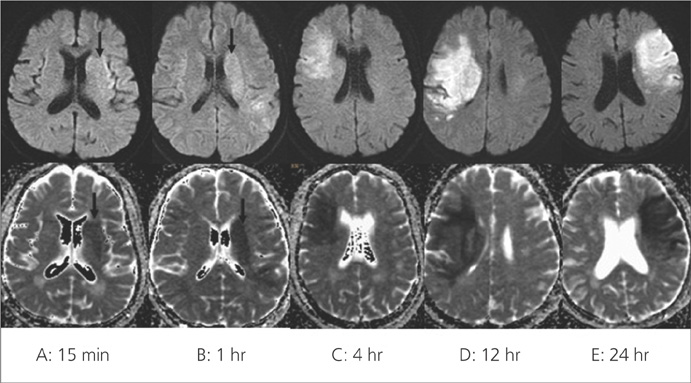
Fig. 2 Examples of the representative cases of different stroke onset; Infarction areas show high signal intensities on the DWI(upper row) and show low signal intensities on the ADC map (lower row) even less than an hour (arrows), and become peculiar up to 24 hours (A, B, C, D, E; different cases of time onset).

Fig. 3 The evolution curves of average rSIDWI and rADC by hourly-based analysis; Curves show the SI on the DWI is increasing and the SI on the ADC map is decreasing continuously during first 24 hours.

Fig. 4 The evolution curves of average rSIDWI and rADC by daily-based analysis; Curves show the SI on the DWI is decreasing after peak value on the 6th day and the SI on the ADC map is increasing after the lowest value on the first day.

Fig. 5 Examples of the representative cases of different stroke onset; Note pseudonormalization (arrows) of the infarction on the ADC map in the case B, and on the DWI in the case of C (A, B, C, D, E; different cases of time onset).
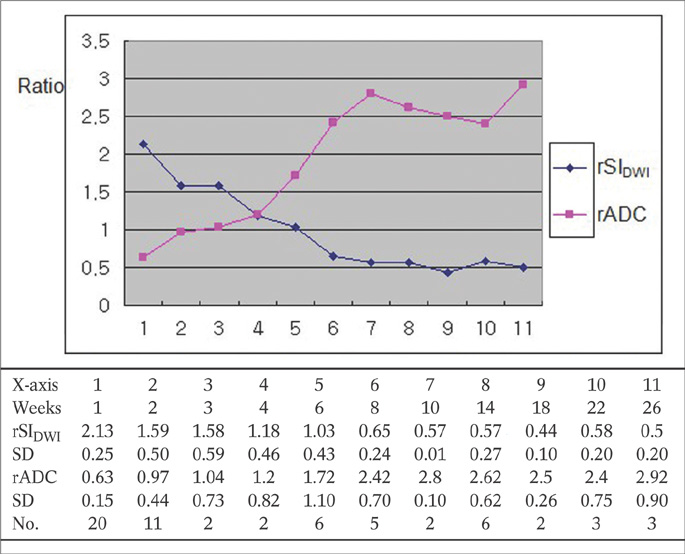
Fig. 6 The evolution curves of average rSIDWI and rADC by weekly-based analysis; Curves show the SI on the DWI is decreasing and the SI on the ADC map is increasing continuously after the first week.
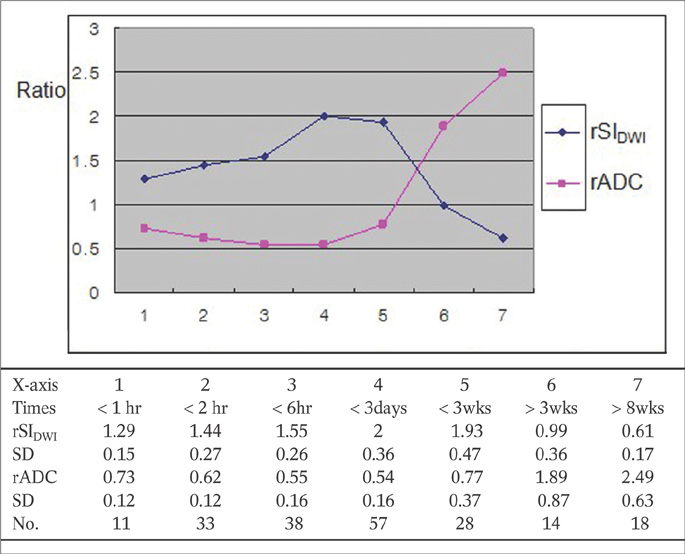
Fig. 7 The evolution curves of average rSIDWI and rADC with all case; Curves show the evolution pattern of SI according to the time course on the ADC map is inversely correlated with DWI.
Reference
-
1. van Everdingen KJ, van der Grond J, Kappelle LJ, Ramos LMP, Mali WPTM. Diffusion-weighted magnetic resonance imaging in acute stroke. Stroke. 1998; 29:1783–1790.2. Lansberg MG, Thijs VN, O'Brien MW, et al. Evolution of apparent diffusion coefficient, diffusion-weighted, and T2-weighted signal intensity of acute stroke. AJNR Am J Neuroradiol. 2001; 22:637–644.3. Barajas RF Jr, Rubenstein JL, Chang JS, Hwang J, Cha S. Diffusion-weighted MR imaging derived apparent diffusion coefficient is predictive of clinical outcome in primary central nervous system lymphoma. AJNR Am J Neuroradiol. 2010; 31:60–66.4. Desmond PM, Lovell AC, Rawlinson AA, et al. The value of apparent diffusion coefficient maps in early cerebral ischemia. AJNR Am J Neuroradiol. 2001; 22:1260–1267.5. Rana AK, Wardlaw JM, Armitage PA, Bastin ME. Apparent diffusion coefficient (ADC) measurements may be more reliable and reproducible than lesion volume on diffusion-weighted images from patients with acute ischemic stroke; implications for study design. Magn Reson Imaging. 2003; 21:617–624.6. Bråtane BT, Bastan B, Fisher M, Bouley J, Henninger N. Ischemic lesion volume determination on diffusion weighted images vs. apparent diffusion coefficient maps. Brain Res. 2009; 1279:182–188.7. Oppenheim C, Grandin C, Samson Y, et al. Is there an apparent diffusion coefficient threshold in predicting tissue viability in hyperacute stroke? Stroke. 2001; 32:2486–2491.8. Sibon I, Menegon P, Orgogozo JM, et al. Inter- and intraobserver reliability of five MRI sequences in the evaluation of the final volume of cerebral infarct. J Magn Reson Imaging. 2009; 29:1280–1284.9. Na DG, Thijs VN, Albers GW, Moseley ME, Marks MP. Diffusion-weighted MR imaging in acute ischemia: Value of apparent diffusion coefficient and signal intensity thresholds in predicting tissue at risk and final infarct size. AJNR Am J Neuroradiol. 2004; 25:1331–1336.10. Eastwood JD, Engelter ST, MacFall JF, Delong DM, Provenzale JM. Quantitative assessment of the time course of infarct signal intensity on diffusion-weighted images. AJNR Am J Neuroradiol. 2003; 24:680–687.11. Yang Q, Tress BM, Barber PA, et al. Serial study of apparent diffusion coefficient and anisotropy in patients with acute stroke. Stroke. 1999; 30:2382–2390.12. Copen WA, Schwamm LH, González RG, et al. Ischemic stroke: effects of etiology and patient age on the time course of the core apparent diffusion coefficient. Radiology. 2001; 221:27–34.13. Burdette JH, Ricci PE, Petitti N, Elster AD. Cerebral infarction: time course of signal intensity changes on diffusion-weighted MR images. AJR Am J Roentgenol. 1998; 171:791–795.
- Full Text Links
-
- Actions
-
Cited
- CITED
-
- Close
- Share
-
- Similar articles
-
- Clinical applications and characteristics of apparent diffusion coefficient maps for the brain of two dogs
- Diffusion-Weighted MR Imaging of Spinal Cord Infarction
- Serial Magnetic Resonance Images of a Right Middle Cerebral Artery Infarction : Persistent Hyperintensity on Diffusion-Weighted MRI Over 8 Months
- Early Ischemic Stroke: Comparison of Diffusion Weighted Images and ADC maps
- A Serial Diffusion-weighted MR Imaging Study in Delayed Postanoxic Encephalopathy
