Differentiation between Focal Malignant Marrow-Replacing Lesions and Benign Red Marrow Deposition of the Spine with T2*-Corrected Fat-Signal Fraction Map Using a Three-Echo Volume Interpolated Breath-Hold Gradient Echo Dixon Sequence
- Affiliations
-
- 1Department of Radiology, Gangnam Severance Hospital, Yonsei University College of Medicine, Seoul 135-720, Korea. agn70@yuhs.ac
- 2MR Applications Development, Siemens AG, Healthcare Sector, Erlangen D-91052, Germany, Korea.
- 3Siemens Ltd., Seoul 120-837, Korea.
- 4Department of Radiology, Severance Hospital, Yonsei University College of Medicine, Seoul 120-752, Korea.
- KMID: 1794650
- DOI: http://doi.org/10.3348/kjr.2014.15.6.781
Abstract
OBJECTIVE
To assess the feasibility of T2*-corrected fat-signal fraction (FF) map by using the three-echo volume interpolated breath-hold gradient echo (VIBE) Dixon sequence to differentiate between malignant marrow-replacing lesions and benign red marrow deposition of vertebrae.
MATERIALS AND METHODS
We assessed 32 lesions from 32 patients who underwent magnetic resonance imaging after being referred for assessment of a known or possible vertebral marrow abnormality. The lesions were divided into 21 malignant marrow-replacing lesions and 11 benign red marrow depositions. Three sequences for the parameter measurements were obtained by using a 1.5-T MR imaging scanner as follows: three-echo VIBE Dixon sequence for FF; conventional T1-weighted imaging for the lesion-disc ratio (LDR); pre- and post-gadolinium enhanced fat-suppressed T1-weighted images for the contrast-enhancement ratio (CER). A region of interest was drawn for each lesion for parameter measurements. The areas under the curve (AUC) of the parameters and their sensitivities and specificities at the most ideal cutoff values from receiver operating characteristic curve analysis were obtained. AUC, sensitivity, and specificity were respectively compared between FF and CER.
RESULTS
The AUCs of FF, LDR, and CER were 0.96, 0.80, and 0.72, respectively. In the comparison of diagnostic performance between the FF and CER, the FF showed a significantly larger AUC as compared to the CER (p = 0.030), although the difference of sensitivity (p = 0.157) and specificity (p = 0.157) were not significant.
CONCLUSION
Fat-signal fraction measurement using T2*-corrected three-echo VIBE Dixon sequence is feasible and has a more accurate diagnostic performance, than the CER, in distinguishing benign red marrow deposition from malignant bone marrow-replacing lesions.
MeSH Terms
-
Adult
Aged
Aged, 80 and over
Area Under Curve
Bone Marrow Cells/cytology
Bone Marrow Transplantation
Contrast Media/diagnostic use
Diagnosis, Differential
Female
Humans
*Magnetic Resonance Imaging
Male
Middle Aged
ROC Curve
Sensitivity and Specificity
Signal-To-Noise Ratio
Spinal Diseases/diagnosis/*radiography
Contrast Media
Figure
-

Fig. 1 Region of interest (ROI) placement and parameter measurement. Screen-captured image during ROI placement for parameter measurement of lesion and disc on workstation is shown. Images used for analysis were from fat-signal fraction (FF) mapping image from three-point Dixon volume interpolated breath-hold gradient-echo sequence (top left), T1-weighted imaging (T1WI, top right), and pre- (bottom left) and post- (bottom right) gadolinium (Gd)-enhanced fat suppressed (FS) T1WI. Details regarding ROI placement are described in text. FF was obtained from FF mapping sequence image by directly placing ROI. Lesion-disc ratio (LDR) was obtained from image of T1WI. Contrast-enhancement ratio (CER) was obtained from images of pre- and post-Gd-enhanced FS T1WI. Calculations for these parameters are described in text. Images of this capture were obtained from representative metastatic lesion from gastric cancer in 57-year-old man. FF, LDR, and CER were 9.8%, 92.1%, and 157.6%, respectively. All parameters indicated that lesion was malignant.

Fig. 2 Example of false-negative result (erroneously defined as benign) of fat-signal fraction (FF) illustrated from MR images and computed tomography (CT) image obtained from 54-year-old man. He was referred for assessment of metastatic bone lesion of 4th lumbar (L4) vertebra from prostate cancer, which was suspected on bone scintigraphy by newly developed radiopharmaceutical uptake. Images obtained from MR imaging (FF mapping sequence (A), T1-weighted imaging (T1WI) (B), post-gadolinium-enhanced fat suppressed T1WI (C)), and non-contrast CT image (D) of L4 vertebral body are shown. FF image revealed high FF of lesion (arrow in A), which indicated considerable amount of fat. Lesion showed low signal intensity on T1WI (arrow in B), and it did not show avid enhancement (arrow in C). Because lesion newly developed during follow-up and appeared to be space-occupying lesion rather than degenerative change or osteitis related to enthesitis, it was categorized as group 1 (malignant marrow-replacing lesion) and was considered metastatic bone lesion from prostate cancer. FF, lesion-disc ratio (LDR), and contrast-enhancement ratio (CER) were calculated as 28.1%, 36.7%, and 49.5%, respectively, which shows that FF and CER erroneously indicated lesion was benign (false-negative results), whereas LDR correctly indicated lesion was malignant (true-positive result). Axial non-contrast CT image (D) revealed osteoblastic characteristics of this metastatic lesion.
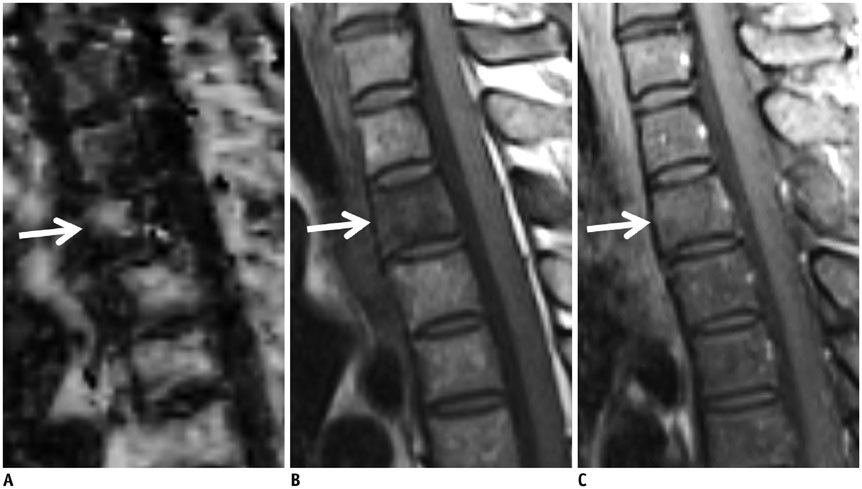
Fig. 3 Example of false-positive result (erroneously defined as malignant) of lesion-disc ratio (LDR) illustrated from MR images obtained from 46-year-old woman. She was referred for assessment of cause of back pain, and she was incidentally found to have marrow lesion of 2nd thoracic (T2) vertebra. Images obtained from fat-signal fraction (FF) mapping sequence (A), T1-weighted imaging (T1WI) (B), and post-gadolinium-enhanced fat suppressed T1WI (C) are shown. FF image revealed high FF of lesion (arrow in A), which indicated considerable amount of fat. Lesion showed low signal intensity on T1WI (arrow in B), and it did not show avid enhancement (arrow in C). Lesion almost completely replaced T2 vertebral body, and region of interest was drawn as described in text. CT-guide biopsy revealed that lesion was hypercellular red marrow (80% cellularity) without evidence of malignancy; hence, lesion was categorized as group 2 (benign red marrow deposition). FF, LDR, and contrast-enhancement ratio (CER) were calculated as 39.8%, 88.9%, and 81.5%, respectively, which shows that FF and CER correctly indicated lesion was benign (true-negative result), whereas LDR erroneously indicated lesion was malignant (false-positive result).
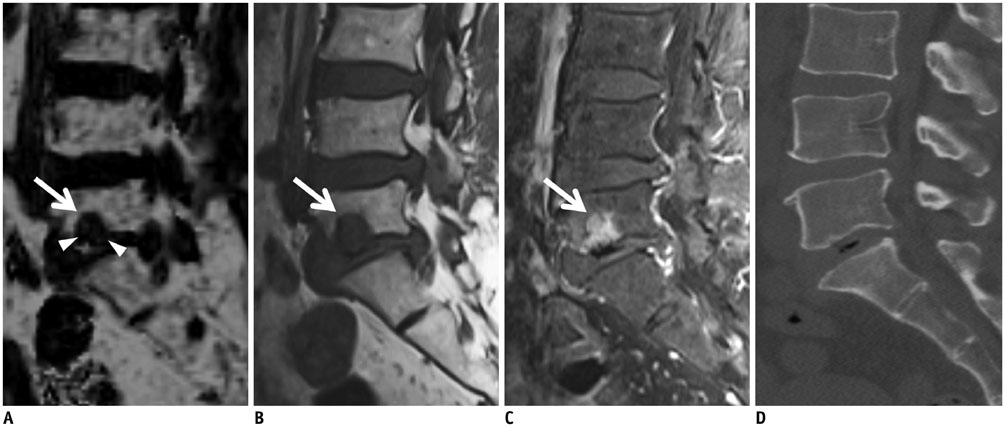
Fig. 4 Example of false-positive result (erroneously defined as malignant) of contrast-enhancement ratio (CER) illustrated from MR images obtained from 66-year-old woman. She was referred for assessment of cause of back pain, and she was incidentally found to have marrow lesion of 5th lumbar (L5) vertebra. Images obtained from fat-signal fraction (FF) mapping sequence (A), T1-weighted imaging (T1WI) (B), and post-gadolinium-enhanced fat suppressed T1WI (C) of L5 vertebral body are shown. FF image showed focal lesion (arrow in A). Multifocal high FF of lesion (arrowheads in A) was observed, which indicated multifocal fat depostion. Lesion showed low signal intensity on T1WI (arrow in B), and it had relatively avid enhancement (arrow in C). Because lesion did not show morphologic or signal change on 6-month follow-up MR imaging and did not show mineralization or osteolytic lesion at corresponding area on CT scan (D), lesion was categorized as group 2 (benign red marrow deposition). FF, lesion-disc ratio (LDR), and CER were calculated as 26.0%, 101.8%, and 132.4%, respectively, which shows that LDR and CER erroneously indicated lesion was malignant (false-positive result), whereas FF correctly indicated lesion was benign (true-negative result).
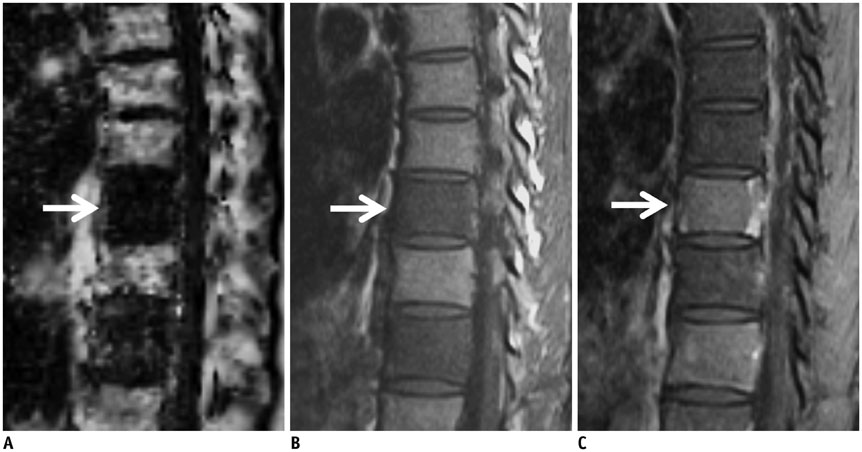
Fig. 5 Example of false-negative result (erroneously defined as benign) of contrast-enhancement ratio (CER) illustrated from MR images obtained from 42-year-old man. He was referred for assessment of metastasis at vertebral column, which was suspected on 18F-fludeoxyglucose (FDG) positron-emission tomographic (PET)-computed tomography (CT). Images obtained from fat-signal fraction (FF) mapping sequence (A), T1-weighted imaging (T1WI) (B), and post-gadolinium-enhanced fat suppressed T1WI (C) of T9 vertebral body. FF image revealed low FF of lesion (arrow in A), which indicated low amount of fat. Lesion showed low signal intensity on T1WI (arrow in B), and it did not show avid enhancement (arrow in C). Because 18F-FDG PET-CT of this patient showed multiple increased FDG uptakes of skeleton and lung, T9 vertebral lesion was categorized as group 1 (malignant marrow-replacing lesion). Lesion almost completely replaced vertebral body, and region of interest was drawn as described in text. FF, lesion-disc ratio (LDR), and CER were calculated as 12.8%, 82.5%, and 51.6%, respectively, which shows that CER erroneously indicated lesion was benign (false-negative result), whereas FF and LDR correctly indicated lesion was malignant (true-positive result).
Reference
-
1. Swartz PG, Roberts CC. Radiological reasoning: bone marrow changes on MRI. AJR Am J Roentgenol. 2009; 193:3 Suppl. S1–S4. Quiz S5-S9.2. Shah LM, Hanrahan CJ. MRI of spinal bone marrow: part I, techniques and normal age-related appearances. AJR Am J Roentgenol. 2011; 197:1298–1308.3. Tall MA, Thompson AK, Vertinsky T, Palka PS. MR imaging of the spinal bone marrow. Magn Reson Imaging Clin N Am. 2007; 15:175–198. vi4. Zajick DC Jr, Morrison WB, Schweitzer ME, Parellada JA, Carrino JA. Benign and malignant processes: normal values and differentiation with chemical shift MR imaging in vertebral marrow. Radiology. 2005; 237:590–596.5. Ragab Y, Emad Y, Gheita T, Mansour M, Abou-Zeid A, Ferrari S, et al. Differentiation of osteoporotic and neoplastic vertebral fractures by chemical shift {in-phase and out-of phase} MR imaging. Eur J Radiol. 2009; 72:125–133.6. Erly WK, Oh ES, Outwater EK. The utility of in-phase/opposed-phase imaging in differentiating malignancy from acute benign compression fractures of the spine. AJNR Am J Neuroradiol. 2006; 27:1183–1188.7. Zampa V, Cosottini M, Michelassi C, Ortori S, Bruschini L, Bartolozzi C. Value of opposed-phase gradient-echo technique in distinguishing between benign and malignant vertebral lesions. Eur Radiol. 2002; 12:1811–1818.8. Wismer GL, Rosen BR, Buxton R, Stark DD, Brady TJ. Chemical shift imaging of bone marrow: preliminary experience. AJR Am J Roentgenol. 1985; 145:1031–1037.9. Disler DG, McCauley TR, Ratner LM, Kesack CD, Cooper JA. In-phase and out-of-phase MR imaging of bone marrow: prediction of neoplasia based on the detection of coexistent fat and water. AJR Am J Roentgenol. 1997; 169:1439–1447.10. Kühn JP, Evert M, Friedrich N, Kannengiesser S, Mayerle J, Thiel R, et al. Noninvasive quantification of hepatic fat content using three-echo dixon magnetic resonance imaging with correction for T2* relaxation effects. Invest Radiol. 2011; 46:783–778.11. Cassidy FH, Yokoo T, Aganovic L, Hanna RF, Bydder M, Middleton MS, et al. Fatty liver disease: MR imaging techniques for the detection and quantification of liver steatosis. Radiographics. 2009; 29:231–260.12. Geith T, Schmidt G, Biffar A, Dietrich O, Dürr HR, Reiser M, et al. Comparison of qualitative and quantitative evaluation of diffusion-weighted MRI and chemical-shift imaging in the differentiation of benign and malignant vertebral body fractures. AJR Am J Roentgenol. 2012; 199:1083–1092.13. Chen WT, Shih TT, Chen RC, Lo HY, Chou CT, Lee JM, et al. Blood perfusion of vertebral lesions evaluated with gadolinium-enhanced dynamic MRI: in comparison with compression fracture and metastasis. J Magn Reson Imaging. 2002; 15:308–314.14. Yamaguchi T, Iwata J, Sugihara S, McCarthy EF Jr, Karita M, Murakami H, et al. Distinguishing benign notochordal cell tumors from vertebral chordoma. Skeletal Radiol. 2008; 37:291–299.15. Zhao J, Krug R, Xu D, Lu Y, Link TM. MRI of the spine: image quality and normal-neoplastic bone marrow contrast at 3 T versus 1.5 T. AJR Am J Roentgenol. 2009; 192:873–880.16. Pfirrmann CW, Metzdorf A, Zanetti M, Hodler J, Boos N. Magnetic resonance classification of lumbar intervertebral disc degeneration. Spine (Phila Pa 1976). 2001; 26:1873–1187.17. Buckley DL, Parker GJM. Measuring contrast agent concentration in T1-weighted dynamic contrast-enhanced MRI. In : Jackson A, Buckley DL, Parker GJM, editors. Dynamic contrast-enhanced magnetic resonance imaging in oncology. 1st ed. Berlin, London: Springer;2004. p. 69–79.18. Griffith JF, Yeung DK, Ma HT, Leung JC, Kwok TC, Leung PC. Bone marrow fat content in the elderly: a reversal of sex difference seen in younger subjects. J Magn Reson Imaging. 2012; 36:225–230.19. Vande Berg BC, Malghem J, Lecouvet FE, Maldague B. Classification and detection of bone marrow lesions with magnetic resonance imaging. Skeletal Radiol. 1998; 27:529–545.20. Carroll KW, Feller JF, Tirman PF. Useful internal standards for distinguishing infiltrative marrow pathology from hematopoietic marrow at MRI. J Magn Reson Imaging. 1997; 7:394–398.21. Eito K, Waka S, Naoko N, Makoto A, Atsuko H. Vertebral neoplastic compression fractures: assessment by dual-phase chemical shift imaging. J Magn Reson Imaging. 2004; 20:1020–1024.22. Dixon WT. Simple proton spectroscopic imaging. Radiology. 1984; 153:189–194.23. Kovanlikaya A, Guclu C, Desai C, Becerra R, Gilsanz V. Fat quantification using three-point dixon technique: in vitro validation. Acad Radiol. 2005; 12:636–639.24. Reeder SB, Bice EK, Yu H, Hernando D, Pineda AR. On the performance of T2* correction methods for quantification of hepatic fat content. Magn Reson Med. 2012; 67:389–404.25. Rahmouni A, Divine M, Mathieu D, Golli M, Dao TH, Jazaerli N, et al. Detection of multiple myeloma involving the spine: efficacy of fat-suppression and contrast-enhanced MR imaging. AJR Am J Roentgenol. 1993; 160:1049–1052.26. Breault SR, Heye T, Bashir MR, Dale BM, Merkle EM, Reiner CS, et al. Quantitative dynamic contrast-enhanced MRI of pelvic and lumbar bone marrow: effect of age and marrow fat content on pharmacokinetic parameter values. AJR Am J Roentgenol. 2013; 200:W297–W303.27. Schweitzer ME, Levine C, Mitchell DG, Gannon FH, Gomella LG. Bull's-eyes and halos: useful MR discriminators of osseous metastases. Radiology. 1993; 188:249–252.
- Full Text Links
-
- Actions
-
Cited
- CITED
-
- Close
- Share
-
- Similar articles
-
- Simultaneous Estimation of the Fat Fraction and Râ‚‚* Via Tâ‚‚*-Corrected 6-Echo Dixon Volumetric Interpolated Breath-hold Examination Imaging for Osteopenia and Osteoporosis Detection: Correlations with Sex, Age, and Menopause
- Comparison of Multi-Echo Dixon Methods with Volume Interpolated Breath-Hold Gradient Echo Magnetic Resonance Imaging in Fat-Signal Fraction Quantification of Paravertebral Muscle
- Measurement and Compensation of Respiration-Induced B0 Variations in Lumbar Spine Bone Marrow Fat Quantification
- Fat Quantification in the Vertebral Body: Comparison of Modified Dixon Technique with Single-Voxel Magnetic Resonance Spectroscopy
- Comparison of Non-Breath-Hold T2-weighted Turbo Spin-Echo and Three Breath-Hold T2-weighted MR Images for Detection of Focal Hepatic Lesion
